100 Largest Losses in the Hydrocarbon Industry 1974-2019 - Marsh
←
→
Page content transcription
If your browser does not render page correctly, please read the page content below
INSIGHTS   MARCH 2020   26TH EDITION

100 Largest Losses in
the Hydrocarbon Industry
1974-2019
INSIGHTS   MARCH 2020       26TH EDITION

100 Largest Losses
in the Hydrocarbon
Industry, 1974-2019

CONTENTS

01     Foreword

02     Introduction

05    What Can We Learn From the Last
      Two Years?

13    30 Years on: Is History Repeating Itself?

19    Does Age Really Matter?

25    Organizational Resilience:
      Turning Uncertainty into Opportunity

29    Graphics

35    100 Largest Losses Descriptions

      36 Refineries
      50 Petrochemicals
      60 Gas Processing
      64 Terminals & Distribution
      68 Upstream
Foreword
It is my pleasure and privilege to write this foreword
for the 26th edition of Marsh JLT Specialty’s 100 Largest
Losses in the Hydrocarbon Industry report.                                                  SHAKEEL H KADRI
                                                                                            Executive director and CEO,
I have found this publication to be very useful for leaders in the process industries       Center for Chemical Process Safety
to help them comprehend past incidents and lessons learned, as well as assist in            American Institute of Chemical
the development of their improvement plans. At the Center for Chemical Process              Engineers (AIChE)
 Safety (CCPS®), whose mission is to help prevent/minimize significant process
safety incidents, we also take great interest in lessons and root causes identified in
 this document. CCPS was founded in 1985 in response to the Bhopal gas tragedy in
 Bhopal, India — its vision to protect people, property, and the environment through
the collective wisdom of its corporate members and their stakeholders.

The recent period (2018-2019) covered in this document provides valuable information
to start a dialogue on “Does Age Really Matter?” in our process safety improvement
journey. Three of the new additions to the 100 largest losses occurred at oil refineries
that were constructed more than 50 years ago. The largest loss in 2019 occurred at
a refinery that was triggered by a failure of a thinned pipe elbow installed almost 50
years earlier. The component met the metallurgy requirement that was permitted at the
time of installation; however, the component did not meet the intent of the American
Society for Testing and Materials recommendations made 20 years later. With plants
older than 30 years, the industry needs to look more closely at the risks associated with
implementation of an effective asset/mechanical integrity programs; keeping facilities
fit-for-service to meet the intent of newer critical safety standards, and keeping
effective knowledge transfer. The best-in-class companies apply a formal engineering
standards retrofitting program to ensure fitness to service requirement.

The exodus of an aging workforce has created a huge issue around how industry will
meet its critical need of process safety knowledge transfer. This issue needs a holistic
improvement approach, including enhanced education of process safety in engineering
education, effective assimilation of process safety knowledge for early career industry
professionals, and ongoing reinforcement of process safety training in the workforce.
In recent years, many organizations have accelerated their effort to improve this area
and progress is being made. My organization — AIChE/CCPS — in collaboration with
its stakeholders, has put a great deal of effort into helping improve this critical need.
This is a long-term issue that will require a collective effort by all stakeholders to
progress effectively.

This report provides an excellent opportunity to look back at our history, at key issues
these incidents have identified, and see if we are making progress. I urge all of you to
review this document, and hope you will be able to extract learnings that you can apply
to your organization to improve your process safety performance.

Shakeel H Kadri

                                                                                                         Marsh JLT Specialty• 1
Introduction
                                            Welcome to the 26th edition of Marsh JLT Specialty’s
                                            100 Largest Losses in the Hydrocarbon Industry report.
The last two                                The publication summarizes the 100 largest property
                                            damage losses from the hydrocarbon extraction,
years have                                  transport, and processing industry between 1974
been turbulent;                             and 2019.
eight property                              It allows us to look back at our industry’s history, identify key issues and trends from
damage losses                               large losses, and understand whether the industry is making progress.

from 2018-19                                The report considers lessons that can be learnt from the past two years (page 05),

were among the                              and whether history is repeating itself 30 years on (page 13). The correlation between
                                            a plant’s age and its impact on losses is then explored (page 19), before looking at how
50-largest energy                           organizational resilience can help turn uncertainty into opportunity (page 25).

losses of all time.                         The report’s information comes from Marsh JLT Specialty’s energy-loss database,
                                            which includes information gathered from our deep involvement in the hydrocarbon
                                            industry, and also from public records. The information covers more than 40 years,
                                            and includes almost 10,000 individual loss records (see “Methodology” for more
                                            information). Graphics drawing on this database can be found on pages 29-33 and
                                            through the report.

                                            The last two years have been turbulent; eight property damage losses from 2018-19
                                            were among the 50-largest energy losses of all time. Four recent losses were among
                                            the 20-largest losses ever.

                                            Not since 1988-89 (when six of the largest ever energy losses occurred — including
                                            Piper Alpha), has a two-year period seen such a high concentration of large losses.

                                            Declining risk standards in some areas over the past 12 years may be a factor. For
                                            example, our risk engineer surveys found that “engineering standards” at refineries
                                            declined over this period, and that both gas processing plants and terminals/
                                            distribution underwent an overall deterioration in risk quality over the past 12 years.

                                            We also found that plants older than 30 years are far more likely to experience losses,
                                            suggesting the industry needs to look more closely at the risks of older refineries and
                                            petrochemical plants.

                                            The cause of loss tends to vary depending on the age of a plant, found Liberty Specialty
                                            Markets, a contributor to this report. In the first 10 years of a plant’s operation, most
                                            losses are caused by operations-related failures.

                                            As plant operations experience develops, the number of losses reduces, until age takes
                                            its toll and there is a steep rise in both loss frequency and magnitude in plants more
                                            than 30-years-old. In plants older than 30 years, mechanical-integrity-related failures
                                            account for 65% of losses.

2 •100 Largest Losses in the Hydrocarbon Industry 1974-2019
Past Mistakes                                                                                               Methodology
The most commonly cited energy industry risk recommendations made by Marsh JLT
Specialty over the past few years (“systems of work,” “inspection,” and “fireproofing”)
were prevalent issues among the largest issues in 1988-99 — reinforcing the view that
                                                                                              Although every effort has been made to
the industry may not have learnt from past mistakes.
                                                                                              find out as much information as possible
                                                                                              about each of the losses referenced in this
During the Piper Alpha incident in 1988, the largest industry property damage loss of
                                                                                              report, there are some losses for which we
all time, there were shortcomings in all three areas of the root cause “systems of work”
                                                                                              still have too little information, preventing
(which includes permitting, management of change, and shift handover).
                                                                                              us from determining the contributing
                                                                                              factors. We have not included losses that
Similarly, the largest losses in 1988-1989 and 2018-19 both suffered from the escalating      occurred during projects’ construction
factors “emergency response plans” (ERPs) and “fire protection.” For example, the lack        phase, and marine transportation losses
of adequate ERPs caused the initial incident to escalate at Piper Alpha; at Campos Basin      are excluded except those involving
it took over a month to control the resulting fire, compounding the cost of the incident.     marine vessels moored at plant docks.

                                                                                              The loss values are reported in two ways:
In 2018-19, in all four of the largest losses, the sites were not well prepared for the
incidents that occurred. And in 2019 the US$600 million explosion at Limbe, Cameroon,
                                                                                              1. Adjusted property damage loss, based
began as a fire near a distillation unit on the refinery, which escalated to a much larger
                                                                                                 on the value of loss at the end of 2019.
explosion. More robust fixed-fire protection at site may have reduced or prevented this
escalation.                                                                                   2. Actual property damage loss, based on
                                                                                                 the value of the loss when it occurred.
Four key factors arguably prevent lessons from being learnt from losses:
                                                                                              Losses have been ordered according to
                                                                                              the adjusted property damage loss values.
         Distance
         Parties unconsciously feel less affected by events a long way away.                  Loss amounts include property damage,
                                                                                              debris removal, and clean-up costs. The
                                                                                              costs of business interruption, extra
         Culture                                                                              expense, employee injuries/fatalities,
         Preventing lessons from being implemented effectively.                               and liability claims are excluded from this
                                                                                              analysis. The direct on-premises clean-
                                                                                              up costs due to asbestos abatement,
         Tunnel vision                                                                        polychlorinated biphenyl removal, or
         Not realizing wider relevance of lessons.                                            released hydrocarbons and chemicals
                                                                                              following a fire, explosion, or other loss
                                                                                              event have traditionally been considered
         Time                                                                                 part of the property damage loss.
         Lessons are learnt, but then forgotten or solutions are insufficiently robust.

Given the 30 years that have elapsed between the two-worst periods in terms of the
20-largest losses, time would seem to be a particularly significant factor.

We hope this publication reminds energy-industry professionals of the range of losses
that can occur, the range of potential root causes, the fallibility of prevention measures,
and the scale of potential consequences. Only by reminding ourselves of these things,
can we begin to make the progress and improvements that the whole industry wants
to see.

                                                                                                        Marsh JLT Specialty• 3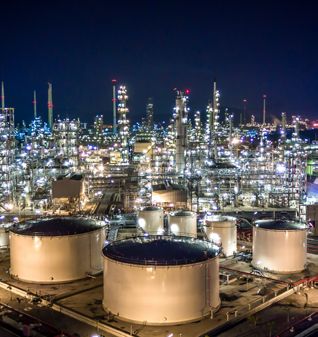
4 •100 Largest Losses in the Hydrocarbon Industry 1974-2019
CHAPTER 1
What Can We
Learn From the
Last Two Years?

                  Marsh JLT Specialty• 5
What Can We Learn
From the Last Two Years?
Four of the Following a loss of more than US$1,000 million in 2017 —
which ranks as one of the largest downstream property
new losses damage losses of all time — the past two years has been
were among another turbulent period for the energy industry, with an
the 20-largest unusually high number of large losses.
losses ever. Of these new losses, a remarkable eight were among the 50-largest industry losses
of all time, and four of these were among the 20-largest losses ever. Several more
occurred that were just below the 100-largest losses threshold (which now stands at
US$175 million).
New additions to the 100-largest losses (100LL) from the past two years cost an
unusually large total of US$4.5 billion in property damage, which takes the total of the
100LL to US$43.2 billion (based on December 31, 2019, pricing).
The past two years have seen several major losses from refineries and petrochemical assets,
particularly those built in the 1960s or earlier. Although not as prevalent in the 100LL,
terminals/distribution and gas processing plants have also experienced large losses.
In this publication the large property damage losses have been grouped by type
of facility into five categories of similar technology, to facilitate data comparisons:
FIGURE
Refineries accounts for half of all new additions to
1 the 100LL.
SOURCE: MARSH
REFINERIES TERMINAL & DISTRIBUTION
Accounts for 50% of new Accounts for 0% of new
additions and 39% overall. additions and 5% overall.
PETROCHEMICALS UPSTREAM
Accounts for 25% of new Accounts for 0% of new
additions and 26% overall. additions and 24% overall.
GAS PROCESSING
Accounts for 25% of new
additions and 6% overall.
6 •100 Largest Losses in the Hydrocarbon Industry 1974-2019Refineries
Four of the new additions to the 100LL occurred at oil refineries, and three of these
occurred at sites more than 50 years old (the link between age of asset and large losses
is explored more closely in “Does Age Really Matter?” on page 17).
High oil refinery
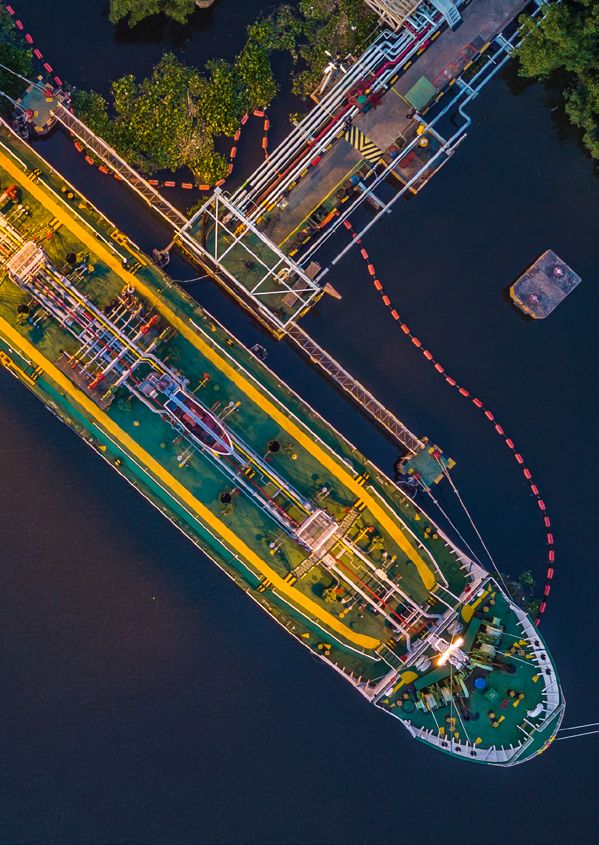
The two largest refinery losses both happened in the US (Philadelphia US$750 million,
and Wisconsin US$650 million), where there has been a well-publicized regulatory
utilization has
shift over the past two years including the rescinding of most of the Chemical Disaster
Rule. This shift could be construed as representing a lighter regulatory touch from the
continued over
Environmental Protection Agency, which has removed the following safeguards: the past two
• The requirement that chemical companies must determine the root causes of spills years and may
or explosions.
have contributed
• The requirement that an independent third party investigates spills, explosions,
and other disasters. to the high
• Training requirements for supervisors of plant operations. number of recent
• The requirement for the plant owner or operators to keep safety information up to date. losses.
• The requirement that plant owners release chemical hazard information to the public
upon request.
The largest new refinery loss occurred at Philadelphia and was triggered by a thinned
pipe elbow installed almost 50 years earlier; it has been reported that this was found
to contain a metallurgy permitted when it was originally installed, but not under
recommendations made 20 years later by the American Society for Testing and US$
Materials. Similar losses could occur in future if aging assets are not supported by
evolving engineering standards that are enforced by adequate regulation.
750M
Downstream margins are positively affected by drops in oil prices and this can result The size of the largest refinery
in refineries being pushed to operate at greater capacity (see figure 2), potentially loss during 2018-19, occurring in
contributing to the frequency of large losses. At the end of 2017, US refinery utilization Philadelphia and triggered by a
stood at its highest level since 2005. This high utilization has continued over the past thinned pipe elbow installed almost
two years and may have contributed to the high number of recent losses. 50 years earlier.
FIGURE
Average US refinery utilization remained elevated
2 in recent years while the price of crude oil remained
relatively low.
SOURCE: MACRO TRENDS* AND US ENERGY INFORMATION ADMINISTRATION**
94 120 Average Utilization
110
Crude Price
92
100
US Refinery Utilization (%)
90 90
Crude Price (US$)
80
88
70
86 60
50
84
40
82 30
2011 2012 2013 2014 2015 2016 2017 2018 2019
*www.macrotrends.net **https://www.eia.gov
Marsh JLT Specialty• 7Petrochemical Plants
There have been a number of high-profile losses in the petrochemical sector
in the past two years. Several of these occurred in the US, including the
US$500 million loss in Houston (November 2019), and the US$100 million
A US$800 loss in Crosby (April 2019), which, like the Philadelphia refinery loss, was
initiated by the failure of a piping component.
million loss in
There was also an US$800 million loss resulting from an explosion in Jiangsu,
Jiangsu, China, China, which is the largest petrochemical property damage loss since
was the largest Pasadena 1989. Following this, there has been a reported drive in China to
increase regulation in order to raise minimum standards at petrochemical
petrochemical sites. This includes:
property • A stipulation that local governments eliminate all hazards around
production, storage, transportation, and waste disposal.
damage loss • Tighter zoning regulations that prevent chemical plants from being built
since Pasadena near residential areas.
1989. • New rules on the transportation and disposal of hazardous materials.
The recent large losses in both petrochemical and refining underline the
challenges governments, globally, face when trying to strike the right level of
regulation within an industry: Regulation will often need to allow for the fact
that retrofitting facilities may sometimes be prohibitive in terms of cost, or
impractical due to lack of available space.
What Does Risk Ranking Data Show?
To help companies understand and improve their risk profiles and reduce the
occurrence and magnitude of losses, Marsh’s risk engineers survey key energy assets.
As part of these surveys, Marsh ranks the quality of hardware, software (management
systems), and emergency response areas at sites, each of which are made up of a
number of sub-topics.
A look back over the past 12 years of ranking data shows that certain aspects
examined in these surveys have deteriorated, which may have contributed to the
trend of recent losses.
Of note is the scores given for “engineering standards” at refineries, which have
declined over this period.
8 •100 Largest Losses in the Hydrocarbon Industry 1974-2019FIGURE US$
3 Average engineering standards at refineries declined
during 2008-19. 100M
SOURCE: MARSH
The onshore oil and gas sector has
recently experienced more property
damage losses per annum in excess
of US$100 million.
0 0.5 1 1.5 2 2.5 3 3.5 4
Poor Basic Average Good Excellent
2008-2011 2012-2015 2016-2019
Deterioration in refining engineering standards (each circle represents the average score for the
respective four-year period).
Sub Topic Best In-Class Performance
Engineering Company has its own published or adopted standards
standards used in excess of major contractor standards, and these are
regularly revised/updated. Company has representation on
international standards committees. Regular symposia held
by company.
Specific loss Company has its own process safety management system
prevention standards and work processes, which are regularly updated and
address the specific hazards of the plant. Regular symposia
held by company.
Natural perils All aspects are considered and documented, for example:
protection
• Flooding • Wind
• Rainfall/storms • Earthquake
• Electrical storms • Tidal waves
Process hazard Company has an active PHA program with a minimum scope
analysis (PHA) and frequency in line with international standards. PHA
review is embedded in change-management process.
Safety case High-quality submission that exceeds government
standards and is third-party verified.
In essence, external standards represent a minimum expectation, and the highest-
scoring sites demonstrate commitment, rather than just compliance, through the
development and application of their own standards.
For both gas processing plants and terminals/distribution, Marsh risk-ranking data
indicates there has been an overall deterioration in risk quality across all measured
areas (hardware, software, and emergency response) over the past 12 years.
Marsh JLT Specialty• 9FIGURE
4 Overall risk quality in terminals/distribution
deteriorated during 2008-19.
SOURCE: MARSH
For both gas Hardware
processing plants
and terminals/ 0 0.5 1 1.5 2 2.5 3 3.5 4
distribution, Poor Basic Average Good Excellent
Software
Marsh’s data
indicates there
has been a 0
Poor
0.5 1
Basic
1.5 2
Average
2.5 3
Good
3.5 4
Excellent
deterioration in Emergency Control
risk quality.
0 0.5 1 1.5 2 2.5 3 3.5 4
Poor Basic Average Good Excellent
2008-2011 2012-015 2016-2019
Deterioration in global risk ranking for terminals/distribution (each circle represents the average
score for the respective four-year period).
FIGURE
5 Overall risk quality in gas processing plants deteriorated
during 2008-19.
SOURCE: MARSH
Hardware
0 0.5 1 1.5 2 2.5 3 3.5 4
Poor Basic Average Good Excellent
Software
0 0.5 1 1.5 2 2.5 3 3.5 4
Poor Basic Average Good Excellent
Emergency Control
0 0.5 1 1.5 2 2.5 3 3.5 4
Poor Basic Average Good Excellent
2008-2011 2012-2015 2016-2019
Deterioration in global risk ranking for gas processing plants (each circle represents the mean score
for the respective four-year period).
10 •100 Largest Losses in the Hydrocarbon Industry 1974-2019These two categories make up a relatively small portion of the 100LL, due to their
relatively lower concentration of value than refineries/petrochemical plants. However, US$
there have still been large property damage losses in these sectors over recent years.
For example, a fire at a tank farm in the US, in March 2019, resulted in the destruction
125M
of at least 12 of the 15 tanks on-site, and property damage amounting to roughly
US$125 million.
The size of the property damage
loss resulting from a fire at a tank
Although it is not possible to accurately forecast the number and scale of future farm in the US, in March 2019 —
losses, these findings raise the question of whether we will continue to see increased resulting in the destruction of at
frequency of losses unless swift action is taken. least 12 of the 15 tanks on-site.
Lessons Learnt
The past two years have seen several major losses from refineries and petrochemical
assets, particularly those of at least 50 years in age. One contributing factor might be
the observed reduction in global “engineering standards” at refineries over the past
12 years, which, in the case of the US, has been coupled with a shift towards lighter
regulation. Reduced regulation will always disproportionally affect higher-risk sites
that simply comply with requirements, rather than the most mature sites with a strong
commitment to process safety. Another factor in the loss history might be the recent oil
price and consequent continued higher utilization of refineries.
Although not as prevalent in the 100LL, terminals/distribution and gas processing
plants have also experienced large losses. This is perhaps not surprising, given the
overall deterioration in risk quality observed over the past decade. This degradation
may also prove to be a leading indicator of increased losses in the near future.
The very best sites, with the most mature process safety cultures, have consistently
shown it is possible to run a facility without losses across the duration of their lifespan,
and across a range of external regulatory standards and oil prices. It is vital the industry
heeds the warnings, understands the lessons, and embeds the learnings contained
within the 100LL. Otherwise the worst years may not be behind us.
Marsh JLT Specialty• 11CHAPTER 2 30 Years on: Is History Repeating Itself?
30 Years on: Is History
                                            Repeating Itself?
                                            The past two years have contributed more incidents
                                            (four) to the top-20 largest losses than any other
                                            two-year window for 30 years. Not since 1988-89
                                            (when six of the largest losses occurred), has there
                                            been such a high concentration of large losses.

                                             FIGURE

                                               6                                                An unusually high number of large losses occurred in
                                                                                                1988-89 and 2018-19.
US$                                                                                             SOURCE: MARSH

2,088M
                                                                                               6
                                               Number of Losses in 20 Largest Losses

The Piper Alpha explosion in the North                                                                                                                                                          4
Sea, UK, 1988 — the largest industry
property damage loss of all time.
                                                                                                                                                                                        4

                                                                                                                   3

                                                                                                                                                     2

                                                                                                         1                   1           1                     1            1

                                                                                             1988-89   1998-99   2000-01   2004-05     2008-09     2010-11   2014-15      2016-18     2018-19

                                                                                                                                     Time Period

                                           Thirty years on, it is worth reflecting on the major contributing factors for these very
                                           large losses, and how they compare with recent events.

                                             FIGURE

                                               7
                                            Thirty years Large
                                            large losses,severe
                                                                   losses
                                                         on, it is worth
                                                          and howthan
                                                                            from 2018-19
                                                                         reflecting
                                                                           those 30
                                                                     they compare
                                                                                              were
                                                                                    on the major
                                                                                    withyears
                                                                                                     less numerous
                                                                                                 contributing
                                                                                         recentearlier.
                                                                                                events.
                                                                                                              factors for and
                                                                                                                          these very

                                                                                                SOURCE: MARSH

                                                                                                       1988-1989                                                       2018-2019
                                              Loss Value                                                          Location                       Loss Value                         Location
                                               (US$m)*                                                                                            (US$m)*
                                                      2,088                                            Piper Alpha, North Sea, UK                   800                Jiangsu, China
                                                               1,615                                   Pasadena, Texas, US                           750               Philadelphia, US
                                                                                       957             Gulf of Mexico, US                            650               Wisconsin, US
                                                                                       811             Campos Basin, Brazil                         600                Limbe, Cameroon
                                                                                       737             Nevada, US
                                                                                       708             Louisiana, US

                                           *On basis of December 31, 2019.

14 •100 Largest Losses in the Hydrocarbon Industry 1974-2019
Largest Losses in 1988-1989
It is instructive to differentiate between root causes and escalating factors, which can
be considered as the two sides of a bow-tie diagram: Root causes, if eliminated, would
have avoided the event altogether; escalating factors would have prevented the event
from growing to such magnitude.
There were
ROOT CAUSES
Systems of work
shortcomings
This includes permitting, management of change, and shift handover. There were
shortcomings in each of these three areas for the Piper Alpha incident (where there
in permitting,
was a release of condensate and subsequent explosion following the reinstatement
of a pump that had been out for maintenance, due to gaps in control of permits and
management
information transfer during handover. The incident was exacerbated by the original of change, and
platform being designed for oil rather than gas processing). There were key issues
associated with permitting for maintenance work at the Pasadena petrochemical shift handover for
plant (an accidental release of polyethylene resulting from inadequate isolation during
routine maintenance), and the Gulf of Mexico incident (release of hydrocarbon during the Piper Alpha
the installation of a pig trap on an export gas pipeline), and also with management of
change for Campos Basin (explosion during the conversion of a platform well from oil
incident.
to gas production).
Inspection
This includes internal corrosion on the FCC unit at Louisiana, resulting in a loss of
primary containment of propane, which caused a large vapor cloud explosion.
ESCAL ATING FAC TORS
Emergency response plan (ERPs)
The lack of adequate ERPs caused the initial incidents to escalate at Piper Alpha (the
platform evacuation plan relied largely on the use of a helipad, which was inaccessible
due to the smoke from the fire, and nearby multi-function support vessel struggled,
having never been tested in such extreme conditions); while at Campos Basin it took
over a month to control the resulting fire, compounding the cost of the incident.
Fire protection
At Piper Alpha the fire-water system was in manual prior to the incident, due to divers
being in the water, and this contributed to the incident. At Louisiana the refinery
immediately lost all utilities, including fire water and the four diesel fire pumps, greatly
limiting the firefighting effort for several hours. At Pasadena there was no dedicated
fire-water system, instead the process water system was relied upon, which lost
pressure following the explosion. The fire-water pumps failed when the resulting fires
damaged electrical cables and, of the three standby diesel pumps, one was under
maintenance and another ran out of fuel.
Marsh JLT Specialty• 15Largest Losses in 2018-2019
For the most recent incidents, the loss data is less readily available and in some cases
investigations are still ongoing; however, comparisons can still be drawn with the
events 30 years ago.
ROOT CAUSES
Inspection
At Philadelphia, it is thought that the rupture of a thinned pipe elbow installed around
1973 was the initiating event, which caused the major loss of primary containment,
resulting in a large fire and subsequent explosions.1 At Wisconsin it is believed that the
root cause was an FCCU spent catalyst slide valve, which was intended to be “provided
with erosion protection suitable for the design life at the design conditions,” but had
actually eroded and was unable to maintain the catalyst level required to prevent air
from mixing with hydrocarbons during transient operation.
Engineering standards
The ruptured Philadelphia pipe was reported to contain levels of copper and nickel that
US$ were permitted when it was originally installed, but not under recommendations made
800M 20 years later by the American Society for Testing and Materials (ASTM International).2
Although standards had moved on, the equipment at the plant reportedly had not.
The explosion in Jiangsu, China — the ESCAL ATING FAC TORS
largest petrochemical property Fire protection
damage loss since Pasadena 1989. The incident at Limbe began as a fire near a distillation unit on the refinery, which
escalated to a much larger explosion. More robust fixed-fire protection at site may
have reduced or prevented this escalation.
Emergency response plans
In all four incidents, the sites were not well prepared for the incidents that occurred.
Carefully considered and documented emergency plans, which are tested through
drills on a regular basis, can help to greatly reduce the eventual impact of an event
from the point at which it is initiated.
The most commonly cited risk recommendation topics by Marsh over the past few
years (see chart below), reinforce the view that the same issues are still observed today
as they were in 1988-1989.
FIGURE
8 Systems of work was the most frequently cited topic.
SOURCE: MARSH
Topics Frequency of Citation (%)
0 2 4 6 8 10 12 14 16 18
S.System of Work
Chemical Safety and Hazard
1 U.S.
Investigation Board, Fire and Explosions S. Inspection
at Philadelphia Energy Solutions Refinery H. Fireproofing
Hydrofluoric Acid Alkylation Unit.
S. Ergonomics & Operability
2 Ibid. ER. Maintenance/Testing Operability
ER. Fire Detection & Alarm/Testing Operability
ER. Fire Water System
ER. Emergency Plans
H. Engineering Standards
ER. Fixed Fire Protection
16 •100 Largest Losses in the Hydrocarbon Industry 1974-2019Barriers to Learning from Losses
Four key factors prevent lessons from being learnt from losses, and allow history to
repeat itself:
Distance
Regulation following a major incident is often enforced locally rather Siloed thinking
than globally, and consequently only, or at least mostly, affects local
awareness. At the same time, parties can be affected by closeness can cause
bias — feeling unconsciously less affected by events a long way away.
companies to
Culture imagine that
This can prevent lessons from being implemented effectively. Fear of
litigation/blame prevents open reporting of incidents and learnings an incident
within organizations, while difficulty challenging upwards in certain
cultures can prevent improvements being implemented. happening in a
Tunnel vision
different type
Some companies do not realize wider relevance of lessons. Siloed
thinking can cause companies to imagine that an incident happening
of facility does
in a different type of facility from their own does not provide not provide
applicable learnings.
applicable
Time
Lessons have been learnt, but have since been forgotten or solutions
learnings.
implemented are insufficiently robust. Given the 30 years that have
elapsed between the two-worst periods in terms of the 20-largest
losses, this would seem to be particularly significant. The lapse of
time can result in the following:
• Loss of experienced people.
• Loss of corporate memory — efficacy of safeguards put in place
following large losses eroded over time.
• Lack of understanding how risk can change with the age of
plant, including:
ɣ Creeping or subtle change that is not recognized.
ɣ Inherited problems if site changed ownership.
• Complacency — “Has worked fine for 20 years” — it can be
challenging to maintain focus in the workforce over several decades.
The industry must ensure that in 30 years’ time, we are not reflecting that the lessons
have still not been learnt. This will only be achieved with a continued focus on process
safety, and a commitment to learn from losses at all levels of an organization.
Marsh JLT Specialty• 1718 •100 Largest Losses in the Hydrocarbon Industry 1974-2019
CHAPTER 3
Does Age
Really Matter?
IAN ROBB
Global head of risk engineering,
Liberty Specialty Markets

                                   Marsh JLT Specialty• 19
Does Age Really Matter?
With plants older than 30 years far more likely to
experience losses, the industry needs to look more closely
IAN ROBB at the risks of older refineries and petrochemical plants.
Global head of risk engineering,
Liberty Specialty Markets The onshore oil and gas sector has recently experienced a rise in the number of
Ian Robb is the global head of risk property damage losses per annum in excess of US$100 million. The period 2016-2019
engineering for Liberty Specialty was particularly poor, with property damage losses well in excess of US$300 million
Markets, and based in London. occurring at refineries in North America and Europe, all of which were originally built in
He is a chartered chemical the 1960s or earlier.
engineer, responsible for global
risk engineering activities in
support of Liberty’s underwriting
and claims teams within the energy,
FIGURE
property, heavy industry, and
construction product lines. 9 The number and total cost of property damage losses
have both risen in recent years.
Property damage loss data and SOURCE: LIBERTY SPECIALTY MARKETS
trends discussed in this article have
been extracted from the Liberty
Specialty Markets oil & gas loss
3,500 8
database, which has captured and
analyzed the cause of loss for the 3,000 7
Ground-up Property Damage Loss (US$m)
onshore oil and gas sector since
6
2000. Excluding natural catastrophe 2,500
events, the database has over 700 5
2,000
losses and serves as a valuable
Count
4
source of insight that supports 1,500
Liberty’s underwriting decisions. 3
1,000
2
1
1
500
1
0 0
2000 2001 2002 2003 2004 2005 2006 2007 2008 2009 2010 2011 2012 2013 2014 2015 2016 2017 2018 2019
Year
Cost of Losses Number of Losses
In the first 10 years of a plant’s operation, most losses are caused by operations-related
failures, such as not following operating or permit-to-work procedures (see figure
10). As plant operations experience develops, the number of losses reduces, until age
takes its toll and there is a steep rise in both loss frequency and magnitude in plants
more than 30-years-old, creating a skewed “bath-tub curve.”
In older plants, mechanical-integrity-related failures account for 65% of losses. Failure
of piping becomes increasingly more prevalent as plants age. (Overall, not accounting
for age of plant, piping failure accounts for 60% of mechanical integrity losses.)
20 •100 Largest Losses in the Hydrocarbon Industry 1974-2019FIGURE
10 Plants older than 30 years see most losses, with
maintenance and inspection failures the primary cause.
SOURCE: LIBERTY SPECIALTY MARKETS
7,000 140 As plants in
MENA and Asia-
Ground-up Property Damage Loss (US$m)
6,000 120
5,000 100
Pacific age, we
may see similarly
Count Total
4,000 80
shaped ‘bath-tub
3,000 60
2,000 40
1,000 20
curves’ develop.
0 0
< 10 Years 10-20 Years 20-30 Years >30 Years
Age of Plant
Operations Maintenance & Inspection Fire & Safety Design & Construction
Count Total
The largest number of losses have occurred in North America (see figure 11) followed
by Europe, Middle East/North Africa (MENA), and Asia-Pacific (excluding China).
FIGURE
11 North America experiences the largest number
of losses, which follow a “bath-tub” curve.
SOURCE: LIBERTY SPECIALTY MARKETS
70
60
50
Number of Losses
40
30
20
10
0
< 10 Years 10-20 Years 20-30 Years >30 Years
Age of Plant
North America MENA Europe/FSU Asia-Pacific
The MENA and Asia-Pacific regions do not yet follow the traditional “bath-tub curve,”
primarily due to the younger age of their operating plants compared to Europe and
North America, which have similar shapes. As plants in the MENA and Asia-Pacific
regions age, we may see similarly shaped “bath-tub curves” develop.
Marsh JLT Specialty• 21The oil sector, principally refining (including Canadian Oil Sands), is the major industry
contributor to major losses (constituting 51% of all losses — see figure 12), with
the petrochemicals sector a distant second place (19%). This can at least partly be
attributed to the highly corrosive nature of crude feed-stocks and processes, which
presents challenges both to ensure that metallurgy is up to current standards and for
inspection departments.
The oil sector,
principally
FIGURE
refining, is the 12 Refining accounts for more than half of all losses during
2000-19.
major industry SOURCE: LIBERTY SPECIALTY MARKETS
contributor to
major losses.
9%
9% Refining
Petrochemicals
12% LOSSES BY 51% Chemicals
SEC TOR 2000 -19
Gas Processing
Terminals & Pipelines
19%
To draw any conclusions from a regional analysis, it is necessary to examine the size
of the refining fleets currently operating in those regions and their respective
age. Out of a current global operating refinery fleet of 652, there are 142 in North
America, and 137 in Europe/FSU, according to data from data provider Global Data
— so similar size fleets overall.
In terms of age distribution, it is harder to provide an exact correlation. However,
one measure to consider is the year in which each region achieved a benchmark of
50 operating refineries. For the US, this was 1930; Europe/FSU — 1955; Asia-Pacific
(excluding China) — 1976; and MENA — 1999.
There is a much higher incident rate for North America than for, say, the Asia-Pacific
region. Allowing for the difference in size of regional refinery fleets, it can be concluded
that North America has the oldest refineries globally, highest utilization rates, and
also the highest Nelson Complexity Index. These high-conversion refineries typically
process more corrosive crudes at more severe conditions and therefore operate in a
more challenging regime, often while also coupled with higher throughputs.
22 •100 Largest Losses in the Hydrocarbon Industry 1974-2019FIGURE
13 The incident rate is higher in North America than
other regions.
SOURCE: LIBERTY SPECIALTY MARKETS
In order to
Region
North America
Refinery Loss Frequency
2.82 x 10 -2
prevent losses
Europe/FSU 2.03 x 10 -2 involving aging
Middle East/North Africa
Asia-Pacific
1.89 x 10 -2
1.42 x 10 -2
plant and
equipment
In summary, in order to prevent losses involving aging plant and equipment increasing, increasing,
implementation of an effective mechanical integrity program is vital. Ensuring best
practice metallurgy to current industry standards, inspection programs designed by implementation
qualified inspectors and corrosion engineers, along with accredited qualifications of
those conducting inspections are all essential requirements. of an effective
mechanical
integrity
program is vital.
Marsh JLT Specialty• 2324 •100 Largest Losses in the Hydrocarbon Industry 1974-2019
CHAPTER 4
Organizational
Resilience: Turning
Uncertainty into
Opportunity

                      Marsh JLT Specialty• 25
Organizational Resilience:
Turning Uncertainty into
Many energy Opportunity
companies’ With plants older than 30 years far more likely
business to experience losses, the industry needs to look
more closely at the risks of older refineries and
resilience petrochemical plants.
strategies
continue to lag. The past two years have seen a high number of large property damage losses across
the energy sector. Such losses can take a long time to recover from and can even
mark the end for a site. For example, the reported US$750 million loss in June 2019,
at a refinery in Philadelphia, resulted in the refinery closing shortly afterwards and the
operator ultimately filing for bankruptcy.
Business continuity and business interruption strategies are vital to mitigating an
event’s knock-on effects, costs, and ultimate severity. Yet many energy companies’
business resilience strategies — including their investment and implementation —
continue to lag. Some companies have mature emergency response functions, and
business interruption coverage, but have no formal procedures or plans relating to
crisis management, business resilience/continuity planning, or cyber resilience.
A 2018 Marsh study explored share and stock price volatility — over a 250 trading-day,
post-incident timeline — for a sample of listed companies that experienced high-
profile incidents in the past 10 years. All the companies received significant business
and financial media coverage. The findings showed that post-crisis, some companies
can benefit from a sustained 5% increase in share performance, while others lose
on average 12% of their value. The main reason for this difference? A holistically
implemented crisis management and incident response plan.
26 •100 Largest Losses in the Hydrocarbon Industry 1974–2019
1974/2019Implementing a risk and resilience program that anticipates, prepares for, responds
to, and adapts to internal and external events, regardless of the cause, requires the
following key attributes:
• Overall management commitment to and sponsorship of the organizational
resilience program.
• Strategic involvement of internal and external stakeholders in resilience and business
Post-crisis, some
continuity, including supply-chain resilience. companies can
• Proactive identification and control of risks.
benefit from a
• Flexible and agile supply chains, with sufficient alternative arrangements built in to
support fast changes to operating structures and processes.
sustained 5%
• Proactive management of internal and external communications, including media increase in share
response planning for post-crisis situations.
performance,
• Swift control of the situation — including taking ownership of the problem and the
solution, decisiveness, and being able to admit mistakes during crisis management. while others lose
• Transparent, honest, and frequent communication with stakeholders to build on average 12%
confidence.
of their value.
• Strong alignment between emergency response, crisis management, business
continuity, IT disaster recovery, IT, and operational technology cyber
response plans.
• Continuous improvement by embedding lessons learned.
Marsh JLT Specialty• 2728 •100 Largest Losses in the Hydrocarbon Industry 1974-2019
CHAPTER 5
Graphics

            Marsh JLT Specialty• 29
FIGURE
The two largest-ever losses still date from the period 1988-89.
14 SOURCE: MARSH
2,500
2,000
Property Damage Loss (US$m, 2019 values)
1,500
1,000
500
0
1974
1976
1978
1980
1982
1984
1986
1988
1990
1992
1994
1996
1998
2000
2002
2004
2006
2008
2010
2012
2014
2016
2018
Year
FIGURE
Recent large losses occurred across the world.
15 SOURCE: MARSH
2,500
2,000
PHILADELPHIA, US VOHBURG, GERMANY
FIRE & EXPLOSION FIRE & EXPLOSION
US$750m US$495m JIANGSU, CHINA
1,500
WISCONSIN, US FIRE & EXPLOSION
FIRE & EXPLOSION US$800m
US$650m
1,000
500
0
/ 0 74
/ 0 76
/ 0 78
/ 0 80
/ 0 82
/ 0 84
/ 0 86
/ 0 88
/ 0 90
/ 0 92
/ 0 94
/ 0 96
/ 0 98
/ 0 00
/ 0 02
/ 0 04
/ 0 06
/ 0 08
/ 0 10
/ 0 12
/ 0 14
/ 0 16
18
LIMBE, CAMEROON
01 /19
01 /19
01 /19
01 /19
01 /19
01 /19
01 /19
01 /19
01 /19
01 /19
01 /19
01 /19
01 /19
01 /20
01 /20
01 /20
01 /20
01 /20
01 /20
01 /20
01 /20
01 /20
20
6/
06
6
6
6
6
6
6
6
6
6
6
6
6
6
6
6
6
6
6
6
6
6
FIRE & EXPLOSION
/
01
HOUSTON, US
US$600m
FIRE & EXPLOSION ARZEW, ALGERIA*
US$500m FIRE & EXPLOSION KOMO, PAPUA NEW GUINEA
US$400m EARTHQUAKE
*Loss value may reduce from initial estimate
US$335m
as further information becomes available.
30 •100 Largest Losses in the Hydrocarbon Industry 1974-2019FIGURE
Refining accounts for more than a third of 100LL during 1974-2019.
16 SOURCE: MARSH
5
6
Refining
Petrochemicals
24 NUMBER OF 39
INCIDENTS IN Upstream
100LL BY SECTOR Gas Processing
Terminal & Distributions
26
FIGURE
Upstream accounts for an inordinate number of very high-value losses during 1974-2019.
17 SOURCE: MARSH
1,320
3,175
Refining
14,780
VALUE OF Petrochemicals
INCIDENTS IN Upstream
13,187
100LL BY SECTOR
Gas Processing
(US$M)
Terminal & Distributions
10,702
Marsh JLT Specialty• 31FIGURE
Most 100LL occurred in North America or Europe.
18 SOURCE: MARSH
PHILADELPHIA, US
FIRE & EXPLOSION
WISCONSIN, US
US$750m
FIRE & EXPLOSION
US$650m NORTH SEA, NORWAY
COLLISION
US$967m
LOUISIANA, US
EXPLOSION, VCE
US$708m NORTH SEA, UK
FIRE & EXPLOSION
US$2,088m
TEXAS, US
FIRE & EXPLOSION
US$1,615m
TOULOUSE, FRANCE
NEVADA, US
EXPLOSION
EXPLOSION
US$779m
US$737m
GULF OF MEXICO, US
FIRE & EXPLOSION
US$957m
SKIKDA, ALGERIA
EXPLOSION
US$736m
LIMBE, CAMEROON
BAY OF CAMPECHE, MEXICO FIRE & EXPLOSION
FIRE US$600m
US$737m
GULF OF MEXICO, US CAMPOS BASIN, BRAZIL
FIRE BLOWOUT
US$685m US$811m
CAMPOS BASIN, BRAZIL
EXPLOSION
US$905m
32 •100 Largest Losses in the Hydrocarbon Industry 1974-2019REFINERIES TERMINAL & DISTRIBUTION GAS PROCESSING
PETROCHEMICALS UPSTREAM
MINA AL-AHMADI, KUWAIT
FIRE & EXPLOSION
US$766m
JIANGSU, CHINA
FIRE & EXPLOSION
ABU DHABI, UAE
US$800m
FIRE & EXPLOSION
US$1,000m+
SENDAI, JAPAN
FIRE & EXPLOSION
US$691m
VICTORIA, AUSTRALIA
EXPLOSION
US$865m
Each figure included in this chart denotes the property damage
loss, adjusted to 2019 values.
Marsh JLT Specialty• 3334 •100 Largest Losses in the Hydrocarbon Industry 1974-2019
CHAPTER 6
100 Largest Losses
Descriptions
36 Refineries
50 Petrochemicals
60 Gas Processing
64 Terminals & Distribution
68 Upstream

                              Marsh JLT Specialty• 35
Refineries
There have been a number of large refinery losses over
the past two years. Four losses were large enough to
Three quarters of qualify for the 100LL (for which the threshold is US$175
million), and several more were in excess of US$100
recent property million. This is a continuing trend since the early 2000s
damage refinery and refinery losses now make up 39% of the 100LL.
losses in excess The worldwide group of oil refineries is, with some notable exceptions, a group of aging
of US$100 million assets, and 75% of recent property damage losses in excess of US$100 million occurred
at sites built in the 1960s or earlier. Older assets have often been subject to both
occurred at sites expansion projects to increase capacity, and retrospective installation of high-value,
high-conversion assets; together these have resulted in higher concentration
built in the 1960s of value at sites.
or earlier. Refineries process crude oil and therefore have a far more dynamic and broad
feedstock range than the other asset classes. Many sites also push their crude oil
processing envelopes to maximize operating margin: Relatively low crude oil prices
Fire & Explosion in recent years have contributed to positive refining margins, in turn resulting in high
global refinery utilization.
Explosion The combination of aging assets, increased concentration of value, and diverse
feedstocks are likely to have contributed to the increasing frequency and magnitude
of losses in this sector.
Fire
Mechanical Failure FIGURE
Large refinery losses have become more frequent
19 since 2000.
Natural Catastrophe SOURCE: MARSH
1,200
1,000
800
Loss (US$m)
600
400
200
0
1974
1977
1980
1983
1986
1989
1992
1995
1998
2001
2004
2007
2010
2013
2016
2019
Year
36 •100 Largest Losses in the Hydrocarbon Industry 1974-2019ADJUSTED ACTUAL PROPERTY
PROPERTY DAMAGE DAMAGE LOSS UAE | 01/11/2017
LOSS (US$)* (US$)
1,000+ / 1,000 M M
A release of hot light hydrocarbon during the completion of a maintenance activity
resulted in a major fire. The fire occurred on a residual fluid catalytic cracking (RFCC)
unit that had recently been commissioned as part of a major expansion, doubling the
overall refinery capacity. The fire resulted in the closure of the expanded area of the
refinery while extensive rebuilding activity was delivered.
MINA AL-AHMADI, KUWAIT | 06/25/2000
766 / 412 M M
The explosion occurred when employees were attempting to isolate a leak on
a condensate line between an off-site NGL plant and the refinery gas plant.
Three crude units were damaged and two reformers were destroyed. The fire was
extinguished approximately nine hours after the initial explosion. Five people were
killed and 50 others were injured. The investigation into the loss indicated a lack of
inspection and maintenance of the condensate line, which was not owned by the
refinery. Lack of clear understanding of the ownership of the line is thought to have
delayed the isolation of the line.
PHILADELPHIA, US | 06/21/2019
750 / 750 M M
A major loss of primary containment on the hydrofluoric acid alkylation unit at the
refinery resulted in a large fire and subsequent explosions. It is thought that the rupture
of a thinned pipe elbow installed around 1973 caused the process fluid release. The
refinery closed shortly after the incident and the operator filed for bankruptcy.
NORCO, LOUISIANA, US | 05/05/1988
708 / 288 M M
Operations were normal in a 90,000 bbl/d fluid catalytic cracking (FCC) unit, when
internal corrosion caused the failure of the outside radius of an eight-inch diameter
carbon steel elbow, located 50 feet above grade in the depropanizer column overhead
piping system. An estimated 20,000lb of C3 hydrocarbons escaped through the
resulting hole, forming a large vapor cloud during the 30 seconds between failure
and ignition. Both the depropanizer column (operating at 270 psi and 130 ºF) and the
depropanizer accumulator depressurized through the opening. Ignition of the vapor
cloud was probably caused by the FCC charge heater.
The initial blast destroyed the FCC control building and toppled the 26-foot diameter
main fractionator from its 15-foot high concrete pedestal. The column separated from
its 10-foot high skirt before falling. Analysis of bolt stretching of towers in the blast path
indicated over pressures as high as 10 psi.
The refinery immediately lost all utilities, including fire water and the four diesel fire
pumps, greatly limiting the fire-fighting effort for several hours. Steam pressure
dropped abruptly due to severed lines. Twenty major line or vessel failures occurred
in the FCC and elsewhere throughout the 215,000 bbl/d refinery. Blast damage
throughout the plant was extensive, but was most severe in the FCC unit. About 5,200
property claims were received for off-site damage at distances of up to six miles. The
FCC unit was eventually demolished and a new unit was constructed.
*Based on December 31, 2019, values.
Marsh JLT Specialty• 37ADJUSTED ACTUAL PROPERTY A preliminary report stated that the failed elbow was located downstream of an
PROPERTY DAMAGE DAMAGE LOSS injection point, where ammoniated water was added to reduce depropanizer
LOSS (US$)* (US$)
condensation or fouling. The elbow was a designated inspection point in the overhead
piping system for taking ultrasonic thickness measurements during turnarounds.
These inspections had constantly shown the expected corrosion rates of 0.05 mils per
year. Measurements taken at the failed elbow and in the downstream piping after the
explosion revealed unexpected, high localized corrosion rates.
SENDAI, JAPAN | 03/11/2011
691 / 590 M M
A major explosion occurred at a 145,000 bpd refinery in the north-eastern city of
Sendai, hours after the largest earthquake in the country’s history was followed by
a tsunami. The fire at the refinery originated from an oil product shipping facility.
Workers at the refinery were being evacuated, and there was no capacity to extinguish
the fire. Fire in the storage and shipping facilities resulted in damage to a 35,500 bpd
fluid catalytic cracker (FCC) at the refinery.
WISCONSIN, US | 04/26/2018
650 / 650 M M
An explosion and subsequent fire at the refinery resulted in injuries to 36 people,
and the evacuation of a large portion of the nearby town of Superior, Wisconsin. The
incident occurred when the site fluid catalytic cracking unit (FCCU), was taken offline
for planned maintenance.
It is believed that the FCCU spent catalyst slide valve had eroded and was
unable to maintain the catalyst level required to prevent air from mixing with
hydrocarbons during the transient operation. As a result, air flowed backwards
from the regenerator into the reactor, and then into other downstream equipment
— triggering a large explosion.
The explosion blew debris across the plant and one piece punctured a nearby large
above-ground storage tank — resulting in the release of around 15,000 barrels of hot
asphalt that subsequently ignited and caused a large fire.
LIMBE, CAMEROON | 05/31/2019
600 / 600 M M
A fire and subsequent explosion near the distillation unit on the refinery resulted in the
whole site’s shutdown, which is expected to last up to 12 months.
*Based on December 31, 2019, values.
38 •100 Largest Losses in the Hydrocarbon Industry 1974-2019ADJUSTED ACTUAL PROPERTY
PROPERTY DAMAGE DAMAGE LOSS ROMEOVILLE, ILLINOIS, US | 07/23/1984
LOSS (US$)* (US$)
515 / 191 M M
Just prior to the rupture of a 55-foot-tall, 8.5-foot-diameter monoethanolamine
absorber column, a refinery operator noted a six-inch-long horizontal crack at a
circumferential weld that was leaking propane. As the operator attempted to close the
inlet valve, the crack spread to about 24 inches. The area was being evacuated and the
plant fire brigade was arriving when the column failed. Propane at 200 psig and 100ºF
propelled most of the 20 ton vessel 3,500 feet, where it struck and toppled a 138,000-
volt power transmission tower.
The weld separation occurred along a lower girth weld joint made during repairs to the
column 10 years earlier. The vessel was constructed of one-inch-thick ASTM SA 516
Gr 70 steel plates rolled and welded with full penetration submerged arc joints, but
without post-weld heat treatment.
The explosion resulted in severe fires in the unsaturated gas plant, as well as fires in the
fluid catalytic cracker (FCC) and the alkylation units. After about 30 minutes, a boiling
liquid expanding vapor explosion occurred in a large process vessel in the alkylation
unit. A piece of the vessel travelled 500 feet, shearing off pipelines before striking a
tank in the water treatment unit. Another fragment landed in a unifining unit over 600
feet away, causing a major fire.
The first explosion, believed to be from a vapor cloud, broke windows up to six
miles from the plant. The explosion also caused extensive structural damage to
refinery service buildings and disrupted all electric power at the refinery, rendering a
2,500-US-gallons-per-minute (US gpm) electric fire pump inoperable. One explosion
sheared off a hydrant barrel, resulting in reduced fire water pressure from the two
2,500-US-gpm diesel-engine-driven fire pumps, which were operating at the time.
The refinery’s blast resistant control center, approximately 400 feet northeast of the
absorber, sustained little structural damage.
An estimated 30 paid and volunteer public fire departments, together with equipment
from refineries and chemical plants within a 20 mile radius, responded promptly. Many
of the pumpers took suction from the adjoining canal and from a quarry. The pumpers
and a 12,000-US-gpm pump on a fireboat eventually provided water at pressures
sufficient for fire fighting.
*Based on December 31, 2019, values.
Marsh JLT Specialty• 39ADJUSTED ACTUAL PROPERTY
PROPERTY DAMAGE DAMAGE LOSS LA MEDE, FRANCE | 11/09/1992
LOSS (US$)* (US$)
504 / 225 M M
A vapor cloud explosion occurred in the gas plant associated with the 29,700 bbl/d
fluid catalytic cracker (FCC) unit on a 136,000 bbl/d refinery.
The initial vapor cloud explosion and several subsequent lesser explosions could be
heard in Marseilles, approximately 18 miles away. An estimated 11,000 pounds of light
hydrocarbons were involved in the initial explosion.
A gas detection system in the FCC unit sounded an alarm indicating a major gas leak.
While the unit operator was contacting the security service to warn of this situation, the
initial explosion occurred. The initial gas release is believed to have resulted from a pipe
rupture in the gas plant, which was used to recover butane and propane produced in
the FCC unit.
The explosions and subsequent fires devastated about two hectares of the refinery,
which covers about 250 hectares. The gas plant, FCC unit, and associated control
building were destroyed by the incident. Two new process units, which were
under construction and scheduled to come into operation in 1993, were seriously
damaged. Roofs were damaged in the nearby town of Chateauneuf les Martigues
and windows were broken within a radius of 3,000 feet. Some windows were
broken up to six miles away.
The refinery fire brigade and over 250 firemen from three neighboring industrial sites
and four nearby towns were used for more than six hours to bring the incident under
control. Approximately 37,000 US gallons of foam concentrate were used during the
fire-fighting effort. Some fires were intentionally left burning after the incident was
under control to allow safe depressurizing of the process units, since the flare system
was partially damaged by the explosions.
VOHBURG, GERMANY | 09/01/2018
495 / 495 M M
A hydrocarbon release occurred from a reactor vessel on a naphtha hydrotreater unit.
The vessel operated at around 25 bar and 140 degrees C. The release of hot naphtha
and hydrogen created a vapor cloud that ignited, leading to an explosion and fire. It is
understood that the explosion caused further releases from other parts of the plant,
including a nearby diesel hydrotreater, which contributed to the fire.
Eight on-site employees were injured, but there were no fatalities. Residents of a nearby
town were evacuated as a precaution. Several hundred firefighters were reportedly
deployed to control the fire.
Some refinery process units were extensively damaged as a result of the explosion
and fire, as well as multiple office and maintenance buildings within the refinery site.
Windows in a village at least 3km away were broken. The initial release of hydrocarbon
was understood to have occurred as a result of a 1.5-meter crack that opened up in the
reactor vessel. The root cause of the vessel failure is not yet fully understood.
*Based on December 31, 2019, values.
40 •100 Largest Losses in the Hydrocarbon Industry 1974-2019You can also read