11 Ageing Water Storage Infrastructure: An Emerging Global Risk - United Nations ...
←
→
Page content transcription
If your browser does not render page correctly, please read the page content below
UNU-INWEH
                                                                                  REPORT
                                                                                   SERIES

                                                                                  11

Ageing Water Storage Infrastructure: An Emerging
Global Risk
Duminda Perera, Vladimir Smakhtin, Spencer Williams, Taylor North, Allen Curry

                                w w w. i n w e h . u n u . e d u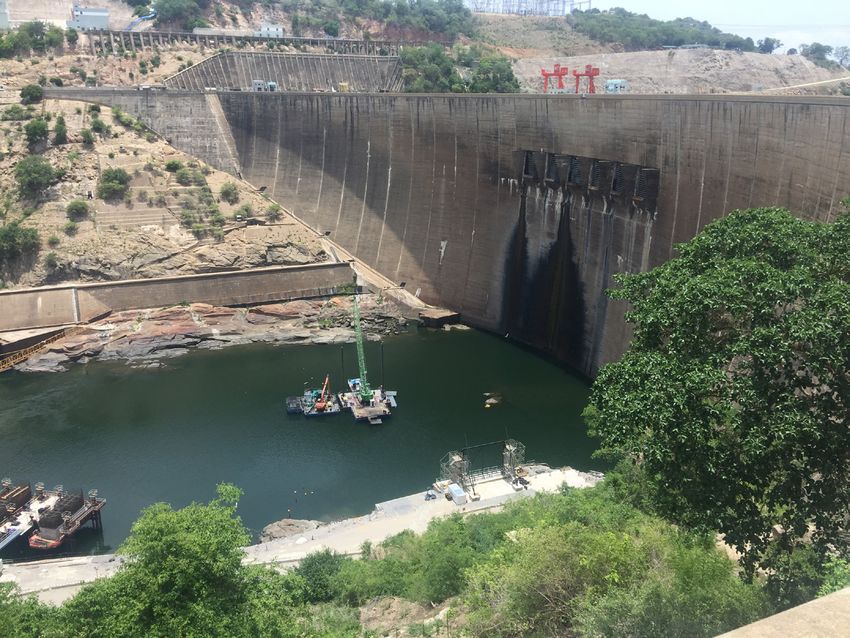
About UNU-INWEH

UNU-INWEH’s mission is to help resolve pressing water challenges
that are of concern to the United Nations, its Member States, and
their people, through critical analysis and synthesis of existing bodies
of scientific discovery; targeted research that identifies emerging
policy issues; application of on-the-ground scalable science-based
solutions to water issues; and global outreach. UNU-INWEH carries
out its work in cooperation with the network of other research
institutions, international organisations and individual scholars
throughout the world.

UNU-INWEH is an integral part of the United Nations University
(UNU) – an academic arm of the UN, which includes 13 institutes and
programmes located in 12 countries around the world, and dealing
with various issues of development. UNU-INWEH was established,
as a public service agency and a subsidiary body of the UNU, in
1996. Its operations are secured through long-term host-country and
core-funding agreements with the Government of Canada. The
Institute is located in Hamilton, Canada, and its facilities are supported
by McMaster University.

About UNU-INWEH Report Series

UNU-INWEH Reports normally address global water issues, gaps
and challenges, and range from original research on specific subject
to synthesis or critical review and analysis of a problem of global
nature and significance. Reports are published by UNU-INWEH staff,
in collaboration with partners, as / when applicable. Each report is
internally and externally peer-reviewed. UNU-INWEH Reports are an
open access publication series, available from the Institute’s web site
and in hard copies.

© United Nations University Institute for Water, Environment and
Health (UNU-INWEH), 2021

Suggested Reference: Perera, D., Smakhtin, V., Williams, S., North, T.,
Curry, A., 2021. Ageing Water Storage Infrastructure: An Emerging
Global Risk.UNU-INWEH Report Series, Issue 11. United Nations
University Institute for Water, Environment and Health, Hamilton,
Canada.
Cover image: Ben Cody, CC BY-SA 3.0, via Wikimedia Commons.
https://commons.wikimedia.org/wiki/File:Elwha_Dam_under_
deconstruction.jpg
Design: Kelsey Anderson (UNU-INWEH)
Download at: http://inweh.unu.edu/publications/
ISBN: 978-92-808-6105-1

UNU-INWEH is supported by the Government of Canada through
Global Affairs Canada.
UNU-INWEH Report Series
Issue 11

Ageing Water Storage Infrastructure: An Emerging
Global Risk

Duminda Perera
United Nations University Institute for Water, Environment and Health, Hamilton, Canada
University of Ottawa, Ottawa, ON, Canada
McMaster University, Hamilton, ON, Canada

Vladimir Smakhtin
United Nations University Institute for Water, Environment and Health, Hamilton, Canada

Spencer Williams
The Graduate Institute of International and Development Studies, Geneva, Switzerland

Taylor North
McMaster University, Hamilton, ON, Canada

Allen Curry
Canadian Rivers Institute, University of New Brunswick, NB, Canada
United Nations University Institute for Water, Environment, and Health, Hamilton, ON, Canada
CONTENTS

EXECUTIVE SUMMARY									 4

INTRODUCTION										 5

GLOBAL DATASETS ON DAM CHARACTERISTICS				                         6

GLOBAL TRENDS IN LARGE DAM CONSTRUCTION AND AGEING			              7

OVERVIEW OF DAM AGEING BY REGION AND DAM FUNCTION			 10
     Africa											10
     Asia											10
     Australia										11
     Europe										11
     North America									11
     South America									12

DAM DECOMMISSIONING: REASONS, IMPACTS, AND TRENDS 			              12
     Public safety: increasing risk							12
     Maintenance: rising expense 							14
     Sedimentation: declining effectiveness of functions				       15
     Environment: restoring or redesigning natural environments			 15
     Societal impacts of dam decommissioning						15
     Emerging trends 									16

CASE STUDIES OF DAM AGEING AND DECOMMISSIONING 			 17
      The Glines Canyon and Elwha dams, USA						  17
      The Poutès Dam, France 								18
      Mactaquac Dam, Canada								18
      Mullaperiyar Dam, India								19
      Kariba Dam, Zambia & Zimbabwe							20
      Arase Dam, Japan									21

CONCLUSIONS										22

ACKNOWLEDGEMENTS									24

REFERENCES											24
EXECUTIVE SUMMARY

The Report provides an overview of the current state of knowledge on the ageing of large dams –an
emerging global development issue as tens of thousands of existing large dams have reached or exceeded
an "alert" age threshold of 50 years, and many others will soon approach 100 years. These aged structures
incur rapidly rising maintenance needs and costs while simultaneously declining their effectiveness and
posing potential threats to human safety and the environment.

The Report analyzes large dam construction trends across major geographical regions and primary dam
functions, such as water supply, irrigation, flood control, hydropower, and recreation. Analysis of existing
global datasets indicates that despite plans in some regions and countries to build more water storage
dams, particularly for hydropower generation, there will not be another "dam revolution" to match the
scale of the high-intensity dam construction experienced in the early to middle, 20th century. At the same
time, many of the large dams constructed then are aging, and hence we are already experiencing a "mass
ageing" of water storage infrastructure.

The Report further explores the emerging practice of decommissioning ageing dams, which can be
removal or re-operation, to address issues of ensuring public safety, escalating maintenance costs, reservoir
sedimentation, and restoration of a natural river ecosystem. Decommissioning becomes the option if
economic and practical limitations prevent a dam from being upgraded or if its original use has become
obsolete. The cost of dam removal is estimated to be an order of magnitude less than that of repairing.

The Report also gives an overview of dam decommissioning's socio-economic impacts, including those on
local livelihoods, heritage, property value, recreation, and aesthetics. Notably, the nature of these impacts
varies significantly between low- and high-income countries.

The Report shows that while dam decommissioning is a relatively recent phenomenon, it is gaining
pace in the USA and Europe, where many dams are older. However, it is primarily small dams that have
been removed to date, and the decommissioning of large dams is still in its infancy, with only a few
known cases in the last decade.

A few case studies of ageing and decommissioned large dams illustrate the complexity and length of the
process that is often necessary to orchestrate the dam removal safely. Even removing a small dam requires
years (often decades), continuous expert and public involvement, and lengthy regulatory reviews. With the
mass ageing of dams well underway, it is important to develop a framework of protocols that will guide and
accelerate the process of dam removal.

Overall, the Report aims to attract global attention to the creeping issue of ageing water storage
infrastructure and stimulate international efforts to deal with this emerging water risk. This Report's
primary target audiences are governments and their partners responsible for planning and implementing
water infrastructure development and management, emphasizing adaptation to a changing
climate and sustainable development.

Keywords: dams, large dams, dam ageing, dam decommissioning, dam re-operation, dam removal, dam
failure, reservoirs, sedimentation, public safety, river restoration, water storage, water infrastructure.

4   Ageing Water Storage Infrastructure: An Emerging Global Risk
INTRODUCTION                                              dams were built) have a design life of approximately
                                                          50-100 years (Mahmood, 1987; Ho et al., 2017).
Water storage infrastructure, particularly large dams     Others suggest the service life of well-designed,
in the last 100 years, has traditionally been used to     well-constructed, and well-maintained and
regulate river flow worldwide. "Large dams" are           monitored dams can easily reach 100 years, while
defined by International Commission on Large              some dam elements (gates, motors) may need
Dams (ICOLD) as having a "height of 15 metres or          to be replaced after 30 to 50 years (Wieland and
greater from lowest foundation to crest, or a dam         Mueller, 2009). According to Wan-Wendner (2018),
between 5 metres and 15 metres impounding more            all modern dams must meet safety regulations that
than 3 million cubic metres". ICOLD's current World       typically model and examine scenarios of failure up
Register of Dams (WRD) comprises over 58,700 large        to 100 years. In this Report, and similarly to Wan-
dams that satisfy these criteria, although this list      Wendner (2018), an arbitrary age of 50 years is used
may be incomplete (ICOLD WRD, 2020). Together,            as the point when "a human-built, large concrete
these dams can store approximately between 7,000          structure such as a dam that controls water would
and 8,300 km³ (Vörösmarty et al., 2003; Chao et al.,      most probably begin to express signs of aging."
2008, Zhou et al., 2015), or approximately 16% of
all global annual river discharge, ~ 40,000 km³yr-1       These ageing signs may include increasing cases
(Hanasaki et al., 2006).                                  of dam failures, progressively increasing costs of
                                                          dam repair and maintenance, increasing reservoir
Dams exist in various designs and types that              sedimentation, and loss of a dam's functionality and
depend on several context-specific factors,               effectiveness. These manifestations are strongly
including geology, reservoir storage capacity,            interconnected. Therefore, age per se is not a
intended dam function(s), availability of materials,      decisive variable for action. Two dams constructed
and funds (USSD, 2015). The main functions of             in the same year could have very different current
dams are, in descending order of their numbers:           status and effective lifespans based on their
irrigation, hydropower, water supply, flood control,      respective parameters and contexts. Yet, age is
and recreation (ICOLD WRD, 2020). Some 30-40%             the simplest "macro" metric by which dams can be
of the world's irrigated land that contributes nearly     characterised and compared, in the context of their
40% of the world's agricultural production relies on      diminishing effectiveness, increasing risks, and
dams (WCD, 2000; Shah and Kumar, 2008). Also, the         impacts for the economy and the environment – in
water supply to most urban and industrial regions of      time. Ageing also increases the vulnerability of a
the world is ensured by large dams (Vörösmarty et         dam to changing climate (Giuliani et al., 2016; Ehsani
al., 2003). By 2050, the estimated global population      et al., 2017) due to exposure to more frequent and
will be close to 10 billion (United Nations, 2017),       extreme floods and/or increasing evaporation from
and most of it will be located downstream of water        the reservoir that can lead to accelerated loss of its
reservoirs contained by dams (Ferre et al., 2014)         function (Zhao and Gao, 2018).
that were built primarily in the 20th century.
                                                          Many large dams worldwide have reached or are
Every infrastructure has a design life; hence             approaching the lower bound (50 years) of their
infrastructure ageing is a normal process. The same       anticipated lifespan. North America and Asia
applies to water storage dams of any size. "Ageing        together hold ~ 16,000 large dams in the range
can be defined as the deterioration process that          of 50-100 years old and ~2,300 large dams over
occurs more than five years after the beginning of        100 years old (ICOLD WRD, 2020). In the USA, the
the operation phase so that deterioration occurring       average age of all the 90,580 dams (of all sizes) is
before that time is attributed to inadequacy of           56 years (ASCE, 2017), and over 85% of them are
design, construction or operation…" (Zamarrón-            reaching the end of their life expectancy in 2020
Mieza et al., 2017).                                      (Cho, 2011; Hansen et al., 2019). In China, over
                                                          30,000 dams are considered ageing (Yang et al.,
Some sources indicate that an average life                2011). In India, over 1,115 large dams will be at ~50
expectancy of a dam is 50 years (Quinn, 2000;             years mark by 2025. Over 4,250 large dams would
Mission, 2012) and that dams constructed between          pass 50-years of age, with 64 large dams being 150
1930 and 1970 (when most of the existing large            years old at 2050 (Harsha, 2019).

                                                        Ageing Water Storage Infrastructure: An Emerging Global Risk   5
Overall, dam ageing appears to be gradually                        The definition of large and medium dams in
emerging as a development issue faced by many                      GOODD is not entirely clear.
countries. Yet, it has not been comprehensively
assessed globally or accounted for in future water                 The third GDW database- Future Hydropower
storage infrastructure planning.                                   Reservoirs and Dams (FHReD) - focuses on
                                                                   hydropower generation's planned reservoirs.
                                                                   It contains some 3,700 records for, exclusively,
GLOBAL DATASETS ON DAM                                             hydropower dams with a capacity above 1 MW
CHARACTERISTICS                                                    collected from various sources, including peer-
                                                                   reviewed literature, publicly available databases,
The World Register of Dams (WRD), initiated in                     and non-governmental organizations. The database
1958 and maintained by ICOLD ever since includes                   is managed by the Eberhard Karls University
~58,700 records and is widely recognised as the                    of Tübingen, Germany (Zarfl et al., 2014). The
most comprehensive global data source on large                     database does not include dam height or storage
dams (www.icold-cigb.org). It contains details on                  capacity details, hence not directly comparable
large dams' height, length, capacity, function, and                with the first two above in the context of dam
several other dam-related facts but does not include               size. However, considering hydropower capacity
dams' coordinates. ICOLD has over 100 member                       numbers only, the database lists some 160 dams
countries and collects data through the ICOLD                      with a capacity of over 1000 MW [which may be
National Committees, but WRD also includes dams                    (arbitrary) seen as "large"]. Some 210 records with
in non-member countries (ICOLD WRD, 2020). The                     the capacity in the range between 100 and 1000
data are made available at a fee.                                  MW (which may be perceived as "medium"). Close
                                                                   to two-thirds and one-third of all records are dams
Several other global databases on dams currently                   with the capacities of 100 to 10 MW, and under 10
coexist; they differ in detail, theme, accessibility,              MW respectively. In the context of the above, at
and underlying data sources. The Global Dam                        the very least, the dams in the last category (under
Watch (GDW) platform is a useful entry point to at                 10 MW) may be seen as "small." Most of the dams
least three such databases (www.globaldamwatch.                    listed in FHReD are in the planning stage, and
org) - GRanD, GOODD, and FHReD.                                    only a few are under construction.

The Global Reservoir and Dam (GRanD) database                      These three databases together present freely
was developed to provide a geographically                          accessible georeferenced global information on
referenced database of reservoirs for the scientific               dams. The GDW platform also provides links (where
community. It has been a collaborative international               possible) or leads to almost 20 other external
effort and is presently managed by McGill University,              databases, including the global ones - ICOLD WRD
Canada. The database contains 7,320 records on                     and AQUASTAT (maintained by FAO) - and several
large dams defined as those with an excess capacity                national/regional dam databases.
of 0.1 km³. This capacity is significantly larger than
that of the ICOLD's capacity cut-off point of 3                    Many features of the above databases are
million m³ (0.003 km³), which may partially explain                overlapping. On the other hand, the categorization
the limited number of records in GRanD database                    of global dams by size differ between databases
compared to ICOLD WRD. The total water                             depending on the definition of "size" adopted.
storage capacity of dams listed in GRanD is over                   The level of detail for dam records, the sources and
 6,800 km³ (Lehner et al., 2011).                                  ways of data collection, and overall completeness
                                                                   of records vary as well. To improve the dam data
The Global Georeferenced Database of Dams                          collection and maintenance in the future, it would
(GOODD) is available through the GDW platform                      be beneficial, and in principle possible, to merge all
includes over 38,000 georeferenced entries. It                     these databases into a single online portal, adopting
is an open access data repository that contains                    one approach and thresholds for differentiating the
details on large to medium dams and hosted by                      data by dam size categories (e.g., extra-large, large,
King's College London, UK (Mulligan et al., 2009).                 medium, small). Access to such a database could

6   Ageing Water Storage Infrastructure: An Emerging Global Risk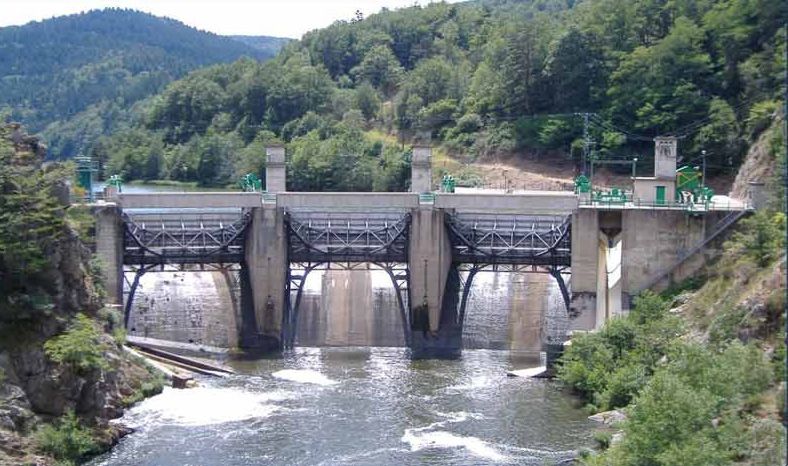
differ for different users – i.e., free or for a minimal Figure 3 further illustrates how the regional
fee – to recover database maintenance cost. construction of large dams varied over time. Of
particular interest is the decline of the North
At present, the ICOLD WRD remains the most American share and the corresponding surge
extensive data archive so far and was used in Asia in the past 50 years. The Figure also
in this synthesis. Incomplete entries in the reveals an increasing relative share in Africa
ICOLD WRD database were omitted, while the and South America, while Turkey and Eastern
entries listed with expected completion dates Europe drive the resurgence in this region; dam-
up to 2020 were included in the analyses that building in Western Europe has almost stopped,
follow as "existing" dams. with the exception of Spain.
As Figures 1-3 indicate, the construction of large
GLOBAL TRENDS IN LARGE DAM dams has changed dramatically over the decades
CONSTRUCTION AND AGEING between 1900 and 2000 both globally and
regionally. The median age of dams by country is
As shown in Figures 1 and 2, large dams' shown in Figure 4. The median age was chosen
construction surged in the mid-20th century and as the measure of central tendency to minimise
peaked in the 1960s/70s, especially in Asia, Europe, outliers' influence (for example, several large dams
and North America, while in Africa, the peak has that are over five centuries old can be found in the
occurred lately in the 1980s. The numbers of newly Czech Republic and Japan). The median age of
constructed large dams after that continuously and large dams is higher across much of Europe and
progressively declined. Most of the world's large North America, between 50 and 100 (Figure 4). The
dams are now concentrated in a few countries median age in other parts of the world is somewhat
(Table 1). China leads the list with 23,841 dams, and lower, reflecting the global dam-building boom in
the USA keeps the second position; together with the 1970s. Therefore, ageing dams have not yet
these two counties host ~56% of all large dams, posed such a pressing problem in these areas but
while the top 25 countries listed in Table 1 account can be expected to - in the near future. It is evident
for more than ~93% of the global total of large that most of the world's large dams are located
dams. Japan and the UK's average age of large in Asia. China, India, Japan, and the Republic of
dams is over 100 years, implying that the majority Korea possess 55% of all large dams recorded in
of dams in these countries were constructed before the ICOLD WRD database, and of these, a majority
and in the early 20th century. will reach the 50-year threshold in the coming years
(Figure 3). The same will happen in Africa, South
America, and Eastern Europe in the future. The
1600
1400
1200
Number of Large Dams
1000
800
600
400
200
0
1900
1905
1910
1915
1920
1925
1930
1935
1940
1945
1950
1955
1960
1965
1970
1975
1980
1985
1990
1995
2000
2005
2010
2015
2020
Year of Completion
Figure 1. Annual construction of large dams globally since 1900 (Data source: ICOLD WRD, 2020)
Ageing Water Storage Infrastructure: An Emerging Global Risk 7
trends illustrated in Figures 1 and 2 suggest that                      planning rather than the actual construction stage
while large dam construction continues in some                          takes years to plan and implement dam projects.
regions, the global dam construction rate has                           The already mentioned declining rate of large dam
dropped dramatically in the last four decades and                       construction is partly because the best locations
continues to decline.                                                   for such dams globally have been progressively
                                                                        diminishing as nearly 50% of global river volume
Considering the clear decreasing trend in large                         is already fragmented or regulated by dams (Grill
dams' construction globally from the later part                         et al., 2015). Additionally, with the strong concerns
of the 20th century till the present, it is unlikely                    regarding the environmental and social impacts
that it will be turned around in the next decades,                      of dams, and large dams in particular, as well as
regardless of some national plans to boost                              emerging ideas and practices on the alternative
hydropower production. This statement can further                       types of water storage, nature-based solutions,
be supported by the fact that only a small part of the                  and alternative types of energy production
planned dams registered in the FHReD database                           (WWAP, 2018), it may be anticipated that new
may be seen as large, that most of them are in the                      dam construction will continue only slowly in the

Figure 2. Decadal large dam construction in main geopolitical regions since 1900 (Data source: ICOLD WDR, 2020)

Figure 3. Age of large dams by main geopolitical regions (Data source: ICOLD WRD, 2020)

8    Ageing Water Storage Infrastructure: An Emerging Global Risk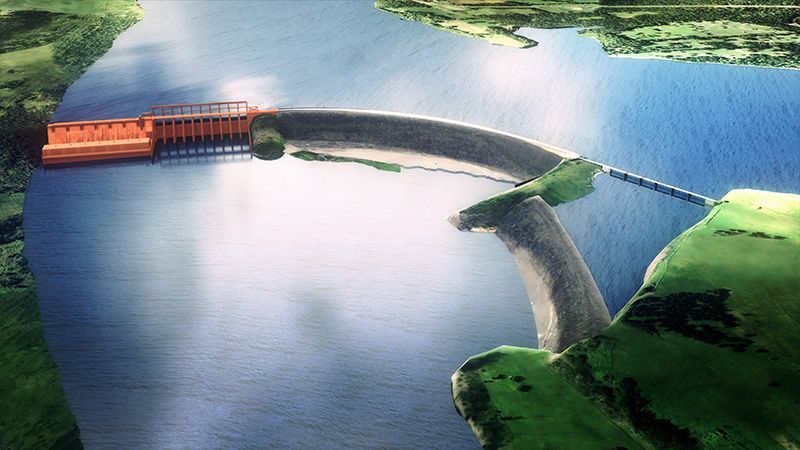
Table 1. Large dams by country1

                                                                       Average
                             Number of Large       Average                           Average Age     Median Age
                  Country                                              Capacity
                                 Dams             Height (m)                            (years)        (years)
                                                                       (10⁶ m³)
           China              23,841             26               38                46               51
           USA                9,263              21               114               65               57
           India              4,407              24               80                42               41
           Japan              3,130              33               8                 111              65
           Brazil             1,365              26               655               51               50
           South Korea        1,338              24               13                43               42
           South Africa       1,266              23               26                45               43
           Canada*            1,156              21               *                 55               51
           Mexico             1,079              30               165               61               52
           Spain              1,064              39               70                56               52
           Turkey             965                46               209               23               23
           France             720                29               24                60               53
           Iran               594                41               109               20               19
           UK                 580                23               13                106              111

           Australia          567                31               170               57               49

           Italy              541                42               27                67               65

           Germany            371                26               12                70               53

           Norway             347                30               163               56               53

           Albania            308                27               19                44               44

           Zimbabwe           256                25               36                36               31

           Romania            241                32               43                42               42

           Portugal           234                35               62                38               32

           Austria            232                34               13                44               43

           Thailand           220                25               376               35               36

           Sweden             190                26               328               63               60

         1 ICOLD WRD, 2020
         *The average dam capacity for Canada cannot be accurately estimated from ICOLD WRD.

          Figure 4. The median age of large dams by country (Data source: ICOLD WRD, 2020)

                                                                Ageing Water Storage Infrastructure: An Emerging Global Risk   9
decades to come, and that additions to total global infrastructure is still not a pressing concern. Africa
storage through such construction in the future will has far fewer large dams than other continents,
be relatively small. approximately 2000, with one-quarter of South
Africa alone (SANCOLD, 2020). Nevertheless, this
Overall, it means that we are very unlikely to witness includes several notable structures, such as the
another "dam revolution," let alone "large dam Akosombo Dam in Ghana, Kariba Dam in Zambia
revolution," which is occasionally predicted to occur and Zimbabwe, and Egypt's Aswan Dam. The
(Cole et al., 2014; Zarfl et al., 2014). At the same continent as a whole has a high and increasing
time, numerous large dams already constructed reliance on hydropower. Dam construction has
in the world will be inevitable ageing. Hence, the risen in recent years in response to a rapidly
world will have to face this new challenge, which is growing population and demand for both energy
progressively more "trending." and a secure water supply (Yildiz et al., 2016); the
Grand Ethiopian Renaissance Dam is indicative of
this trend. The majority of large dams in Africa are
OVERVIEW OF DAM AGEING BY REGION primarily for irrigation, and for all dam functions,
AND DAM FUNCTION the average age is less than 50 years (Figure 5).
Sub-sections below summarise some details and Asia
examples of dam ageing by major geographical
regions/continents of the world, with a primary As Table 1 shows, China, India, Japan, and South
aim to examine the issue of ageing in the context Korea are among the most significant number of
of dam functions. Some 33,128 of the dams in the large dams globally. China alone hosts almost 40%
ICOLD WRD have entries for function (only these of the world's large dams; (most) are approaching
records were analyzed here). In many cases, dams the 50-year age threshold. The focus remains on
serve multiple functions, as shown in Table 2. These continued construction, with projects such as the
uses are listed in the ICOLD WRD in order of priority. Three Gorges Dam on the Yangtze River. Elsewhere
For the analysis below, dams were counted based in Asia, India's current dam construction rate is
on the primary function listed. The most commonly among the world's highest (Zarfl et al., 2014). In
identified function of large dams is irrigation, contrast, Japan and South Korea have limited
followed by hydropower, water supply, and flood opportunities for future surface water storage
control, respectively. A few functional categories development. Still, in both countries, dams are
that generally have the least number of dams (fish widely used to maintain a reliable water supply
farming, navigation, etc.) have been lumped here amid highly variable seasonal flow (Kim et al.,
under the category "Other." 2016). As the two countries face the issue of ageing
water storage infrastructure, an emphasis has been
Africa placed on countering sedimentation that renders
the dams less effective (Kantoush and Sumi, 2017)
Dam building in Africa accelerated in the 1980s to extend their design life and reduce downstream
and 1990s, which means that ageing water storage impacts. Figure 5 demonstrates that large dams'
Table 2. Large dams by function (Data Source: ICOLD WRD, 2020)
Primary Function Sole Use Multiple Use Total
Irrigation 12,250 3,925 16,175
Hydropower 5,099 1,212 6,311
Water Supply 2,965 1,432 4,397
Flood Control 1,893 1,678 3,571
Recreation 835 267 1,102
Others (Fish Farming, Navigation, Tailings, etc.) 1,269 303 1,572
Total 24,311 8,817 33,128
10 Ageing Water Storage Infrastructure: An Emerging Global RiskFigure 5. Large dam numbers (bars) and average age (circles) in primary geographic regions by function (Data source: ICOLD WRD, 2020)
average age in Asia is less than 50 years in nearly Europe
all categories, except for irrigation. However,
irrigation is by far the most common function of Many large European dams are ageing, and across
large dams in Asia, suggesting that ageing water every category, the average age is near or above
storage infrastructure does indeed pose a current the 50-year threshold (Figure 5). Europe is unusual
and increasing challenge. in that dams for irrigation are on average among the
youngest, whereas in many other parts of the world,
Australia they are the oldest. The United Kingdom has most
of the older dams with an age of over 100-years,
Of the more than 650 large dams in Australia, half with an average age of 106 years. About 10% of
are over 50 years old, and more than 50 have been large European dams recorded in ICOLD WRD are
in operation for more than a century (ANCOLD, over 100 years old. In many parts of Europe, dams'
2010). Water storage infrastructure is crucial in construction has virtually ceased, primarily because
the driest inhabited continent with highly variable few waterways remain unimpeded. Notable
precipitation, and Australia consequently has the exceptions are Eastern Europe and Turkey, where
world's highest per capita surface water storage the rate of construction, particularly for hydropower
(AWA, 2010). In addition to stabilizing the water dams, is among the world's highest (Zarfl et al.,
supply, dams are crucial for irrigation and energy, 2014). There is also a growing call in Europe to
as hydropower is responsible for over 65% of remove dams and protect remaining unimpeded
Australia's electricity generation (AWA, 2010). waterways. In general, this is not motivated by a
Water supply dams- the most numerous - are public safety concern but is based on environmental
the oldest in Australia (Figure 5), together with grounds, as various groups urge the restoration of
recreational dams, which constitute only a small migratory routes for fish (ERN, 2017).
proportion of dams. Virtually all rivers in the more
heavily populated South have been dammed, North America
leading construction to slow dramatically by the
1990s (Gibbes et al., 2014). Attention has currently Canada, Mexico, and the USA are among the global
turned to the relatively untouched northern river leaders in large dam numbers (Table 1) but ageing
systems (Clarence, Richmond, and Tweed) to water storage infrastructure is most prominent in
redistribute water southward, which has been met the USA. It has >90,000 registered dams, of which
with strong resistance from Indigenous populations >9,000 are large dams. Approximately 80% of all
in the region (Rayner, 2013). dams are >50 years old as of 2020 (Bellmore et
al., 2016; ASCE, 2017). The American Society of
Civil Engineers` (ASCE) Infrastructure Report Card
Ageing Water Storage Infrastructure: An Emerging Global Risk 11has repeatedly assigned the country a "D" grade DAM DECOMMISSIONING: REASONS,
("Poor/At Risk") for the dangerous state of its dams, IMPACTS, AND TRENDS
citing the need for an estimated USD 64 billion to
adequately refurbish the nation's dams (ASCE, Dam decommissioning may include several
2017). This emerging issue was accentuated by scenarios or options, including i) retaining a dam
the Oroville dam incident in California in February but using it for a different purpose with or without
2017, where the partial collapse of a spillway forced modification [this is also often referred to as "re-
the evacuation of 200,000 people. This 50-year-old operation (USSD, 2015; Owusu et al., 2020)]"; ii)
dam, the highest in the USA at 235 m, is critical to partially removing the dam; or iii) fully removing the
California's water supply, and repairs are estimated dam (The State of Victoria, 2016; Curry et al. 2020). In
at USD 500 million (Vartabedian, 2018). The incident the context of this Report, dam decommissioning is
has been blamed on human error, specifically understood primarily as full or partial dam removal.
inadequate inspection and maintenance (IFTR, Dam re-operation may also be seen as a form of
2018). Most dams in the USA are privately owned, decommissioning in some cases, whereas dam
and this leaves owners fully responsible for the repairs and upgrades that are done to maintain
costs of upkeep (Rowland and DeGood, 2017), the same dam function or increase the safety of
leading many dams to be left abandoned due to operations are not considered: they are seen as
unmanageable costs (Michigan River Partnership, forms of regular dam maintenance. The life of a dam
2007). More than half of all the large dams in should include dam construction, the "beginning"
Canada are over 50 years old (ICOLD WRD, 2020). and dam decommissioning, the "end" as equally
The Mactaquac Hydropower dam (New Brunswick) important components of the overall process of
is the first large Canadian dam to face ageing a water storage infrastructure development (dam
and needs to address the decommissioning issue maintenance/repair/rehabilitation would be the
(Curry et al., 2020). North American dams' most "middle" life). Consequently, both construction
common function is flood control, while the oldest of a new dam and its later decommissioning must
dams, on average, are those used for hydropower. consider various positive and negative economic,
However, in nearly all functional categories, social, and environmental impacts.
large dams' average age in North America
exceeds 50 years (Figure 5). As countries worldwide start to grapple with ageing
water storage infrastructure, decommissioning
South America may be seen both as a priority and the last resort
depending on the value attributed to various
In South America, large dams have not yet faced impacts and considerations for each dam in its
the same issue of widespread ageing seen in particular situation. There are, however, at least four
other regions, although the average age in some primary and interconnected arguments in favor of
functional categories is close to 50 years (Figure decommissioning of ageing dams – public safety,
5). More than half of all large dams are found growing maintenance costs, progressing reservoir
in Brazil, although only a handful are over 50 years sedimentation, and environmental restoration.
old. South America relies heavily on hydropower,
with hydropower dams dominating over other Public safety: increasing risk
functional categories. Also, hundreds of large
dams are planned or currently under construction Dams, and large dams in particular, even if
as countries seek to satisfy growing energy structurally sound, are considered to be "high
demand (Gerlak, 2019). There is, however, strong hazard" forms of infrastructure because of the
and coordinated public opposition to the negative potential loss of human life that would be a
impacts of these dams, including environmental consequence of failure (USSD, 2015), in addition to
impacts in the Amazon Basin and displacement of triggering forced displacement and the destruction
Indigenous people (Gerlak, 2019). of livelihoods. Development downstream of dams
is persistent and thus elevates the magnitude of
the consequences of dam failure. Dam failures,
whether from excessive seepage (piping), cracking,
12 Ageing Water Storage Infrastructure: An Emerging Global Risk200
175
150
125
Number of Failures
100
75
50
25
0
1950-1954
1955-1959
1960-1964
1965-1969
1970-1974
1975-1979
1980-1984
1985-1989
1990-1994
1995-1999
2000-2004
2005-2009
2010-2014
2015-2019
Years
Figure 6. A time series of recorded dam failure accidents from 1950 to 2019.
Data sources: http://self.gutenberg.org/articles/list_of_dam_failures; https://en.wikipedia.org/wiki/Dam_failure; https://damsafety.org/Incidents
overtopping, or structural failure, are frequently seepage/internal erosion, deterioration, and
the result of poor design or construction, lack of structural instability have commonly mentioned as
maintenance, or operational mismanagement the failure mechanisms. At the same time, there
(FEMA, 2019; https://damsafety.org/dam-failures). are quite distinct differences between regions/
While Regan (2010) found that many public safety countries masked in Figure 6. For example, an
incidents occur in the first five years of a dam's analysis of recorded USA's dam failures (https://
operation, a considerable number of failures have damsafety.org/Incidents) suggests that over 75%
also occurred in dams over 50 years old (Foster et of these occurred after 50 years of age, yet most
al., 2000; Zhang et al., 2009). Older dams combined of the Chinese dam failures were found to occur
with poor maintenance represent a higher risk to during the first years of exploitation (He et al.,
public safety, particularly for downstream areas. 2008). Overall, not all dam failures can be attributed
Overall, the risks associated with large dams to ageing without more detailed data of failures
are "low probability and high consequence" across all ages and failure triggers. Regardless, the
(Bowles et al., 1999). Therefore, the challenge is commonly cited triggers of failures, i.e., structural
to reduce the probability of avoiding the potential flaws, extreme floods and overtopping, landslides,
consequences; this requires an effort to conduct risk internal erosion, and maloperation, are more
assessments for ageing dams. likely in older dams because ageing increases the
vulnerability of a dam to such triggers.
Well-documented cases of failure of dams that were
between 50 and 100 years old include Panjshir Valley Climate change considerations may accelerate a
Dam (Afghanistan, 2018), Ivanovo Dam (Bulgaria, dam's ageing process and, thus, decisions about
2012), Situ Gintung Dam (Indonesia, 2009), Kantale decommissioning. Extreme weather events,
Dam (Sri Lanka, 1986), Kelly Barnes Dam (the USA, especially floods, are expected to become more
1977) and others (Cooper and Gleeson, 2012; severe and frequent with the changing climate.
Zimmermann, 2019; USBR, 2015, Jayathilaka and Consequently, these events increase the threat
Munasinghe, 2014; Associated Press, 2018). These to aging large dams designed using historical
cases have resulted in 10 to 200 fatalities and multi- hydrological data (Payne et al., 2004; Choi et al.,
million USD economic damages. 2020). The increasing frequency and severity of such
events can overwhelm the reservoir's and dam's
Figure 6 shows the sequence of recorded dam design limits and undermine dam safety which was
failure accidents over the last 70 years, irrespective established for a different (and stationary) climatic
of the size and dam capacity. The graph situation (Fluixá Sanmartín et al., 2018).
demonstrates the increase in such accidents from
the beginning of the 21st century when many of
these dams have reached and/or exceeded the
beginning of the end of their design life. Flooding,
Ageing Water Storage Infrastructure: An Emerging Global Risk 13Figure 7. Location of dams removed in the USA in 1970-2019. Data source: www.AmericanRivers.org/Dams. Red circles – large dams (height >15 m); blue circles – medium-sized dams (height between 5 to 15 m); green circles – small dams (height 15m); blue bars – medium-sized dams (height between 5m to 15m); green bars – small dams (height
creating the risk of failure and, more disastrously,       which may alter the downstream sediment
collapse without warning (Alvi, 2018). Ownership           budgets, change river geomorphology, and bring
is an important factor for dam maintenance and             contaminants to downstream ecosystems (Warrick
particularly challenging for privately-owned dams          et al., 2015). However, when the more natural
(Ho et al., 2017). Large dams create the issue of          sediment flux along the river is reestablished,
scale, e.g., internal structural deficiencies can be       aquatic habitats and ecosystems are restored as
difficult to identify (Wieland, 2010). The costs of        well (Grant and Lewis, 2014). Dams also disrupt river
prevention through inspection and maintenance              connectivity, often creating significant negative
are, of course, immensely preferable to the costs          impacts for fishes and ecosystems (e.g., Barbarossa
of dam failure that could have been avoided. As            et al., 2020). Restoring riverine connectivity by dam
the cost of maintenance and repair escalate with           decommissioning is increasingly championed by
ageing infrastructure, these costs can be 10-30 times      science, environmental groups, and regulators
more expensive than dam removal (Headwaters                (USSD, 2015; Magilligan et al., 2017; Roy et al.,
Economics, 2016; Grabowski et al., 2018; Graham,           2018; Birnie-Gauvin et al., 2020). There is evidence
2019; Massachusetts Government, 2019).                     that river ecosystems may quickly return to pre-
                                                           dam conditions (Access Science, 2015; Foley et al.,
Sedimentation: declining effectiveness of the              2017). However, the "new" post-dam ecosystem
function                                                   will not necessarily be the same as the pre-dam
                                                           ecosystem (Bellmore et al., 2016).
Dams not only impound the water in rivers, but they
also interrupt the dynamic, downstream transport           Societal impacts of dam decommissioning
of sediment, leading it to its accumulation in
reservoirs. Sedimentation is determined mainly by          A dam removal/re-operation will have various
a dam's geography and upstream basin conditions            societal impacts, such as changes in the local
and processes. Sedimentation rates are critical for        economy. Fisheries, agriculture, tourism, and
a dam's life expectancy, and the storage capacity of       hydropower will be affected by dam removal and,
dams subsequently declines over time as sediment           in turn, impact employment opportunities and
accumulates. Some sources estimate that at current         livelihoods. Rivers are rarely dammed for the sole
reservoir sedimentation rates, the existing global         purpose of fishery creation, and in most cases,
reservoir storage capacity could be nearly halved          damming a river result in losses of riverine fisheries
by 2100 (Sumi et al., 2004). Sedimentation rates           (Jackson and Marmulla, 2001). Dam removal
vary widely according to the river basin's geologic        can increase fishery yields (Witze, 2014; Mapes,
and physical condition (Kondolf et al., 2014).             2016; Ohno, 2019) that are important for local
Consequently, some dams are "ageing" much more             populations. The agricultural sector may benefit
quickly than others due to sedimentation alone.            from or be inhibited by dam removal. For low-
Dealing with the sedimentation is a significant            income, developing nations in the global South,
component of the high dam maintenance cost, as             dams and irrigation systems can play a critical role
sedimentation can lead to the accelerated end of           in alleviating poverty; hence, dam removal could
the dam's life. Regions/countries such as China,           have detrimental consequences to local livelihoods.
Europe, USA, Nile River basin, and Japan- – to             Alternately, dam removal may turn out to be
mention a few - are experiencing significant impacts       beneficial for people who previously relied on the
and incur high costs to overcome the problem               reservoir footprint for agricultural lands such as
(Wang and Hu, 2009; Milligan, 2013; Kondolf et al.,        pastoral societies or subsistence farming (Adams,
2014; Albayrak et al., 2019; Hydro Review, 2020; ).        2000). Dam removal may stimulate the local
                                                           economy by increasing tourism (Whitelaw and
Environment: restoring or redesigning natural              MacMullan, 2002; Ohno, 2019), but reservoirs can
environments                                               also attract tourists, e.g., swimming, fishing, and
                                                           boating, which may be lost if the dam is removed.
Just as the construction of a dam has a transformative     Hydropower generation can be significantly
effect on the surrounding landscape, so does the           affected if a dam is removed. In developed
dam's removal. The primary and most direct impact          economies where access to electricity is nearly
is the release of reservoir water and sediments,           universal, removing obsolete hydropower dams

                                                         Ageing Water Storage Infrastructure: An Emerging Global Risk   15
may have a limited impact on local societies (Baish communities in decisions regarding recreation
et al., 2002; Germaine and Lespez, 2017). In contrast, post-decommissioning.
in developing economies where people lack access
to electricity for their homes and workplaces, a When considering dam removal, scientists and
hydropower dam removal may have far-reaching policymakers prioritise safety and economics
negative consequences and, thus, not be a viable while residents prioritise recreation and aesthetics
option to address ageing infrastructure. (Wyrick et al., 2009). The local community is a key
stakeholder in dam removal projects, and the
Dam removal may impact the cultural history and potential loss of aesthetics also needs consideration
heritage of a particular region. Dams that no longer even though aesthetics can be subjective and a
serve their original purpose may still hold value to polarizing topic (Jørgensen and Renöfält, 2013).
residents because of their longstanding history There is also a misconception that removing a
and ties to long-past industries, as examples from dam will negatively alter the scenery by leaving a
UK (Kotval and Mullin, 2009) or Sweden (Lejon et muddy and unsightly reservoir footprint (Sarakinos
al., 2009) suggest. To maintain the historical and and Johnson, 2002). This is true immediately after
cultural integrity of dam locations post-removal, the the dam removal and reservoir drawdown (Lejon et
dam's history may be commemorated (Goddard- al., 2009). However, this newly exposed zone can
Bowman, 2014). Conversely, dam removals may quickly evolve to increase wildlife and water quality,
provide an opportunity for a return of previously and in urban areas - the creation of green space
impacted services provided by the free-flowing, and riverfront revitalization (Baish et al., 2002).
pre-dam river, such as the renewal of sacred land
and provisioning to ceremonial observances, As can be seen from the above, the extent of dam
e.g., fish and plants for indigenous communities removal impacts may vary based on geography
(Guarino, 2013; White, 2016). and socio-economic conditions. In developed
nations where water availability is reliable, many
A common fear of dam removal in the developed ageing dams have been rendered obsolete. Their
world is its impact on property value. Some removal may be the ideal choice to manage
sources indicate that lakefront (reservoir) properties ageing infrastructure because of the cost-benefit
are more valuable on the housing market than and the positive ecological impacts of regaining
riverfront properties (Nicholls and Crompton, a free-flowing river. However, dams may be critical
2017), while others show the opposite (Provencher infrastructure for low-income countries to provide
et al., 2008). While the literature to date is scant, clean water and sanitation, irrigate crops for
there are many essential aspects of property value improved livelihoods and poverty alleviation, and
to be considered during decommissioning, such provide a reliable, clean energy source. In these
as the value of added land once the reservoir is cases, dam removal may not be a viable option.
removed, change in tax rates, and property buyout Thus, implementing one-size-fits-all criteria to
options (e.g., https://www.nbpower.com/en/about- assess and prioritise dam removal projects in
us/projects/mactaquac-project/resources/). the global context is at least useless and at most
- dangerous. Dam removal should go through
Although dams are rarely built or removed solely the same Environmental Impact Assessment and
to improve recreational activities, the latter is safeguard procedures that are required at the
highly valued by the public (Wyrick et al., 2009). stage of dam construction.
Therefore, dam removal should account for the
potential losses or gains in recreational value. Born Emerging trends
et al., (1998) found that loss of recreation was one
of the main perceived deterrents of dam removal, Dam decommissioning is not particularly new, and
and yet arguments in favor of dam removal also yet it is still a relatively recent phenomenon. The
cite an increase in recreation (see also https://www. decommissioning scale globally remains somewhat
nbpower.com/en/about-us/projects/mactaquac- uncertain, but several regional databases are
project/resources/). This dichotomy of opinion emerging that are consolidating data (www.
demonstrates the importance of engaging local AmericanRivers.org/Dams; https://damremoval.
eu/dam-removal-map-europe/).
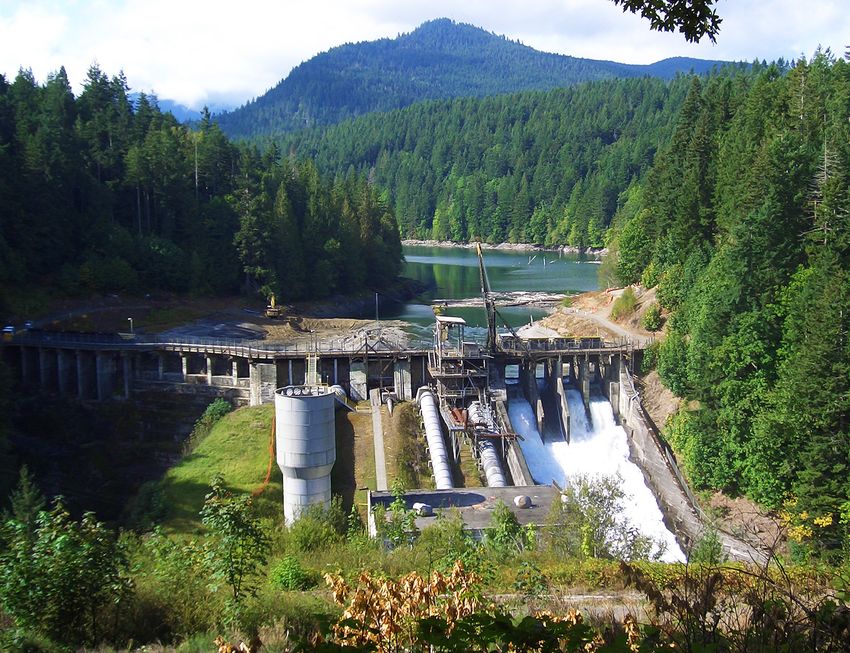
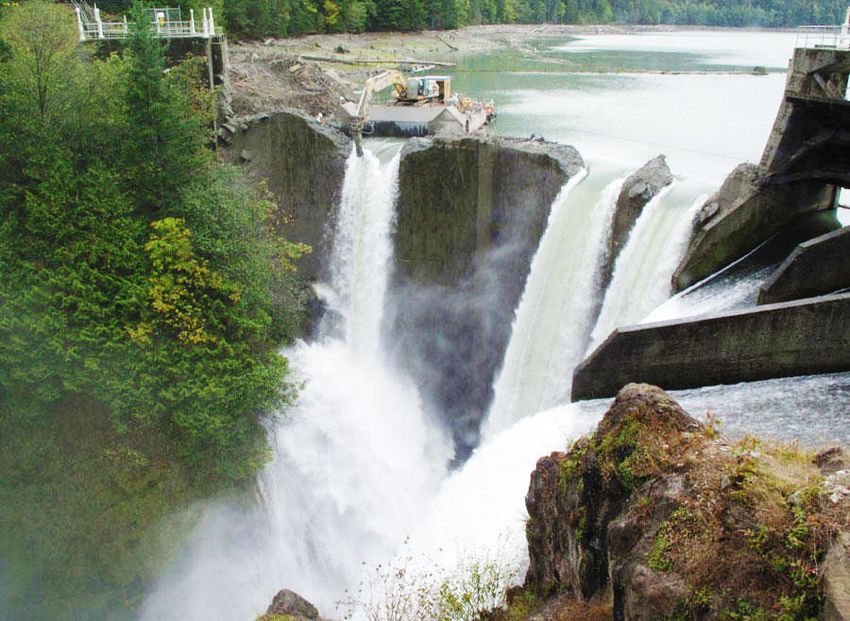
16 Ageing Water Storage Infrastructure: An Emerging Global RiskThe USA is the dam decommissioning leader with CASE STUDIES OF DAM AGEING AND some 1,275 dams removed in 21 states over the last DECOMMISSIONING 30 years, and 80 dams removed in 2017 alone. The USA database begins with records from 1912. By The decommissioning of ageing dams is becoming categorizing these records into "large" (higher than progressively more common in some regions around 15 m, as per ICOLD definition), medium (height the world. Many examples of decommissioning between 15 and 5 m), and small (height less than cases can be found, e.g., https://damremoval. 5 m) dams, the pattern of dam decommissioning eu/case-studies/ that features almost 40 case in the USA can be examined and mapped (Figure studies of dam removal in Europe; however, most 7). The height was used in this Report as the key are small dams. There are a few reports on large categorization variable because reservoir capacity dam decommissioning, either entirely removed was not always available in the USA database. All or under consideration. incomplete records (e.g., those without coordinates) were ignored, and only records from 1970 till the The Glines Canyon and Elwha dams, Elwha River, present were considered (as there were few removal Washington, USA. Age: ~ 110 years. cases before that). It can be seen from Figure 7 that only a few large dams were removed over the last In 2011, the Elwha and Glines Canyon River dams` 50 years. Most of the dams removed were small (
on the river in the early 1900s. The 64 m Glines pass downstream periodically. This work started in
Canyon Dam with a 50 million m³ capacity and 2019 and will cost approximately 10 million Euros
the slightly smaller Elwha Dam was an important (ERN, 2017; Figure 10).
electricity source for the region for much of the 20th
century. However, they provided no fish passage or Mactaquac Dam, Saint John River, New Brunswick
environmental flows to support socially significant Canada: Age ~50 years.
salmon, trout, and lamprey. Initial advocacy for
both these dams' decommissioning began in the The Mactaquac Hydroelectric Generation Stations
1980s, gaining approval in 2004, but the removal is a large dam - 55 m high, 16,282 m³ capacity, and
process itself did not commence until 2011 (Nijhuis, over 1 km long (Curry et al., 2020) with a capacity of
2014). The Glines Canyon dam removal followed 670 MW (19% of the province of New Brunswick's
a complex four-phase strategy, which allowed for total energy generating capacity). The dam and
the gradual removal of the dam using temporary station were commissioned in 1968 and had an
spillways (National Park Service, 2015; Figure 9). estimated design life of 100 years. Yet, a concrete
expansion problem has pushed forward the end
Similarly, the Elwha dam removal took place in of the service life by nearly 40 years. A decision is
phases, including the construction of temporary required for the dam's future state, and four options
cofferdams allowing water to be pumped out to have been considered: i) repowering—including
remove the fill material behind the dam (National building a new powerhouse and associated
Park Service, 2019). The removal of the Glines structure; ii) rebuilding—which would retain the
Canyon Dam was completed in 2014, marking reservoir with no power generation; iii) removal and
the ecosystem's restoration, including the river restoration (Figure 11); and iv) refurbishment
highly regarded salmon. The Elwha River case (renewal)—known as "Life Achievement," which
demonstrates the potential for positive impacts is an attempt to continue operations within the
of dam removal for both the environment and the current footprint of the dam beyond 2030.
indigenous people for whom the river plays a vital
role. However, it also illustrates the complexity and Consistent with large dam decommissioning to
lengthy process that is often necessary to secure date, the estimated cost of the dam's removal was
support and safely orchestrate the removal of such a fraction of the estimate to rebuild or refurbish
an extensive infrastructure. It is important to note the dam. An overarching science framework was
certain favorable conditions that influenced this developed to inform and support decision-making
process. The Elwha River location in a national park for the dam's review process (Curry et al., 2020).
itself contributed to its removal, and the removal The plan revolved around three pillars: i) assessing
increased tourism and recreational opportunities engineering solutions for a build or remove option,
(Headwaters Economics, 2016). To date, the Glines ii) engaging the public using multiple conversation
Canyon dam remains the largest dam removal pathways, and iii) developing a science framework
project in the world (Nijhuis, 2014). to support science solutions which will minimise
the impacts on the aquatic environment under
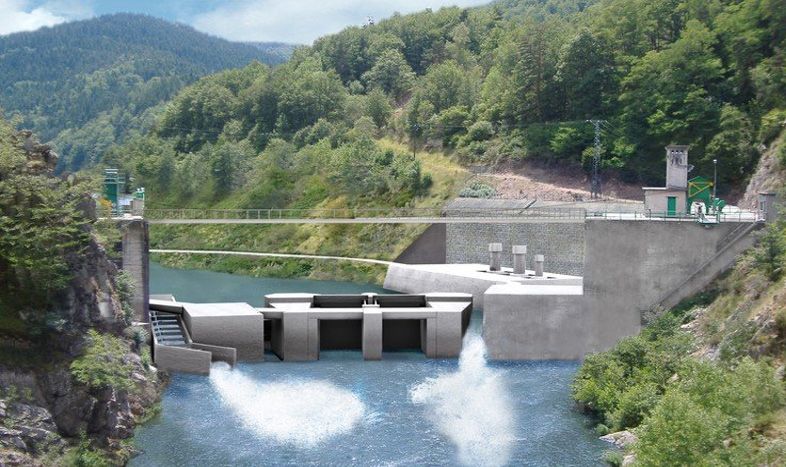
The Poutès Dam, Allier river, France. Age 78 the removal/renewal options. The framework is
years currently being implemented; hence Mactaquac
can be seen as the "living case" with a potential for
The Poutès Dam in France can be seen as a case removal eventually. The framework creates a solid
of innovative partial removal. Constructed during foundation to ensure a successful, extensive dam
World War II, the 17m-high and 2.4 million m³ dam review process and streamline a review process into
capacity has produced hydroelectricity for well over a 10-year time frame, which is significantly shorter
50 years (Xin, 2012). The removal was principally than experiences to date for comprehensive dam
motivated by a desire to protect the endangered reviews, renewals, and removals.
Atlantic salmon; no public safety concerns were
reported. Fundamental changes include lowering
the dam's height to 4 m and constructing fish-
ways to restore the salmon migration routes (Xin,
2012). Another innovation will allow sediment to
18 Ageing Water Storage Infrastructure: An Emerging Global RiskFigure 10. The Poutès dam before (2015) and after partial removal in 2021 (photomontage). Photo credit © EDF Hydro
Figure 11: The Mactaquac Hydroelectric Generating Station Dam (actual current view- top) and the options considered for its renewal/removal:
Repowering (construction of the new powerhouse and other components – bottom left); Maintaining the dam as a water control structure without
power generation – bottom middle, and Removing the dam to ensure a free-flowing river - bottom right Credit and Source: New Brunswick Power
2013; https://www.nbpower.com/en/about-us/projects/mactaquac-project/resources/
Mullaperiyar Dam, Periyar River, Kerala, India. in 1959 (Chowdhury, 2013; Thatheyus et al., 2013).
Age: 125 years At the time of construction, the dam had an
intended lifespan of 50 years (Chowdhury, 2013).
The Mullaperiyar Dam (Figure 12) is a gravity dam Still, in service over a century later, the dam shows
of 53.6 m in height and a reservoir capacity of 443 significant structural flaws and may be at risk of
million m³. It impounds the Periyaru River in Kerala failure. The dam is located in a seismically active
State, downstream to Tamil Nadu state, India. It was area. A minor earthquake caused cracks in the dam in
built in 1895 by the British government to provide 1979 (Rao, 2018), and in 2011, more cracks appeared
irrigation and eventually began to generate power
Ageing Water Storage Infrastructure: An Emerging Global Risk 19Figure 12 Mullaperiyar Dam, Periyar River. Photo credit: Mathrubhumi Media - www.mathrubhumi.com Kerala, India.
Source: https://english.mathrubhumi.com/topics/Tag/Mullaperiyar%20Dam
in the dam due to seismic activity (Thatheyus et During the construction, about 15,000 individuals
al., 2013). Leaks and leaching are also concerning, were relocated from the reservoir footprint (Scudder
as the methods and materials used during and Habarad, 1991). The dam was completed in
construction are considered outdated compared 1960 to cover the electricity demand of the Zambezi
to current building standards. In response to these river basin region (Bertoni et al., 2019). About 35%
structural issues, dam decommissioning has been of the basin's hydroelectric capacity originates at
considered. However, a conflict between Kerala the Kariba dam, making it an essential source of
and Tamil Nadu States started to grow regarding energy for the region (Bertoni et al., 2019). The total
the best way to manage this ageing infrastructure capacity of the Kariba hydropower station is 1830
(Thatheyus et al., 2013). Although the dam is located MW (World Bank, 2015). In 2015, the South African
in Kerala, it is operated by the upstream state of Institute for Risk Management identified that the
Tamil Nadu. Kerala residents are afraid of a dam Kariba dam needed urgent repairs after the dam's
collapse and argue that the reservoir level must be floodgates eroded a plunge pool at the dam's base,
lowered until the dam is fixed. very close to its foundation (Liu, 2017). Erosion can
potentially weaken the dam's foundation and could
Meanwhile, Tamil Nadu residents want to maintain lead to its collapse (Leslie, 2016).
the water levels at capacity (Rao, 2018). In 2009,
Kerala requested a new dam to be built, but Tamil Additionally, repairing the spillway was deemed
Nadu opposed the idea. Currently, the decision necessary to maintain the dam's stability (World
of how to manage the ageing Mullaperiyar Bank, 2015). A failure of the Kariba dam would be
dam is hotly debated and working through catastrophic and would also cause the collapse of
the court system. A dam failure risk would be downstream Cahora Bassa dam (Leslie, 2016). This
catastrophic: nearly 3.5 million people will be would impact over three million individuals, and
affected (Chowdhury, 2013). the population's electricity needs would no longer
be met (Leslie, 2016). In 2014, almost USD 300
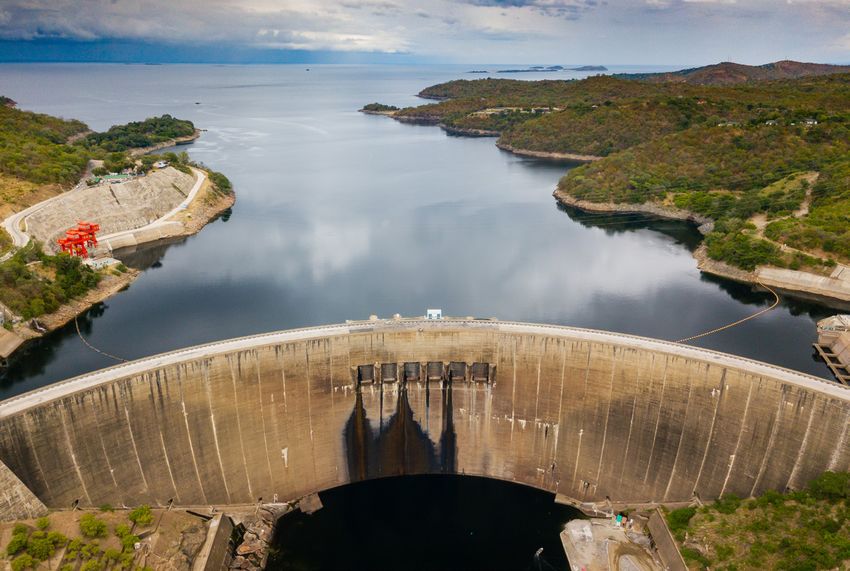
Kariba Dam, Zambezi River, Zimbabwe, and million was loaned to repair the Kariba dam (Leslie,
Zambia. Age: 60 years. 2016). Repair is expected to be completed by 2023
(World Bank, 2015). Dams like Kariba will likely
The Kariba Dam (Figure 13) is a concrete arch dam continue to operate much longer with recurring
128 m in height that impounds the Zambezi River investments into repairs despite the advanced age
between Zimbabwe and Zambia. As of 2015, it of 60 years by now, as they may be simply too large,
was the largest man-made reservoir in the world, risky, and costly to remove.
impounding 181 km³ of water (World Bank, 2015).
20 Ageing Water Storage Infrastructure: An Emerging Global RiskYou can also read