1930 4470 Welcome! We'll start shortly - TBM Council
←
→
Page content transcription
If your browser does not render page correctly, please read the page content below
Welcome!
    We’ll start shortly…

              Meantime, please take polls 1-2.
           Go to www.menti.com and use the code

                  1930 4470
                 https://www.menti.com/kbdeujat8d

                                                                          Mobile QR Code

0   © 2021 Technology Business Management Council, All rights reserved.
Polls 1-2
                             www.menti.com
                               1930 4470

TBM Metrics for Risk Management
Standards Committee Open Forum
August 2021
Polls 1-2
Introductions www.menti.com
1930 4470
Ed Hayman# Todd Tucker
TBM Architect & Sr Director, Products VP, Standards and Education
Apptio TBM Council
EHayman@Apptio.com TTucker@TBMCouncil.org
Niketa Purandare
Workgroup Program Manager
TBM Council
NPurandare@TBMCouncil.org
# Technical Advisor to the TBM Council Standards Committee
2 © 2021 Technology Business Management Council, All rights reserved.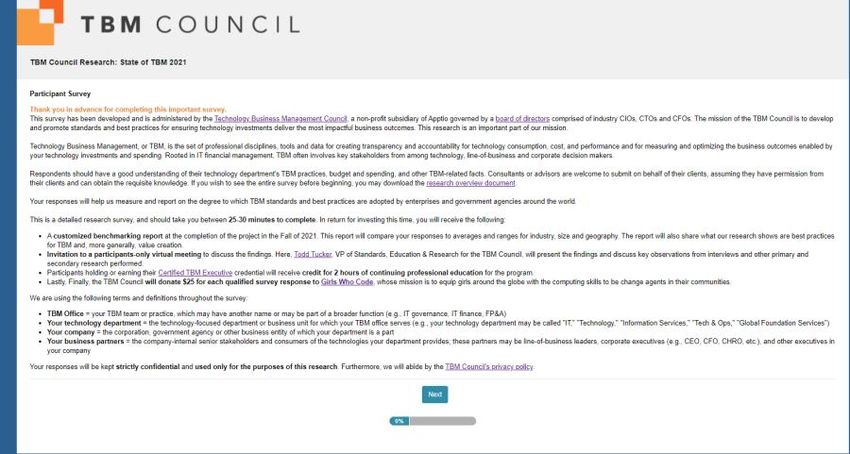
“Modified” Chatham House Rule                                                                                 Polls 1-2
                                                                                                               www.menti.com
    Applies to Kick-Off and All Workgroup Meetings                                                               1930 4470

                         Chatham House Rule                                            Our Modifications
                                                                          ▪   We will take minutes of the meeting that
       The unmodified Chatham House
                                                                              may identify individuals or their
       Rule reads as follows:                                                 companies. Distribution is limited to board
                                                                              members and management.
       When a meeting, or part thereof, is held                           ▪   If the TBM Council or our guests wish to
       under the Chatham House Rule,                                          publish anything that identifies others, they
       participants are free to use the information                           must get explicit permission from those
       received, but neither the identity nor the                             individuals.
       affiliation of the speaker(s), nor that of any
       other participant, may be revealed.

3   © 2021 Technology Business Management Council, All rights reserved.
TBMC Antitrust Guidelines                                                                                                 Polls 1-2
                                                                                                                           www.menti.com
    Applies to Kick-Off and All Workgroup Meetings                                                                           1930 4470

                                            Guidelines                           Prohibited Items of Discussion
       We’ve applied the following protocols to minimize the              ▪   Specific prices or terms or conditions of sale where the
       antitrust risks associated with the meeting or function:               seller is identified by name
                                                                          ▪   Specifically received discounts, rebates, service charges,
                                                                              or other terms and conditions of purchases and sales,
       ▪   Meetings and functions will follow a prepared agenda;
                                                                              where the seller is identified by name
           any deviations will be noted in the meeting minutes.
                                                                          ▪   Whether to do business with certain suppliers, or divide up
                                                                              sales among certain suppliers
       ▪   The TBM Council will prepare meeting minutes
                                                                          ▪   Whether to do business with any customers, or divide up
           summarizing all topics of discussion. The meeting
           minutes will reflect the names of all attendees, as well           sales among certain customers
           as the results of any votes taken.                             ▪   Whether to do business with any competitors
                                                                          ▪   The nature and composition of RFPs in the IT industry
       Please also be sensitive and mindful of antitrust                  ▪   Complaints regarding the practices of individual firms
       concerns outside of the formal meeting setting, such as
                                                                          ▪   Confidential info regarding future plans or offerings
       during social gatherings, receptions or meals.

4   © 2021 Technology Business Management Council, All rights reserved.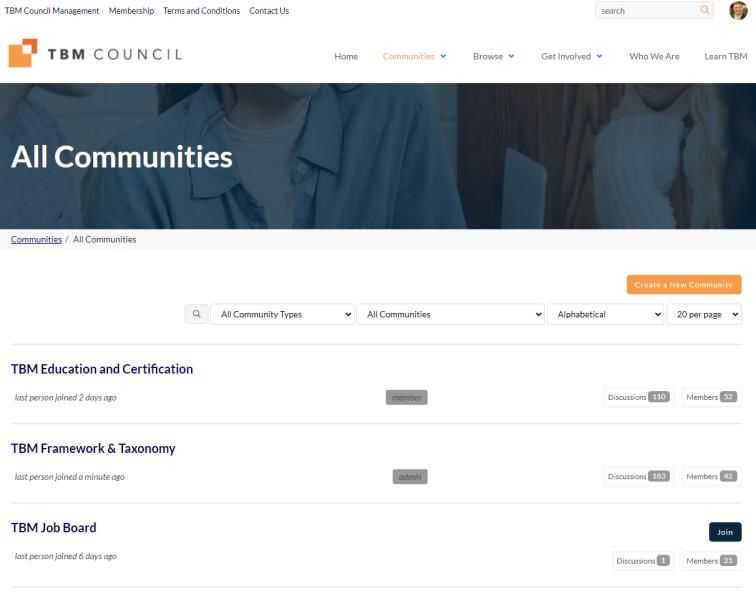
Polls 1-2
Reminder: Where to Find Content www.menti.com
1930 4470
You can find the Taxonomy
documents (PDF and PowerPoint
slides) in the “TBM Framework
& Taxonomy” community at
community.tbmcouncil.org
You must join the community and
then you can access the library.
5 © 2021 Technology Business Management Council, All rights reserved.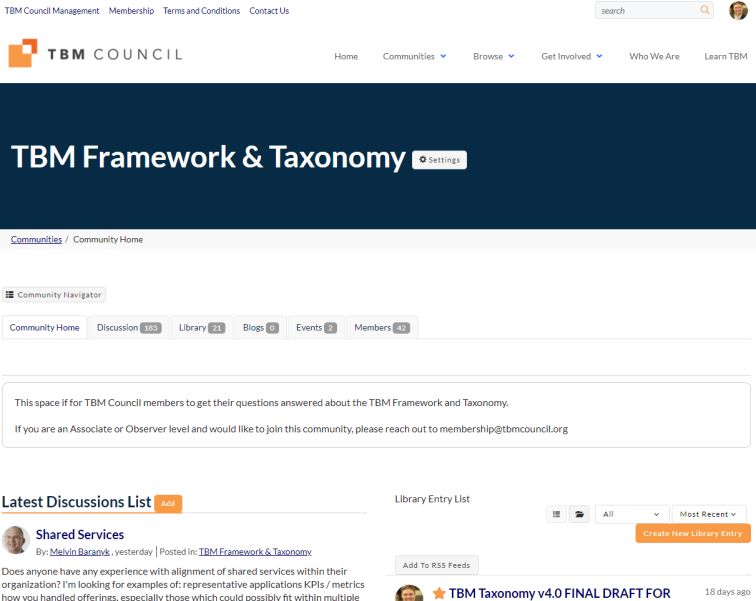
Today’s Focus Areas
Polls 1-2
www.menti.com
1930 4470
TBM Metrics for Risk
Management
Update on State of TBM
Research
6 © 2021 Technology Business Management Council, All rights reserved.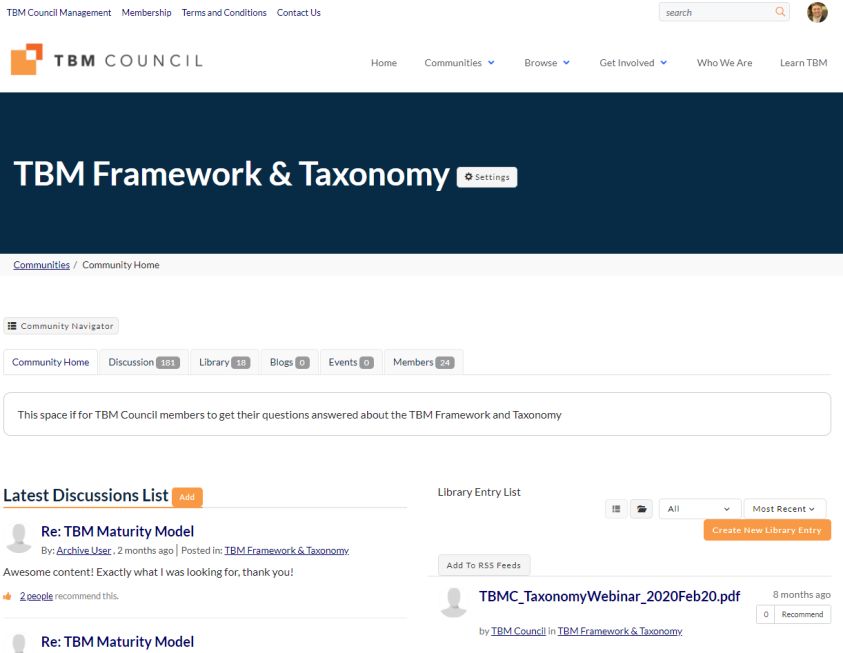
TBM Metrics for Risk
Management
Ed Hayman
Why Use TBM Metrics?
To enable performance Putting a metrics program
improvement: into action:
Set goals Set targets annually
Look at actual data Track metrics monthly
Act on results Govern quarterly
8 © 2021 Technology Business Management Council, All rights reserved.
Aligning TBM Metrics to Business Goals

                Increase Customer Satisfaction
                Drive retention
                                                                          Increase Efficiency
                                                                          Drive margins
                Increase Innovation
                Drive revenue
                                                                          Manage Risk
                                                                          Protect the brand
                Increase Speed to Market
                Drive competitive advantage

9   © 2021 Technology Business Management Council, All rights reserved.
Metrics Aligned to TBM Taxonomy
Enterprise
Revenue Growth OpEx Reduction IT Spend by Business Project Investments by External Customer Customer Retention
vs. IT Spend YoY vs. IT Spend YoY Capability Business Initiative Satisfaction vs. IT Spend YoY
(productivity) (efficiency) (alignment) (alignment) vs. IT Spend YoY
Business Architecture (Business Capability or Business Process)
IT Costs per $100k IT Costs per Business
IT Costs / Total Costs IT Availability & Security Breaches &
Revenue Transaction User Satisfaction
(EBM - IT cost contribution) Business Impact Business Impact
(Benchmark IT investment) (productivity)
Increasing Value
Solutions Projects
TCO / Investment Project
Unit Cost to Issue Avail- Project % Projects % Projects
Budget User Sat per Biz Budget
Target MTTR ability Return On Budget On Time
Variance Initiative Variance
Towers
Volumes Unit Costs Benchmarks
Cost Pools
OpEx CapEx % Variable % Discretionary
Budget Variance Budget Variance (Financial Agility) (Financial Agility)
10 © 2021 Technology Business Management Council, All rights reserved.Manage Risk
Ability to measure and mitigate myriad types of risk
including security, technology, sourcing and financial.
11 © 2021 Technology Business Management Council, All rights reserved.Manage Risk
# of security or data breaches requiring manual intervention
# of technology solutions not adhering to standards
% headcount to plan
% of assetsPolls 3-5
# of security or data breaches requiring manual intervention www.menti.com
1930 4470
Attribute Data
Description Measures the number of security breaches that required a manual intervention to remediate the
intrusion. Excludes intrusions that were identified, blocked and remediated automatically.
Primary Persona OCIO
Audience Internal
TBM Layer IT Resource Towers
Maturity 3-Best
Rationale / Actions Any security breach is a major issue and should be tracked at an individual level to identify source,
to Improve determine root cause and remediate any vulnerabilities in people, process or technology.
Calculation Single # = # of security and data breaches
Zero is the desired goal.
Data Required # of security and data breaches; intervention taken
13 © 2021 Technology Business Management Council, All rights reserved.Polls 3-5
# of technology solutions not adhering to standards www.menti.com
1930 4470
Attribute Data
Description Measures the percent of new IT solutions that use technology not on the organization's roadmap or
outside of the organization's technology strategy.
Primary Persona PMO
Audience Internal
TBM Layer Projects
Maturity 2-Better
Rationale / Actions Make sure there isn’t a proliferation of exceptions, non standards, multiple “enterprise” standards. Want
to Improve to minimize cost, complexity and risk.
Calculation = # of non-standard applications (service offerings) / total number of applications (service offerings)
0% is the desired target
Data Required Project/Initiative Data
Technology standards
Assessment of projects/primarily technology solutions meeting standards
14 © 2021 Technology Business Management Council, All rights reserved.Polls 3-5
% headcount to plan www.menti.com
1930 4470
Attribute Data
Description Measures the percent difference between the planned headcount to the actual headcount.
Primary Persona IT Finance
Audience Internal
TBM Layer Cost Pool
Maturity 1-Good
Rationale / Actions Is IT hiring staff to expected plan? If not, what are the risk to operations or new initiatives? Is the lack of
to Improve staffing driven by financial considerations or challenge finding and hiring desired candidates? If recruiting
challenges, consider best practices in recruiting such as: building a culture of recruiting; advertise
targeted job announcements via social media networks; target entry level & internship programs.
Calculation (Employees Onboard + Obligations* ) / FTE Headcount Plan
*obligations = pending job offers
100% is the desired target
Data Required » FTE headcount plan for the FY
» Number of onboard FTE
» Number of pending job offers
15 © 2021 Technology Business Management Council, All rights reserved.Polls 3-5
% of assetsPolls 3-5
% of major software licenses in audit compliance www.menti.com
1930 4470
Attribute Data
Description Measure the percent of software contracts where the number of named or actual users are within the
allowed license terms and usage.
Primary Persona Infra/App/Service Owner
Audience Internal
TBM Layer IT Resource Towers
Maturity 2-Better
Rationale / Actions Avoid paying for unused license capacity and/or unanticipated license costs and resulting budget
to Improve impacts due to audit findings.
Actions to improve include: 1. Be Clear on Contract Terms and Penalties2. Understand User License Definitions3. Maintain
Policies and Procedures for Compliant Software Usage4. Bring in Specialist Help When Required5. Keep Detailed, Accurate
Records of Software Licensing and Usage6. Establish a Single Source of Truth for Software License Compliance7. Measure
Your Real Software Discovery Coverage8. Streamline Your Sourcing Channels for Software Purchases9. Understand What
Triggers an External Software Audit10. Conduct Regular Internal Compliance Audits
Calculation # of software packages compliant with licensing terms / Total # of software packages
100% is the desired target
Data Required » Proof of ownership/right to use
» License type determination identification (e.g., enterprise, concurrent user, appliance, user, named user)
» A Software License Management (SLM) plan to monitor/maintain your org’s software licenses
17 © 2021 Technology Business Management Council, All rights reserved.
» Audit logsPolls 3-5
% of staff with required competency www.menti.com
1930 4470
Attribute Data
Description Measures the percentage of IT staff that have attained their required competency through training and
experience.
Primary Persona OCIO
Audience External
TBM Layer Cost Pool
Maturity 2-Better
Rationale / Actions Does IT have the right people with the right skills in the right roles? Without the right domain knowledge
to Improve and experience, technology operations and new programs may be at risk. Action items include: 1)
identifying needed skillsets, 2) assessing current staff capabilities, 3) providing learning and experience
opportunities, 4) hiring external resources to fill gaps.
Calculation # of employees with required competency for role / Total # of employees
Alternative: # of competencies achieved / Total # of required competencies
100% is the desired target
Data Required » Custom report from HRMS; or
» List of IT employees per department by role
» Manager assessment of IT employee competency to required skills
18 © 2021 Technology Business Management Council, All rights reserved.Polls 3-5
Amount of productivity lost to major incidents www.menti.com
1930 4470
Attribute Data
Description Measures the impact of system outages in productivity terms, specifically, the estimated business activity
hours lost for affected users. Alternatively, the hours lost can be converted to a monetary number based
on average rates.
Primary Persona Infra/App/Service Owner
Audience External
TBM Layer Apps & Services
Maturity 2-Better
Rationale / Actions Tracking and communicating lost productivity due to system downtime and unplanned outages can help
to Improve justify needed investments to non-IT decision makers and others. This is especially true for “back-office”
systems that are often deprioritized in favor of revenue and customer facing solutions.
Calculation (# of impacted users) X ($x avg hourly rate) X (productivity impact factor) = $z per hour of cost impact
0 is the desired target
Data Required » Number of impacted users
» Average hourly rate for users of the affected organization (as identified by the affected organization)
» The loss of productivity to the affected users (per the affected organization, range from 10% - 100%)
19 © 2021 Technology Business Management Council, All rights reserved.Polls 3-5
Amount of revenue lost to major incidents www.menti.com
1930 4470
Attribute Data
Description Measures the impact of system outages in monetary terms, specifically, the estimated loss in revenue for
customer or product related business capabilities.
Primary Persona Infra/App/Service Owner
Audience External
TBM Layer Apps & Services
Maturity 2-Better
Rationale / Actions Tracking and communicating the cost of downtime can help justify the cost of needed investments to
to Improve non-IT decision makers and others.
Calculation (# of hours impacted) X (# of transactions per hour when fully operational) X ($ avg per transaction)
Data Required » Duration of outage
» Number of transactions performed when fully operational
» Average value of a system transaction
20 © 2021 Technology Business Management Council, All rights reserved.Polls 3-5
% annual IT variance to plan www.menti.com
1930 4470
Attribute Data
Description Measures the percent difference between the planned annual operating budget and the actual annual
operating expenditures. A secondary metric for the capex budget variance may also be used.
Primary Persona IT Finance
Audience Internal
TBM Layer Cost Pool
Maturity 2-Better
Rationale / Actions Has IT adjusted its spend forecast through end of fiscal year to meet current approved plan? Budget
to Improve variance surprises can have an impact to quarterly and/or annual reporting. Note, a significant negative
variance (e.g. under spend) is not good since the financial resources could have been re-allocated to
other areas in the organization.
Calculation $: (Annual Budget - Actuals + Remaining Forecast)/ Annual Budget
%: (Actuals & Remaining Forecast)/Annual Budget
0% is the desired target
Data Required » Projected and actual OpEx & CapEx budget amounts
21 © 2021 Technology Business Management Council, All rights reserved.Let’s Go to Polls
Please take polls 3-5.
www.menti.com
1930 4470
https://www.menti.com/urxqv7wcuw
22 © 2021 Technology Business Management Council, All rights reserved.State of TBM 2021 Todd Tucker
State of TBM Research
Survey of TBM Leaders
Interviews of TBM Leaders, Exec
Sponsors, and Advisors
Assesses TBM Adoption, Challenges
and Benefits
▪ Transparency, Benchmarking, Billing/Showback,
Planning
▪ Agile-at-Scale Enablement (Lean Portfolio
Management)
▪ FinOps and Cloud Cost Management (including
SaaS)
Results and report published at TBM
Conference 2021
24 © 2021 Technology Business Management Council, All rights reserved.Survey Design
Modules Big Questions to Answer
Company and Gathers important context about the respondent and the respondent’s company (or client) as well
1 as important data needed for cross-tabulations (e.g., adoption by industry, geography, company
Respondent Profile size).
TBM Program Goals and Assesses the priorities, location, size, and other aspects of the respondent’s TBM office and
2 program-related success factors. Gathers data about age of the TBM office and the respondent’s
Maturity assessment of maturity (crawling, walking, running, flying).
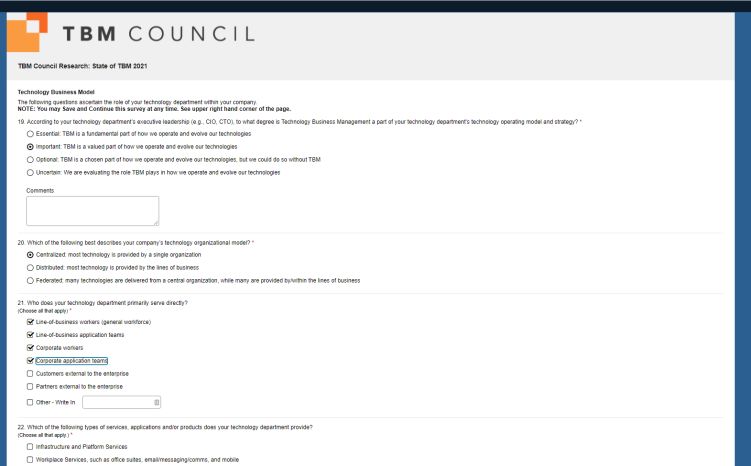
Ascertains the role of the respondent’s technology department within the company. For example,
Technology Business are they are shared service provider, a line-of-business technology department, or a product-
3
Model centric team. Gathers info about public cloud adoption and how funding levels are set.
Cost Transparency & Assesses how respondents are reporting on and creating accountability for technology
4 consumption, costs and performance. Gathers outcomes sought or achieved from TBM, regularity
Accountability of reviews, and barriers for success.
Business Demand and Seeks to understand how respondents are collaborating with their business partners on shaping
5 and assessing business demand and planning for the future. Assesses software development
Portfolio Management practices (waterfall vs. agile) and the use of agile-at-scale frameworks for planning and execution.
Business Impact and Assesses respondent’s approach for managing the impact that investments are having on
6 business outcomes. Looks at usage of value metrics (including OKRs) and impact of TBM
Value Management specifically on efficiency (cost to serve) and improvements in funding levels and other outcomes.
Future of TBM and Assesses where respondents are headed with TBM, including where they anticipate investing
7 more, less, or the same in TBM-related capabilities. Gives respondents the chance to share their
Wrap-Up perspective on the future of TBM at their organization.
25 © 2021 Technology Business Management Council, All rights reserved.Early Results from the First 50
Runners and Flyers vs. Crawlers and Walkers
Runners + Flyers (vs. Crawlers + Walkers) more likely to exhibit hallmarks such as:
▪ Have invested in TBM-specific training for their people (100% vs. 42%)
▪ Have an effective or partly effective TBM governance group in place (57% vs. 28%)
▪ Use purpose-built TBM software solutions (86% vs. 44%)
▪ Maintain an up-to-date TBM roadmap (86% vs. 40%)
▪ Have strong TBM partnership in place between Finance and Tech (IT) (71% vs. 16%)
▪ Report that TBM is an essential or important part of how they operate and evolve their technologies (100% vs. 43%)
▪ Report significant use (adoption) of the standard TBM Taxonomy (83% vs. 50%)
They’re also more likely to report benefits such as:
▪ Have accelerated or streamlined budgeting processes (83% vs. 32%)
▪ Report that funding approach results in good or adequate investment decisions for their businesses (100% vs. 48%)
▪ Report moderate to significant improvement in cost efficiency of running the business (72% vs. 28%)
▪ Report moderate to significant improvement in funding change-the-business investments (80% vs. 9%)
26 © 2021 Technology Business Management Council, All rights reserved.How To Participate
What participants receive:
▪ Custom benchmark report for all participants (delivered in November 2021)
▪ Invitation to participants-only roundtables to discuss results
▪ $25 donation to Girls Who Code on your behalf
▪ CTBMEs get 2 hours of Continuing Professional Education credit
Take the survey here: https://bit.ly/TBM-State-2021
▪ 25- to 30-minute survey for TBM and ITFM leaders
▪ Most questions are very easy and quick to answer
▪ Report delivered at TBM Conference 2021
Direct questions to Research@TBMCouncil.org
27 © 2021 Technology Business Management Council, All rights reserved.Wrap-Up
Upcoming Activities! https://bit.ly/TBM-State-2021
State of TBM 2021 Survey is ongoing…
▪ 25- to 30-minute survey for TBM and ITFM leaders
▪ Custom benchmark report for all participants
▪ Report delivered at TBM Conference 2021
TBM Conference 2021 registration is open:
▪ www.TBMConference.org
Upcoming classes:
▪ Executive Primer (2 hour, open to all | Aug 31)
▪ TBM Exec Foundation (16 hours | Sept 20-23)
▪ TBM Exec Foundation (16 hours | Sept 28- Oct 1)
Head over to the “Events” section on
tbmcouncil.org for all events and education!
29 © 2021 Technology Business Management Council, All rights reserved.Wrapping Up
Thanks for joining us today!
Please engage with us online: TBM
Framework & Framework Community
on TBMCouncil.org:
https://community.tbmcouncil.org/communities/allcommunities
NOTE: TBM Council membership required. Sign-up
at: https://community.tbmcouncil.org/membership
We will post this and past meeting deliverables there.
Community Space for Taxonomy-Related Content
(see library)
30 © 2021 Technology Business Management Council, All rights reserved.Thank You! See you in August!
You can also read


