1H 2019 Results Presentation to Investors and Analysts - Iceland Seafood
←
→
Page content transcription
If your browser does not render page correctly, please read the page content below

1H 2019 Results Presentation to Investors and Analysts

1H 2019 Results
                         Forward Looking
Presentation to
Investors and Analysts   Statements
                         Disclaimer
                         This presentation is furnished and intended for European market participants and
                         should be viewed in that manner.
                         Any potential forward looking statements contained in this presentation are
                         reflective of managements current views on future events and performance,
                         whilst the views are based on positions that management believes are
                         reasonable there is no assurances that these events and views will be
                         achieved. Forward looking views naturally involve uncertainties and risk and
                         consequently actual results may differ to the statements or views expressed.
1H 2019 Results
Presentation to
Investors and Analysts

We are
Iceland Seafood
1H 2019 Results
                         Global value added seafood producer and
Presentation to
Investors and Analysts   global sales and marketing company

                         1932                    620                 12
                         Our beginning           Employees           Businesses in 8
                         Long lasting            Market and client   countries
                         relationship            expertise           Global distribution

                         7                       +€440m              Serving over
                                                                     3000 customers
                         Value added factories   Annual revenues
                                                                     across
                         Innovation              Listed on Nasdaq
                         and client focus        First North         45 countries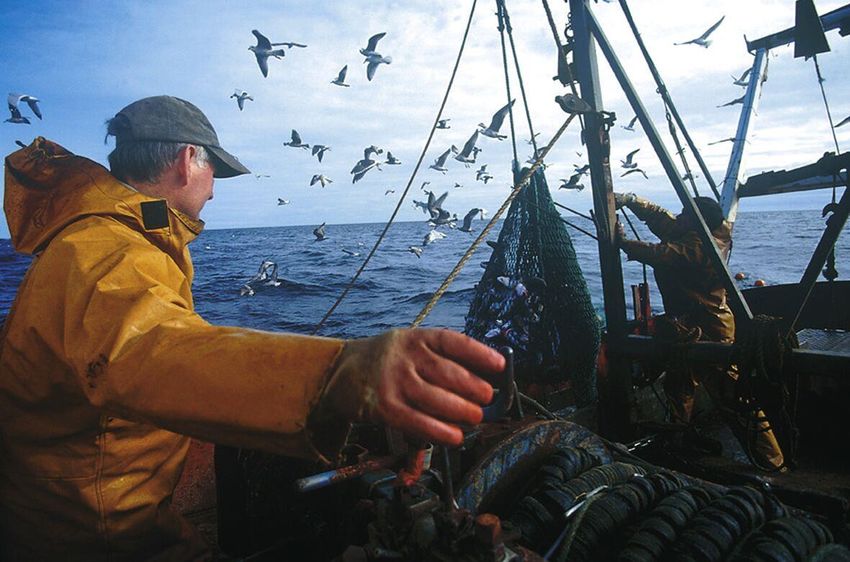
1H 2019 Results
                         Key projects to drive growth
Presentation to
Investors and Analysts   and efficiency
                           Facility extension and              Ongoing merger of                   Closer cooperation
                           automation of                       Icelandic Iberica and               with producers a key
                           production within                   IS Spain                            growth driver
                           Oceanpath
                           • Fresh fish production facility    • The decision of merging           • The benefits of integrated value
                             extended by 1,258m2,                Icelandic Iberica and IS Spain      chain, with key producers in
                             construction finalized in May       announced in February. Magnus       Iceland joining the shareholders

                           • Salmon filleting line up and        Jonsson appointed as MD for         group, have started to come
                             running from mid-July               the merged entity and new           through

                           • Total investment of €2.9m, will     management team formed            • Continuing focus on utilizing our

                             support further growth and        • Significant opportunities of        platform of 3000 customers
                             increase efficiency                 economies of scale and scope,       worldwide in cooperation with
                                                                 integration and optimization of     producers in Iceland
                                                                 functions and processes           • At the same time, continue to
                                                               • Encourages better services to       grow our substantial global
                                                                 both customers and suppliers        sourcing network
1H 2019 Results
                         Key projects to drive growth
Presentation to
Investors and Analysts   and efficiency
                                       Investment to enhance                  Main Market listing,
                                       growth and profitability               logical step for Iceland
                                       of Achernar                            Seafood

                                       • In 1H 2019, the board approved       • More efficient pricing of shares
                                         an investment project for              and increased awareness
                                         Achernar                             • Facilitates further growth, both
                                       • The new building will consist of a     organic and acquired
                                         coldstore and a new production       • Increased information sharing
                                         area                                   and discipline towards investors
                                       • Investment will increase             • Dividend policy – Pay 20-40% of
                                         production capacity by ca. 50%,        PAT annually as dividend.
                                         secure storage space, make             Targeted equity ratio of 35%,
                                         logistic more efficient and            which shall be reached within
                                         improve quality controls,              the next three years
                                       • Total investment in the range
                                         from €1.3-1.6m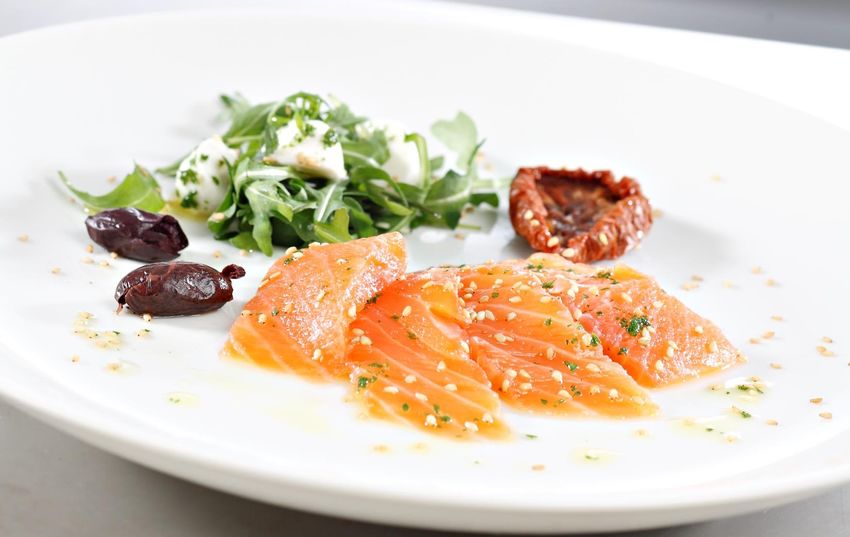
1H 2019 Results
                         Merger in Spain - Creation of
Presentation to
Investors and Analysts   South European powerhouse
                                      Will create a strong value                Significant synergy
                                      added player with great                   opportunities, in
                                      product and brand                         revenue as well as for
                                      recognition in the market                 cost
                                     • S-European market vitally important      • Estimated annual synergies of
                                       for cod products from Iceland              €3.0-3.5m, expected to
                                                                                  materialize in full before year

                                      Ongoing integration                         end 2021

                                      process                                   • To enjoy long term benefits, one

                                     • Operation in Barcelona in single           off cost will be incurred in the

                                       location as of October this year           coming periods

                                     • Part of Icelandic production in Malaga
                                       being moved to Barcelona as of June
                                       2019
                                     • Merged legal entity operating from
                                       January 1st 2020
1H 2019 Results
                                                                              New shares to be offered in
      Presentation to
      Investors and Analysts                                                  relation to main market listing
                                                                             Main market listing in early Q4                         Public offering of new shares
                                                                             2019

                                                                             • As previously announced, the Company is working       • As approved at the Company‘s Annual General
                                                                                 towards a listing on Nasdaq Iceland                   meeting in June this year, 225,000,000 new shares
                                                                             • Preparations are ongoing and the listing, along         will be issued and sold by Iceland Seafood in a
                                                                                 with a public offering of new shares, is expected     public offering managed by Kvika banki hf.    1)

                                                                                 in early Q4 2019                                    • Subscriptions will be offered in two order books,
                                                                                                                                       which differ in terms of size of subscription,
                                                                                                                                       pricing and rules of allocation
                                                                                                                                     • The purpose of the offering is to further
                                                                                                                                       strengthen the Issuer's financial position, facilitate
                                                                                                                                       increased liquidity of the shares, create a more
                                                                                                                                       diverse shareholder base and support continuing
                                                                                                                                       growth

1)   Equivalent to 9.63% of Iceland Seafood‘s share capital pre dilution and 8.78% post dilution
1H 2019 Results
Presentation to
Investors and Analysts

Financial                  Of Divisions
                         At Group level
performance              Balance sheet
1H 2019 Results
                                      Profitability driven
Presentation to
Investors and Analysts                by value added activities

                                                                              Corporate Structure                           Turnover     Profit Before Tax
Value Added Divisions                 • Good cooperation and service to
                                        producers in Iceland is vitally
• Following acquisitions last year,
                                        important for the Group’s                                                             2013             2013
  two value added activities are                                                             Iceland Seafood
                                        success
  reported in two divisions
• The decision to merge Icelandic     Strong combination                                                                    71%
                                                                                                                                   29%
                                                                                                                                             74%         26%

  Iberica and Iceland Seafood         • Strong ties to the source is key to
  Spain will form a strong                                                                        Va l u e       Va l u e
                                        our position in selling food                             Ad d e d       Ad d e d
                                                                                Sales &
  organization in the important         protein to the market                 Distribution      Northern       Southern
                                                                                                 E urope        E urope
  Southern Europe market              • Understanding of the market                                                           2018             2018
• The two Value Added divisions         demand and behavior is vital to                                                     Proforma         Proforma
  generate over 90% of total            maximise sourcing power                                                                                9%
                                                                                                               IS Spain
  divisional PBT                                                              IS Iceland
                                      • Having strong sourcing and                                  IS
                                                                                               Barra c lough   Icelandic    39%
Sales & Distribution                    processing capabilities and being      IS France
                                                                                                                 Ibérica
                                        close to the market is a key                           Oceanpath                          61%              91%
• Approximately 60% of the Group                                              IS Germany
                                        attribute towards profitability                          Havelok       Ec o m s a
  sales are generated by products
                                                                                IS USA
  sourced from Iceland, the                                                                                    Achernar
                                                                                                                              Sales &         Value Added
  backbone of the Group
                                                                                                                              Distribution
1H 2019 Results
Good results enhanced by > VA S-Europe
> VA N-Europe
Presentation to
Investors and Analysts strong sales growth > Sales & Distribution
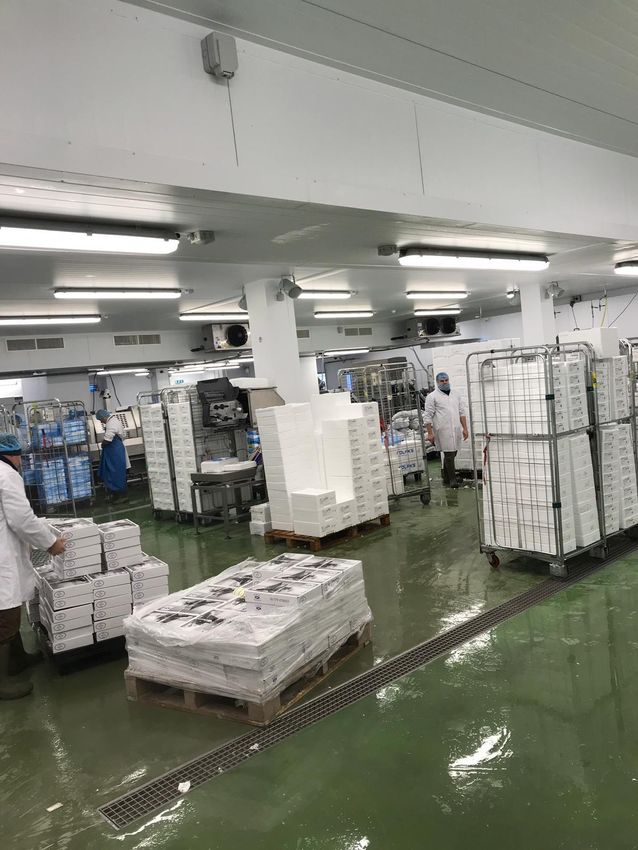
€ m´s 1H 2019 1H 2018 1H 2018P Division incorporates Normalised PBT €3m
Sales 96.8 33.9 90.5 three manufacturing up from prior year, up
sites in Barcelona, €1m on proforma 2018
Net margin 10.8 3.3 10.5
Malaga and Argentina • Sales increase a key driver
Normalised EBITDA 4.9 1.0 3.9
• Cost reduction related to the
Normalised PBT* 3.8 0.8 2.8
Servicing the merger in Spain starting to pay off
* Normalised PBT represents Profits before tax before allowing for significant items
and discontinued operations
foodservice and retail • Outlook for weaker 2H of the year,
markets in Southern impacted by lower profits of
Europe Achernar and reduced volume of
wet salted products.
Sales increased by 7%
from prior year Proforma Key projects for 2H
2019
• Strong demand for light salted
products in S-Europe • Merged legal entity operating from
year beginning 2020
• Squid sales from Argentina, a new
project delivering sales of €2.1m in • Investment in coldstore and
1H 2019 production facility at Achernar,
total investment of €1.3-1.6m.1H 2019 Results
Challenging start of the year, > VA S-Europe
> VA N-Europe
Presentation to
Investors and Analysts encouraging outlook for 2H 2019 > Sales & Distribution
€ m´s 1H 2019 1H 2018 1H 2018P Division incorporates External challenges
50.1 manufacturing sites in impacting profits in
Sales 48.3 44.1
Grimsby, Bradford and the period
Net margin 5.4 4.8 6.2
two in Dublin • Fluctuations and higher
Normalised EBITDA 2.6 2.7 3.4 stockholding due to the ongoing
Normalised PBT* 1.6 1.9 2.5 uncertainty around Brexit
Servicing the retail
• High raw material prices
* Normalised PBT represents Profits before tax before allowing for significant items
and discontinued operations.
and foodservice
• UK retail trending towards
markets in the UK and
packed at source
Ireland
Outlook for improved
2H 2019
Sales 4% down on
• Salmon prices stabilizing and
prior year proforma,
currently at lower levels than
Normalised PBT down
same time last year. Benefits
€0.9m
from new investment in Ireland
• Sales in Ireland in line with
• New listings with key retailers
previous year, but at lower
and cost reduction actions in UK
margins
starting to pay off1H 2019 Results
Strong profit growth driven by > VA S-Europe
> VA N-Europe
Presentation to
Investors and Analysts close cooperation with producers > Sales & Distribution
€ m´s 1H 2019 1H 2018 1H 2018P The Sales & Distribution Normalised PBT of €1.0m
Sales 102.3 92.3 92.3 division incorporates doubling from prior year
Net margin 4.2 3.6 3.6
subsidiaries in Iceland, • Increased sales from Iceland a key
France, Germany and driver for improved profitability
Normalised EBITDA 1.3 0.7 0.7
the USA • Operating cost reducing by €0.1m
Normalised PBT* 1.0 0.5 0.5
helped by cost savings in Iceland and
* Normalised PBT represents Profits before tax before allowing for significant items
and discontinued operations
Division sells to over slight weakening of ISK
45 countries
Continued growth
expected in the second
Over 10% increase in
half of the year
sales from previous year
• Mackerel season starting well
• Significant increase in sales from
• Increased cod quotas
Iceland, driven by 70% increase in
• Q4 an important sales period for fresh
volume of frozen-at-sea products
products in France and Germany
• Mackerel from 2018 season sold
• Continued focus on closer cooperation
early 2019 which offsets the impact
with producers in Iceland
of no capelin season this yearSolid performance with
1H 2019 Results
Normalised PBT increasing Iceland Seafood
Presentation to
Investors and Analysts by 20% from 2018 Proforma Group
€ m´s 1H 2019 1H 2018 1H 2018P Sales up €18m from Net Profit of €2.9m
Sales 232.1 150.0 213.8 2018 Proforma driven impacted by one off
Net margin 20.5 11.7 20.2
by: cost of €1.3m, which
• Strong sales in S-Europe mainly consist of:
Normalised EBITDA 8.3 3.6 7.2
especially of light salted products • Changes in key management of
Normalised PBT* 5.5 2.2 4.6 the Group and in Spain
• Significant sales growth within
Net Profit 2.9 1.3 3.2 S&D, especially from frozen-at- • Cost of merging process in Spain
*Normalised PBT represents Profit before tax before allowing for significant items sea • Operational restructuring within
and discontinued operations.
**Proforma numbers based on 12mth operation of the acquired subsidiaries and VA-N Europe, reacting to external
include finance cost in HO related to the acquisitions.
Normalised PBT challenges.
growing by 20% from
2018 Proforma
• Significant sales growth a key
profit driver
• Positive impact from actions in all
divisions to drive efficiency and
reduce cost1H 2019 Results
Strong financial position and
Presentation to
Investors and Analysts good liquidity
€ m´s 30.6.2019 31.12.2018 Variance € m´s 30.6.2019 31.12.2018 Variance
Fixed assets 16.5 14.4 2.0 Total Equity 62.4 59.3 3.1
Leased assets 3.3 - 3.3 Thereof minority interest 3.2 2.9 0.3
Intangible assets 44.6 44.7 (0.1) Long term borrowings 9.7 6.6 3.1
Deferred tax/other 3.1 2.7 0.4 Lease liabilities 3.8 - 3.8
Non Current Assets 67.5 61.8 5.7 Obligations 2.1 1.7 0.4
Inventory 62.4 62.1 0.3 Non Current Liabilities 15.6 8.4 7.2
Trade and other receivables 61.1 62.4 (1.3) Short term borrowings 79.9 75.8 4.1
Other assets 3.5 3.5 (0.1) Trade and other payables 40.2 44.9 (4.7)
Bank deposits and cash 9.5 4.0 5.5 Other current liabilities 5.9 5.4 0.5
Current Assets 136.5 132.0 4.5 Current liabilities 126.0 126.1 (0.1)
Total Assets 204.0 193.8 10.2 Total Equity and Liabilities 204.0 193.8 10.2
Total assets of €204m Net debt amounts to New long term loans in Equity ratio of 30.6% at Group funding
up €10.2m from year end €80.2m compared to Spain, to secure long end of the period, headroom in excess of
2018, partly explained by €78.5m at end of 2018. term funding of the negative impact due to €28m at end of June
implementation of IFRS Increase driven by business and support IFRS 16 of 70bps 2019
16, Lease accounting seasonally higher NWC investments
position1H 2019 Results Presentation to Investors and Analysts Outlook
1H 2019 Results
                                                Growing
Presentation to
Investors and Analysts                          with global trends

                                        20,8%      2015            2020      2030          2050
                                                                                                                   2015                    2030
                                                   39%             41%       44%           46%
                              14,5%                                                                           41%
                                                                                                             7,4 bn                   64%
                                                                                                                                     8,5 bn
                6,2%   7,3%
   5,8%

                                                                                                                     Mi d d le c l a s s    Re s t
                                                          Age       +50   15-50     0-14
   Beef        Lamb    Pork   Chicken   Fish

Drive towards                                   Older western                                     Growing                                            Need for food
healthy living                                  population                                        Middle class                                       solutions
Increasing seafood consumption                  Increasing seafood consumption                    Increasing seafood consumption                     Increasing seafood consumption
Source: Seafish.org                             Source: Eruostat                                  Source: Brookings.edu
1H 2019 Results
Continuing strong growth –
Presentation to
Investors and Analysts organic and acquisitive
Outlook for 2019 Uncertainty Focus and growth Full year 2019 Normalised
PBT* (m´s)
• Seafood demand in major markets • Group’s results are influenced by • Iceland Seafood’s priority in the
11.8
expected to remain strong fishing and quota changes coming periods is to integrate 11.0
10.8
• Significant upward price movement • Changes in underlying global our new companies into the
in some key species and markets economic conditions, currency Group to maximise strategic
• Global cod supply has reduced rates, import duty rates, opportunities as well as driving
whilst Iceland’s quota has competition and consumer organic growth
7.4
increased behaviors all generate • The Group remains on the
• Full year Normalised PBT uncertainty. lookout for strategic investments
estimated at €11.0-11.8m in 2019, • Among these uncertainties are in well positioned companies.
compared to €10.8m for 2018P Brexit, USA related tariffs and
• The Group targets €20m PBT in the political uncertainty in Argentina 3.5
3.3
*Normalised PBT represents Profits 2. 9
next 3-5 years, primarily via before tax before allowing for
significant
synergy effects and increased items and discontinued operations 1.7
1.3
1.0
profitability from current 2018P (proforma) based upon 2018 0 .5 0 .8
actuals as Oceanpath and Solo were
investments and both organic and owned for the full year
2010 2011 2012 2013 2014 2015 2016 2017 2018 2018P 2019
acquisitive growth. Outlook1H 2019 Results Presentation to Investors and Analysts We are Iceland Seafood
You can also read