1H 2020 Results Presentation - 13 August 2020 - City Developments Limited
←
→
Page content transcription
If your browser does not render page correctly, please read the page content below
1H 2020
                                  Results Presentation
                                  13 August 2020

Fuji Xerox Towers Redevelopment
Preliminary Artist’s Impression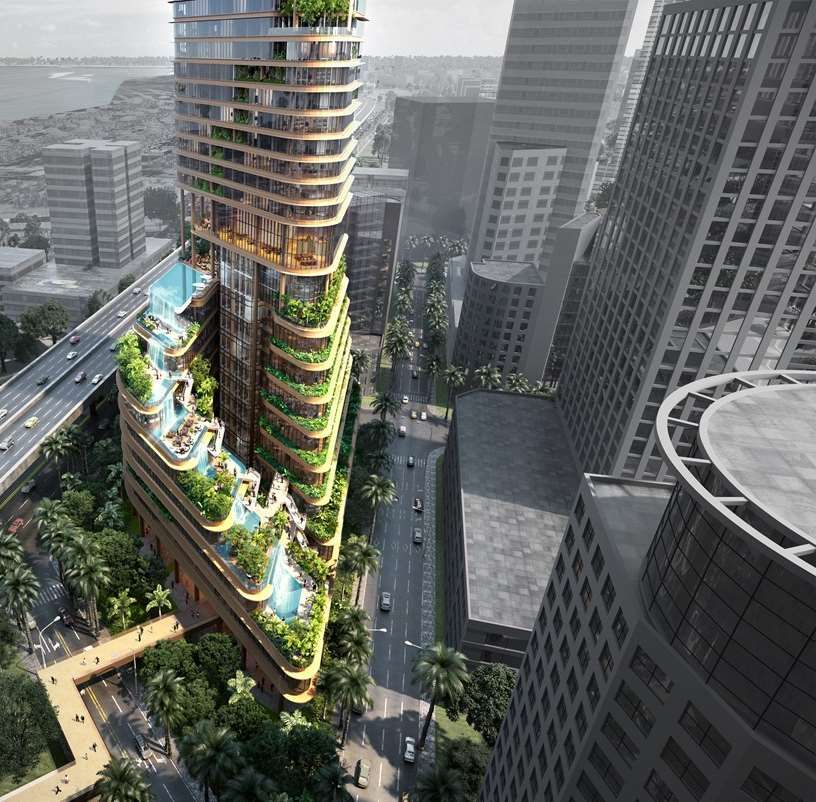
Agenda
➢ Overview & Strategic Initiatives   ➢ International Operations
➢ Financial Highlights               ➢ Hospitality
➢ Singapore Operations

Overview

Key Financial Highlights – 1H 2020
          Revenue                             Adjusted                               PBT                                        PATMI
1H 2020

                                              EBITDA *
          $1.1B                               $223.6MM                               $13.8MM                                    $3.1MM
              32.8%                                  66.2%                                  97.2%                                  99.1%

          1H 2019

          $1.6B                               $661.4MM                               $490.3MM                                   $362.0MM

          1H 2020 results was severely impacted by the outbreak of COVID-19 globally. With most of the countries
          imposing measures such as travel restrictions, quarantines, strict social distancing measures and complete
          lockdown of cities, this has impacted M&C Group overall hotel portfolio.

          Hotel operations segment pre-tax loss of $208MM, including impairment losses of $34MM for hotel properties
          made in light of the current pandemic.

          1H 2019 included a $197MM pre-tax gain resulting from the closure of the Group’s PPS 2 platform, following
          the sale of Manulife Centre and 7 & 9 Tampines Grande.

                    * Excluding impairment losses of $33.9MM.

                    No fair values adopted on investment properties.
                    Investment properties are stated at cost less accumulated depreciation and accumulated impairment losses.

                                                                                                                                           4
Key Financial Highlights – 1H 2020
          NAV per share                                          Share Price Performance
1H 2020

          $11.66                                                 $8.42^
               0.5% YoY                                                    23.1%
                                                                                                     2020 HIGHEST - $11.42 (14 Jan)
          FY 2019
                                                                  $10.95                                                                        $8.42
          $11.60                                                  (31 Dec)                                                                      (30 Jun)

          RNAV per share
1H 2020

          $16.61
               0.9%

          FY 2019:
          $16.46

              No fair values adopted on investment properties.
              Investment properties are stated at cost less accumulated depreciation and accumulated impairment losses.
                                                                                                                                      ^ As of 30 Jun 2020

                                                                                                                                                            5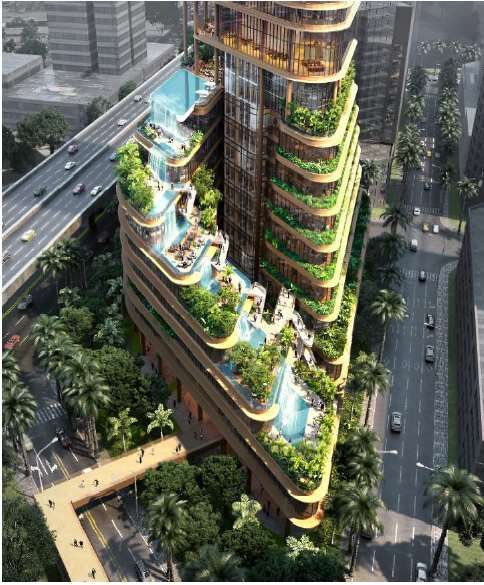
Key Operational Highlights – 1H 2020
Performance Summary
              ▪ SINGAPORE: Sold 356 units with total sales value of $514.7MM*

              ▪ CHINA: Sold 276 units with total sales value of RMB 750MM ($149MM)
Property
Development   ▪ AUSTRALIA: Exchanged contracts for over 70% of 195-unit The Marker project in Melbourne

              ▪ SINGAPORE: Resilient committed occupancy for core Singapore office & retail portfolio:
                   − Office: 90.6% (NLA: 1.8MM sq ft)
                   − Retail: 93.2% (NLA: 731,000 sq ft)
Asset
Management    ▪ OVERSEAS: Stable occupancy for office assets in London and China

              ▪ Performance severely impacted by COVID-19 pandemic:
                    − Hotel closures: 28% of 152 hotels worldwide temporarily closed
                    − Global occupancy: 39.4%         (▼ 32.8% yoy)
Hotel               − Global RevPAR:     $60.30       (▼ 56.6% yoy)
Operations          − Global ARR:        $153.20      (▼ 20.5% yoy)

              ▪ Continues to build pipeline, in active collaboration with capital partners to acquire new AUM
                   ‒ Acquired additional 8.4% effective stake in IREIT Global units in Apr 2020 for $25.5MM
                   ‒ Exploring establishment of a REIT with commercial assets located in the UK to be listed
Fund                  on Singapore Exchange (SGX)
Management

                                           * Includes Executive Condominiums (ECs) and share of JV partners, excludes Nouvel 18

                                                                                                                                  6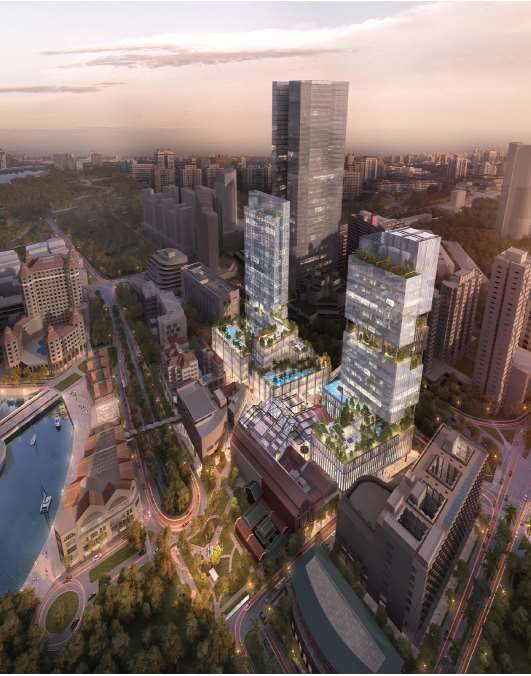
Portfolio Composition by Segment – 1H 2020
   Adjusted
   EBITDA *                                            1H 2020                            Total Assets ^
  $223.6MM                                                                                $23.8B

$147.3MM                                      Property Development                              $9.5B

($92.1MM)                                           Hotel Operations                            $5.7B

$108.1MM                                       Investment Properties                            $6.9B

 $60.3MM                                                       Others                           $1.7B

    * Earnings before interest, tax, depreciation & amortization and impairment losses.
    ^ Excludes tax recoverable and deferred tax asset.

                                                                                                           7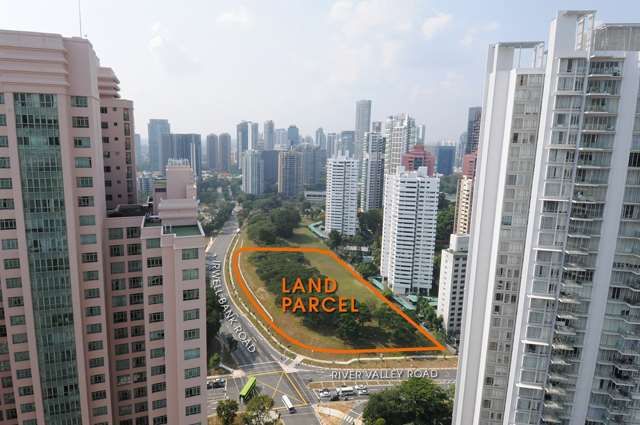
Global Portfolio Overview
Recurring Income Assets comprise 60% of Global Portfolio
The Group continues to grow through diversification in geography and asset class and will
have to weather cyclical typhoons from time to time.

                                                                                                  Recurring
                                       Total Assets:                                               Income
                                                                                                  Segments
                                        $23.8B
                                                                           Others                  60%
                                                                   China    4%
           Others                                                   6%
                                                              UK
                                                                                    Singapore
            18%                                                                        22%
                                                              5%

      US
                           Singapore
      7%
                              47%                                                            UK
                                                       Singapore
                                                          25%                                9%
      China
       14%                                                                                China
                                                                                           8%
                                                                                     US
                UK                                                    Others         7%
                14%                                                    14%

                                                                                                              8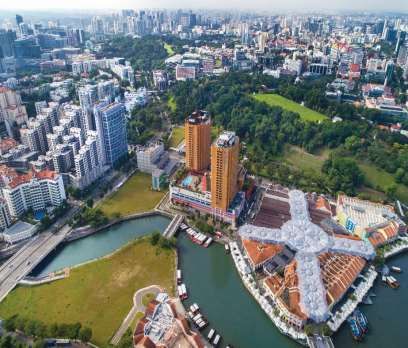
Strategic
Initiatives
GET Strategy
Accelerate Transformation of Asset Portfolio and Business Operations for Growth

                                                                             Growth
   Growth                                                                ➢ Build development
                                                                          pipeline & recurring

   Enhancement                                                               income streams

   Transformation
                                           Artist’s Impression

 Enhancement                                                     Transformation
 ➢ Enhance asset portfolio                                         ➢ Transform business via
 ➢ Drive operational                                                          new platforms:
   efficiency                                                           Strategic Investments,
                                                                           Fund Management,
                                                                                  Innovation &
                                                                               Venture Capital

                                                                                                 10
Focus 2020
• Redevelopment of Liang Court into
G rowth
mixed-used integrated development
comprising residential, retail, hotel and
serviced apartments1
• Redevelopment of Fuji Xerox
Enhancement Towers & Central Mall
• Establishing SGX-listed REIT
with commercial assets in UK
T ransformation • M&C Post-Acquisition
• Sincere Post-Acquisition
1. Stakeholders include CDL / CapitaLand (residential & retail), CDL / CDLHT (hotel) and ART (serviced apartments). 11GROWTH
Liang Court Redevelopment
Milestones Achieved
• Completed acquisition of entire site on 15 July 2020 with CapitaLand (CL) Group
• Provisional Permission (PP) obtained on 21 May 2020 affirming redevelopment design scheme
Redevelopment of Liang Court site into an Integrated Riverfront Development
Residential (CDL-CL JV) CDL Hotel
• One block of 48-storey and • One block of 21-storey
one block of 24-storey tower hotel (475 rooms)
• Approx. 700 apartment units • Operating under the Moxy
brand by Marriott
International
Somerset Serviced
Retail (CDL-CL JV)
Residence by ART 1
• 2-storey commercial • One block of 20-storey
podium with lettable area hotel (192 rooms)
of about 80,000 sq ft • To be operated by
• Shops on Basement 1, Somerset as serviced
Existing Liang Court site to be redeveloped
Level 1 and 2 residences with hotel
license
1. Ascott Residence Trust 12GROWTH
Upcoming Residential Launch in Q3 2020
Penrose – 566-unit City Fringe Project led by JV Partner, Hong Leong Holdings
Location Tenure Equity Stake Total Units Total Saleable Area (sq ft) Expected TOP
Sims Drive 99-year 40% 566 517,754 2024
Located at the heart of Upcoming Sims Drive Lifestyle Enclave, near Aljunied MRT Station:
▪ Excellent location and connectivity:
➢ Mere 5-min walk to Aljunied MRT station, which is one
stop away from Paya Lebar Central and Paya Lebar
MRT Interchange station
➢ Easy access to Pan Island Expressway (PIE) and
Kallang-Paya Lebar Expressway (KPE)
➢ 15-min drive to the CBD and Orchard Road shopping
belt
▪ Convenient access to comprehensive amenities, schools,
recreational facilities, and a transformative Paya Lebar
regional hub
Artist’s Impression
Penrose
13GROWTH
Upcoming Launch in 1H 2021
Irwell Bank Road – Iconic 36-storey Twin Towers Residential Development
– Designed by world-renowned architect MVRDV
Location Tenure Equity Stake Total Units Site Area (sq ft) Gross Floor Area (sq ft)
Irwell Bank Road 99-year 100% Est 540 137,600 385,400
Located in Prime District 9 near upcoming
Great World MRT station:
▪ Excellent location and connectivity within well-
established residential area:
➢ 200 metres from upcoming Great World MRT
station
➢ Minutes’ walk to Great World City Shopping Mall
➢ Minutes away from the CBD
▪ Close to Orchard Road shopping belt and education
institutions such as ISS International School, River
Valley Primary School and Dimensions International
College
14GROWTH
Diversified Residential Launch Pipeline
Singapore Pipeline ranges from Mass Market to High-end Projects
Launch Pipeline Irwell Bank Road
(Est 540 units)
>1,800 units* GLS site near
upcoming
Great World
Upcoming Launches MRT station
awarded in
Penrose (Sims Drive)^ Q3 2020 Jan 2020
Irwell Bank Road 1H 2021
Land cost: $583.9MM
Liang Court redevelopment^ 2021 ($1,515 psf ppr)
Liang Court redevelopment^
(Est 700 units) Penrose (Sims Drive)^
(566 units)
Est GFA: 60,158 sqm Land cost: $383.5MM*
($732 psf ppr)
* Includes JV partners share. ^ JV project.
15GROWTH
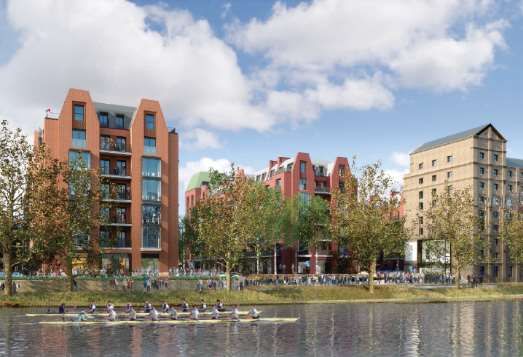
UK Private Rented Sector (PRS) Project
Construction in Progress for Monk Bridge PRS site in Leeds, UK
Artist’s Impression Artist’s Impression
Gross Floor
Location Tenure Equity Stake Total Units Site Area Completion
Area
Estimated
Monk Bridge Freehold 100% 665 193,700 sq ft 572,200 sq ft
2023
16GROWTH
New Asset Acquisition in Yokohama, Japan
Focus on Expanding CDL’s Private Rented Sector (PRS) Footprint in Japan
– Acquisition of 78-unit residential development in Yokohama City
Property Minami Ward,
Location Yokohama City
Tenure Freehold
10-storey residential
Storey Height
building
Total Units 78 apartments
Est Building
August 2020
Completion Date
Artist’s Impression
235 tsubo
Site Area
(8,300 sq ft)
Transaction Milestones
Net Lettable 906 tsubo
Purchase & Sale Building Deal Area (32,200 sq ft)
Agreement (PSA) Completion Completion
July 2020 Est. August 2020 Q3 2020
17ENHANCEMENT
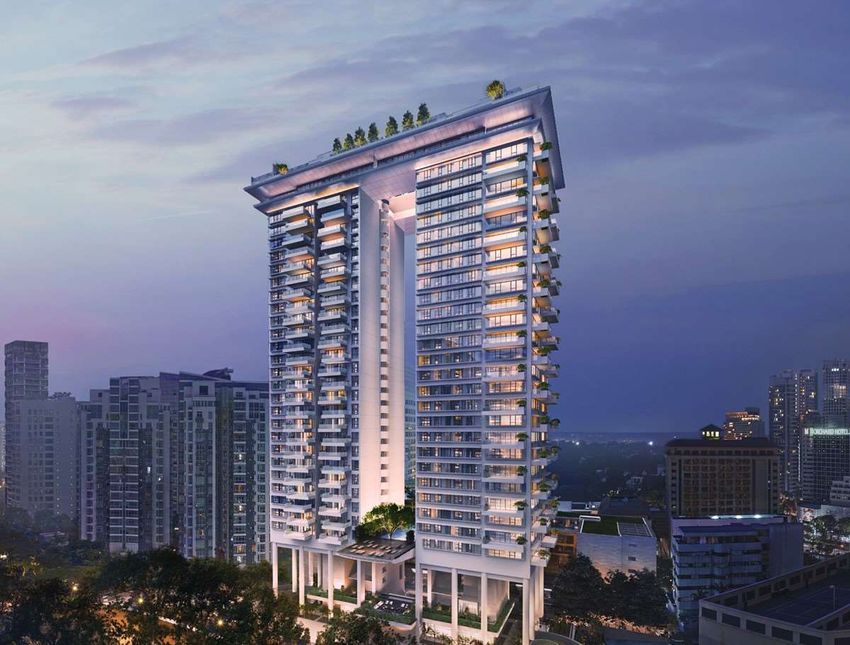
Redevelopment of Fuji Xerox Towers
PROPOSED USE *
51-storey freehold mixed-use integrated
development comprising office, retail,
residential and serviced apartments uses
Residential & Serviced Commercial
Apartments Uses Use
60% 40%
Potential uplift in GFA by 25%
to approximately 655,000 sq ft
Principal Architect
Nikken Sekkei Ltd
Preliminary Artist’s Impression
* Subject to authorities’ approval under Central Business District (CBD) Incentive Scheme
18ENHANCEMENT
Redevelopment of Central Mall
PROPOSED USE *
Mixed-use integrated
development comprising office,
retail, serviced apartments
and hotel uses
Commercial Hotel & Serviced
Use Apartments Uses
70% 30%
Potential uplift in GFA
from existing GFA of
approximately 240,000 sq ft*
(Pending URA’s approval)
Principal Architect
AEDAS
Preliminary Artist’s Impression
* Subject to authorities’ approval under Strategic Development Incentive Scheme
19ENHANCEMENT
Strategic ESG Integration
Driving Business Transformation through Strong Sustainability Focus
Environmental Performance
▪ 38% reduction in carbon emissions intensity from 2007; on track to achieve target of 59%
reduction by 2030 Ranked #3
▪ Achieved energy savings of more than $28MM savings for 8 commercial properties from out of 577 companies
2012 to 2019
Singapore Governance and
Sustainability-linked Financing Transparency
▪ $500MM Green Loan: Secured Singapore’s first green loans for new property
Index 2020
developments
▪ Pioneered $250MM SDG Innovation Loan: First-of-its-kind green financing concept to
accelerate innovation solutions.
Ranked on 12 Leading Global Sustainability Indices and Ratings
LATEST
ESG
MILESTONES Only Singapore real Only company in Southeast Asia Ranked world’s top real estate Only Singapore company to
estate company listed & Hong Kong to achieve this company, top Singapore company, win multiple accolades at the
for 3rd consecutive year double ‘A’ honour for both climate and 1st & only Singapore company 5th Asia Sustainability
change and water security listed on Global 100 for Reporting Awards
11 consecutive years
‘AAA’ since 2010
Since 2017
Since 2002
20TRANSFORMATION
Platform Initiatives
Transform Business via New Platforms
Strategic Investments Fund Management
M&C AUM Target:
Sincere Acquisition
Post-Privatisation US$5B by 2023
➢ Focus on achieving synergies, cost ➢ Transaction completed in April 2020 ➢ Accelerate growth by setting up a
efficiencies and driving profitability private fund and/or REIT
➢ New management team onboarded
by tapping onto the Group’s wider to drive integration and restructuring ➢ Continue to actively build
capabilities
➢ Actively exploring asset divestment pipeline and collaborate with
➢ Holistic review of enlarged hotel of its investment properties capital partners to acquire new
portfolio and possible divestments AUM
of non-core hotels
➢ Strengthen fund management
expertise and track record
Beijing
through strategic investments
Tianjin such as IREIT Global
Yantai
Zhengzhou Qingdao
Luoyang
Chengdu Zhenjiang
Changzhou
Wuxi Suzhou
Chongqing Huzhou Shanghai
Ningbo
Hangzhou
Changsha
Kunming
Guangzhou
Shenzhen
21Financial Highlights
Financial
Highlights
Property Hotel Investment Others
Development Operations Properties
1H 1H 1H 1H 1H 1H 1H 1H
2020 2019 2020 2019 2020 2019 2020 2019
Revenue $464MM $536MM Revenue $355MM $785MM Revenue $186MM $208MM Revenue $68MM $68MM
PBT $115M $180MM PBT ($208MM) $30MM PBT $26MM $258MM PBT $81MM $23MM
▪ Decrease in revenue and PBT ▪ This segment was severely ▪ Decrease in revenue was mainly ▪ PBT was largely boosted by:
mainly due to timing of profit impacted by the prolonged due to
recognition COVID-19 pandemic which ✓ rental rebates granted mainly ✓ $23MM divestment gain upon
severely affected the global to retail tenants in Singapore, sale of a non-core subsidiary
✓ 1H 2020 contributions largely hospitality sector with travel Phuket and Suzhou ✓ Higher share of contribution
from The Tapestry, Whistler restrictions, trip cancellations, ✓ Lower rental from CDLHT from First Sponsor Group in
Grand and Amber Park, with postponement of major events hotels accounted for as relation to its property
thinner profit margins and a steep reduction in F&B investment properties due to financing business
Vis-à-vis spend the pandemic ✓ Higher interest income earned
✓ 1H 2019 contribution largely ▪ Global RevPAR declined 57% ▪ Lower divestment gains in 1H from a loan extended to, and
from New Futura, Gramercy driven by decline in occupancies 2020 accounts for the sharp bond issued by Sincere
Park and Hong Leong City with the lockdowns decline in pre-tax profits. Property Group, an
Center, Suzhou, with higher ▪ US, Europe and Asia all Included in 1H 2019 was a established real estate
profit margins generated pre-tax losses substantial gain of $197MM developer in China, which has
▪ Impairment losses of $34MM resulting from the closure of the become a JV partner in Apr
▪ More financing costs expensed was provided in 1H 2020 Group’s PPS2 platform, following 2020
off for new projects ▪ Divestment gain of $26MM upon the sale of Manulife Centre and 7
the sale of Cincinnati Hotel & 9 Tampines Grande
mitigated the losses
23Financial Highlights
Revenue by Segment for Half Year (2018 – 2020)
$2,417MM $1,597MM $1,073MM
1,600
1,382
1,400
1,200
$ (MM)
1,000
798 785
800
600 536
464
400 355
169 208 186
200 68 68 68
0
1H 2018 1H 2019 1H 2020
Property Development Hotel Operations Investment Properties Others
24Financial Highlights
Adjusted EBITDA^ by Segment for Half Year (2018 – 2020)
$660MM $661MM $224MM
440
400 370
360 334
320
280
240 197
$ (MM)
200
146 147
160 130 116 108
120
80 61
40 14 14
0
(40)
(80)
(120) (92)
(160)
1H 2018 (Restated) * 1H 2019 1H 2020
Property Development Hotel Operations Investment Properties Others
^ Excluding impairment losses of $33.9MM.
* Restated due to expensing off interest costs for development projects under POC method on adoption of agenda decision issued by IFRIC.
25Financial Highlights
Profit Before Tax by Segment for Half Year (2018 – 2020)
$514MM $490MM $14MM
400 357
360
320
280 258
240
200 180
160 115
$ (MM)
120 87 81
80 56
14 29 23 26
40
0
(40)
(80)
(120)
(160)
(200)
(240) (208)
1H 2018 (Restated) * 1H 2019 1H 2020
Property Development Hotel Operations Investment Properties Others
* Restated due to expensing off interest costs for development projects under POC method on adoption of agenda decision issued by IFRIC.
26Financial Highlights
Strong Balance Sheet & Liquidity Position
Sufficient Financing Balanced
Gearing
Liquidity Flexibility Debt Profile
Net Gearing Total Cash Interest Cover % of
Ratio 1 Fixed Rate Debt
71% $2.7B 3.9x 39%
FY 2019: 61% FY 2019: $3.1B FY 2019: 14.7x FY 2019: 40%
Net Gearing 2 Cash and Available Average Average
(include fair value) Undrawn Committed Borrowing Cost Debt Maturity
Bank Facilities
50% $4.0B 3
2.1% 2.1 years
FY 2019: 43% FY 2019: $5.6B FY 2019: 2.4% FY 2019: 2.4 years
1 Exclude non-cash impairment losses on investment properties and property, plant and equipment
2 After taking in fair value on investment properties
3 The Group had completed its financing of $1.15B funding for its share of investment into Liang Court JV with CapitaLand.
Accordingly, the amount of cash and available undrawn committed bank facilities stands at $5.1B to date.
27Financial Highlights
Prudent Capital Management
➢ Balanced debt expiry profile
➢ Balanced debt currency mix – adopting a natural hedging strategy
➢ Average borrowing cost kept low
Well-Spread Debt Maturity Profile
38%
4,000 Bond Bank Loan
100
3,600 Others (2.6%)
RMB (4.8%) 276
Debt $ (MM)
3,200 499
JPY (5.1%) 533
2,800 USD (10.3%)
2,400 22% 1,077
Debt
319 17%
2,000 3,874 Currency SGD
1,600 Mix 4,842 (46.2%)
890
1,200 9% 3,243
125 1,938 7% 7% GBP (31.0%)
800
400 934
400 835 680
306 69 $10,470MM
0
2020 2021 2022 2023 2024 2025
onwards
28Singapore Operations Property Development
Singapore Property Market
Property Price Index – Residential (2014 – Q2 2020)

                           All Residential
                                                             Price Increase
180                                                           (1.2% YoY)
                                                           Prices in Q2 2020 inched
                                                            upwards over the past
                                                              year and saw slight
                                                            recovery compared to           Q2 20:
                                                               previous quarter
                                                                                            152.6
160

140

120
      Q1 Q2 Q3 Q4 Q1 Q2 Q3 Q4 Q1 Q2 Q3 Q4 Q1 Q2 Q3 Q4 Q1 Q2 Q3 Q4 Q1 Q2 Q3 Q4 Q1 Q2
      14 14 14 14 15 15 15 15 16 16 16 16 17 17 17 17 18 18 18 18 19 19 19 19 20 20

                                                                              Source : URA, Q2 2020

                                                                                                      30
Singapore Property Market
• Private residential prices remained stable, with the URA Residential Property Price Index registering a
0.7% decline in 1H 2020 as compared to end 2019.
• Primary home sales remained healthy in 1H 2020 with 3,862 units sold, registering an 8% decline as
compared to 1H 2019.
Price
Sales volume vs Price growth growth%
25,000 20.0%
17.6% 22,197
Price growth of 5.8% over 15.0%
20,000 the 5-year period from
16,292 15,904
Q2 2015 – Q2 2020
10.0%
15,000 14,688 14,948
5.9% 7.9%
10,566 2.7% 5.0%
2.8%
10,000 1.7% 1.1% 8,795 9,912
7,972 1.1%
7,316 7,440 0.0%
-4.7% -0.7%
5,000 -3.1% 3,862
-4.0% -3.7% -5.0%
4,264
- -10.0%
2008 2009 2010 2011 2012 2013 2014 2015 2016 2017 2018 2019 *1H
2020
CCR RCR OCR Price growth (year on year)
* 1H 2020 includes units sold in Q1 2020 (2,149u) and Q2 2020 (1,713u) Source : URA Statistics
31Singapore Property Development
Residential Units Sold by CDL
1H 2020
1H 2019
Sales Value
Majority of units sold
505
$1,551,398
were The Tapestry,
Whistler Grand and
Piermont Grand projects
66.8% yoy
595,735
Units Sold
356
29.5% yoy
332,631
1H 2020 – Mainly mass-market projects sold
$514,662 Period Project Market Units
Segment Sold
The Tapestry Mass 105
1H
Whistler Grand Mass 78
2020
Piermont Grand Mass 92
1H Boulevard 88 High-end 62
2019 Amber Park Luxury 157
No. of Units* Sales Value* Total Floor Area*
($'000) (sq ft)
* Includes Executive Condominiums (ECs) and share of JV partners, excludes Nouvel 18
32Singapore Property Development
Resilient Sales Performance in 1H 2020
➢ Sold 356 units with total sales value of $514.7MM in 1H 2020^
➢ 176 units sold in Q2 (▼4.9% from Q1)
Steady Sales for 2019 Launched Projects
Project Location Tenure Equity Total Units Achieved
Stake Units Sold* Average
Selling Price
(ASP)
Orchard
Boulevard 88 Freehold 40% 154 98 >$3,780 psf
Boulevard
Piermont Grand
Amber Park Amber Road Freehold 80% 592 211 >$2,480 psf Sengkang Grand (July)
Residences
Haus on Handy Handy Road 99 years 100% 188 35 >$2,870 psf (November)
Piermont Grand Sumang Walk 99 years 60% 820 577 >$1,090 psf
Sengkang Grand Sengkang
99 years 50% 680 255 >$1,730 psf
Residences Central
Anderson
Nouvel 18~ Freehold - 156 29 >$3,440 psf
Road
Amber Park
(May)
Artist’s Impression
Haus on Handy Boulevard 88
(July) (March)
Nouvel 18~
(July) * As of 9 Aug 2020
^ Includes Executive Condominiums (ECs) and share of JV partners, excludes Nouvel 18 ~ Divested project marketed by CDL 33Singapore Property Development
Inventory of Launched Residential Projects – As at 30 June 2020
Total Unsold CDL’s Share of
Project Equity Stake Total Units Units Sold
Inventory Unsold Inventory
Cuscaden Residences 25% 75 74 1 0.3
St. Regis Residences 33% 173 161 12 4.0
The Oceanfront @ Sentosa Cove 50% 264 263 1 0.5
One Shenton 100% 341 327 14 14.0
Cliveden at Grange** 100% 110 43 67 67.0
UP@Robertson Quay 100% 70 61 9 9.0
Echelon 50% 508 506 2 1.0
The Venue Residences 60% 266 265 1 0.6
Coco Palms 51% 944 942 2 1.0
Forest Woods 50% 519 517 2 1.0
New Futura 100% 124 124 0 0.0
The Tapestry 100% 861 801 60 60.0
Whistler Grand 100% 716 528 188 188.0
Boulevard 88 40% 154 96 58 23.2
Amber Park 80% 592 209 383 306.4
Haus on Handy 100% 188 34 154 154.0
Piermont Grand 60% 820 540 280 168.0
Sengkang Grand Residences 50% 680 241 439 219.5
South Beach Residences 50% 190 135 55 27.6
The Jovell 33% 428 133 295 97.4
TOTAL: 8,023 6,000 2,023 ~1,342
The Venue Shoppes – sold 16 units out of 28 sold, 12 units unsold with 3 units leased
** Leasing strategy implemented
34Singapore Operations Asset Management
Singapore Commercial Market
Property Price Index – Commercial (2014 – Q2 2020)

                                                      Price Decline
 150
                                                      (-12.1% YoY)
                                                        Office price has
                                                     softened over the last
                            Office    Retail              four quarters                       Q2 20: 126.9
 140

 130

 120
                                                                                              Q2 20: 108.8

 110

 100
                                                             Price Decline
                                                              (-1.8% YoY)
                                                              Slight decrease in
                                                            retail price in 1H 2020
 90

 80
       Q1 Q2 Q3 Q4 Q1 Q2 Q3 Q4 Q1 Q2 Q3 Q4 Q1 Q2 Q3 Q4 Q1 Q2 Q3 Q4 Q1 Q2 Q3 Q4 Q1 Q2
       14 14 14 14 15 15 15 15 16 16 16 16 17 17 17 17 18 18 18 18 19 19 19 19 20 20

                                                                                      Source : URA, Q2 2020
                                                                                                              36
Singapore Commercial Market
Property Rental Index – Commercial (2014 – Q2 2020)
Rental Decline
(-4.6% YoY)
250 No change to office rent
from previous quarter,
Office Retail after three consecutive
quarterly decline
Q2 20: 168.7
200
150
Q2 20: 95.2
100
Rental Decline
(-1.3% YoY)
50 Slight drop in retail
rent in 1H 2020
0
Q1 Q2 Q3 Q4 Q1 Q2 Q3 Q4 Q1 Q2 Q3 Q4 Q1 Q2 Q3 Q4 Q1 Q2 Q3 Q4 Q1 Q2 Q3 Q4 Q1 Q2
14 14 14 14 15 15 15 15 16 16 16 16 17 17 17 17 18 18 18 18 19 19 19 19 20 20
Source : URA, Q2 2020
37Singapore Commercial Portfolio
Strong Committed Occupancy and Positive Rental Reversion for Office & Retail
Portfolio (As at 30 June 2020) (1)
Office Retail
12 properties 9 properties
90.6% 93.2%
Committed Occupancy Committed Occupancy
1.8MM sq ft 731,000 sq ft
Net Lettable Area REPUBLIC PLAZA
Net Lettable Area
CITY SQUARE MALL
Lease Expiry Profile 22.4%
by % of NLA 16.9%
▪ Income stability from 12.1%
9.9%*
well-spread lease expiry 8.3%
7.2%
profile 6.0% 5.8% 4.8%4.9%
2.5%*
▪ Active risk management 6.4% 0.8%
by engaging tenants 4.4%
ahead of lease expiries
2020 2021 2022 2023 2024 2025 & beyond
Office - Completed Retail - Completed Office Retail
* Refers to expiring leases that have been renegotiated
(1) Includes all Singapore assets under management (including JV project South Beach) except for Fuji Xerox Towers which will be redeveloped, in accordance
to CDL’s proportionate ownership.
38Singapore Commercial Portfolio
Trade Mix of Office & Retail Space by % of Total Gross Rental Income
(As at 30 June 2020)*
Office Retail
Supermarkets
& Value Store, Electrical, Electronics
Sporting & Telecommunications,
Technology & Banking, Insurance & 5.8%
Goods, 3.0% 2.1%
ICT, 13.5% Financial Services,
20.4% Others, 3.0% Fashion &
Accessories, 9.4%
Retail Products Medical & General
& Services, Services, 8.8%
9.6%
Energy, Commodities,
Maritime & Logistics,
9.3% Leisure &
Entertainment,
9.2% Food &
Real Estate, Government, 0.3% Beverage,
16.8% Kids & 34.9%
Manufacturing &
Distribution, 4.0% Education, 6.0%
Jewellery, Optical &
Others, 2.3% Watches, 1.7%
Professional
Services, Home, Lifestyle & Gifts, 5.9% Health & Beauty,
23.8% 10.0%
• Diverse and well-spread tenant mix across both office and retail segments:
➢ Office: Trade mix remains largely stable with more focus on lease renewal amid a cautious environment.
➢ Retail: Strategically review leasing strategies to adapt to new retail norm to sustain occupancy.
* Includes all Singapore assets under management (including JV project South Beach) except for Fuji Xerox Towers which will be redeveloped, in accordance to
CDL’s proportionate ownership and excludes retail gross turnover rent.
39Singapore Office Market Outlook
Grade A office rental is expected to moderate in 2020. Nonetheless, office rents continue to
exceed the 10-year average Grade A rent of $10.11 psf per month moving into 2020/2021.
GRADE A OFFICE REN TAL PROJECTION S
Source: CBRE Research
*Refers to percentage change from Q4 2019
40Singapore Retail Market Outlook
Prime retail rents are expected to decline in 2020. Rental corrections in 1H 2020 have been
relatively muted, partially offset by rental rebates granted via government reliefs. However,
steeper rental fall is expected in 2H 2020 due to higher expected vacancies, lower footfalls,
social distancing measures and economic uncertainties due to COVID-19.
Source: CBRE Q2 2020 Prime Retail Rents
41International Operations
International Operations – Australia
Focus on developments across Eastern Seaboard of Australia New South Wales
Queensland
Artist’s Impression
Waterbrook Bayview
Artist’s Impression
Brickworks Park (Residential)
➢ Launching for pre-sales in 2H 2020
Artist’s Impression
222-unit development consisting of apartments and
townhouses located in the prestigious Alderley suburb in
North Brisbane.
Victoria Artist’s Impression
Waterbrook Bowral
➢ Waterbrook Bowral, a 135-unit
retirement housing project, has
received reservations on over 70%
of 77 units launched. Project is
targeted to begin construction in 2H
Artist’s Impression Artist’s Impression Artist’s Impression 2020
Project on Fitzroy (Mixed Use) The Marker (Mixed Use) Arco (Mixed Use)
➢ The Marker has exchanged contracts on over 70% of 195 units available, early works construction
commenced in Q2 2020
43International Operations – China
Focus on Tier 1 and Tier 2 Cities Suzhou (苏州)
Continued Sales Momentum:
Total sales of RMB 3.98B generated
Chongqing(重庆) for 92% of 1,804 units to date*^
Relaunched in May 2018: ➢ Phase 1 – 99% sold
Sold 98 units to date* ➢ Phase 2 – 67% sold
➢ Sales value of RMB 585MM ➢ 32,101 sqm Grade A office tower is 75%
occupied and operational since June
2019
➢ HLCC mall is 79% occupied
➢ Hotel expected to open in Q4 2021
Hong Leong City Center (丰隆城市中心)
Eling Palace (鹅岭峯)
Commercial sales
launched in Apr 2020: Asset rebranding
Sold 730 units to date* completed:
➢ Sales value of RMB ➢ Renamed as Hong Leong
2.07B Hongqiao Centre – formerly
➢ Expected completion known as Shanghai Hongqiao
by end 2020 Sincere Centre (Phase 2)
Artist’s Impression
➢ Occupancy for office and
serviced apartments remain
Shanghai (上海)
Emerald (翡翠都会) stable at around 50% and
70% respectively
Good Uptake post-COVID: Stable income
Asset
61 villas sold todate* stream:
➢ Sales value of RMB 1.37B ➢ Comprises 5 office enhancement:
towers with 2 levels ➢ Operational since
of basement carpark Jan 2019
with GFA of 32,182 ➢ Exterior works expected to
sqm complete by Q3 2020
➢ 3 office towers
(71% of total NLA)
are leased out as
Artist’s Impression
serviced apartment
For Illustration Only and postnatal
Hong Leong Plaza Hongqiao Yaojiang International
confinement centre
Hongqiao Royal Lake (御湖) (虹桥丰隆广场) (耀江国际)
44
^ Excludes 143 units transferred to CDL’s wholly-owned subsidiary for investment purpose. * As of 9 August 2020International Operations – Japan
Expansion of PRS Portfolio with New Acquisition
Acquisition of prime residential
asset in Yokohama City
S&P agreement executed in July 2020
Park Court Aoyama The Tower Freehold site in Shirokane
Completed in Q1 2018: Development Site:
➢ 160-unit freehold joint venture ➢ Prime 180,995 sq ft freehold
residential project launched in Oct 2016 site acquired in Oct 2014
➢ Units are progressively being handed
over – 158 units handed over*
Artist’s Impression
Freehold residential asset
consisting of 78 units
Horie Lux, Osaka B-Proud Tenmabashi Pregio Joto Chuo Pregio Miyakojima Hondori
Freehold residential asset consisting of 29 Freehold residential assets consisting of 130 units across 3
residential units and 5 retail units across 14-storeys properties in Osaka
* As of 9 August 2020 45International Operations – UK Residential
Strengthening our Presence
Marketing activities in progress
Sydney Street, Chelsea Monk Bridge, Leeds
Artist’s Impression
Marketing activities in progress Fully sold Planning in progress
Artist’s Impression
Teddington Riverside
Knightsbridge 28 Pavilion Road, Knightsbridge
Marketing activities in progress
Planning in progress Planning in progress
Chesham Street, Belgravia
Artist’s Impression Artist’s Impression
Ransomes Wharf Stag Brewery
46UK – Recurring Income Projects
Strengthening our presence in London
NLA 328,819 NLA 210,504
Tenants 25 Tenants 4
Occupancy 93.6% Occupancy 85.9%
WALE 5.5 years WALE 6.6 years
Yield 4.8% Yield 4.6%
CDL’s CDL’s
£385MM £183MM
Acquisition Acquisition
Aldgate House
Planning in progress
125 Old Broad Street
Artist’s Impression
Artist’s Impression
Development House
47Hospitality
Hotel Operations
 Trading Performance
                                   1H 2020       1H 2019   Change
                                    $MM           $MM        %
Revenue                                 355.3     785.3     (54.8)
Profit Before Tax (PBT)             (208.2)       29.5      NM *
Adjusted EBITDA ^                       (92.1)    116.4     NM *

Group RevPAR : ↓ 56.6% in 1H 2020 (constant currency)                   M Social Singapore
               ↓ 56.3% in 1H 2020 (reported currency)

Revenue, PBT and Adjusted EBITDA decreased mainly due to:
• Border closure and lockdown measures, which continue to significantly impact occupancy and widespread
  event deferment/cancellations. This was despite a strong performance for January and February across
  various hotels.

• Labour issues and racial justice protests in the US region, as well as Brexit in Europe, created additional
  disruption in their respective regions. COVID resurgence threat seen in some regions.

• Muted global recovery in hotel occupancy going into Q3, with persistent uncertainty. Losses are expected
  to continue through end-year, with hotels continuing to implement cost-cutting strategies for survival.

        ^ Excluding impairment losses                                                                           49
        * Not meaningful
Hotel Operations
Hotel Occupancy, Average Room Rate, and RevPAR by Region for CDL Group
Room Occupancy Average Room Rate RevPAR
1H 1H Incr / 1H 1H Incr / 1H 1H Incr /
2020 2019 (Decr) 2020 2019 * (Decr) 2020 2019 * (Decr)
% % % pts $ $ % $ $ %
Singapore 65.5 84.7 (19.2) 126.2 185.5 (32.0) 82.6 157.1 (47.4)
Rest of Asia 29.4 67.4 (38.0) 128.8 161.9 (20.4) 37.9 109.2 (65.3)
Total Asia 43.7 74.2 (30.5) 127.3 172.4 (26.2) 55.6 127.9 (56.5)
Australasia 45.9 84.0 (38.1) 163.4 151.5 7.9 75.0 127.3 (41.1)
London 24.6 78.1 (53.5) 221.4 218.7 1.2 54.4 170.7 (68.1)
Rest of Europe 27.9 69.8 (41.9) 134.4 153.8 (12.6) 37.5 107.4 (65.1)
Total Europe 26.3 73.4 (47.1) 172.8 184.0 (6.1) 45.5 135.1 (66.3)
New York 53.3 82.5 (29.2) 205.2 323.7 (36.6) 109.3 267.0 (59.1)
Regional US 34.9 56.4 (21.5) 148.0 188.2 (21.4) 51.6 106.1 (51.4)
Total US 41.9 65.0 (23.1) 175.6 245.0 (28.3) 73.5 159.3 (53.9)
Total Group 39.4 72.2 (32.8) 153.2 192.6 (20.5) 60.3 139.1 (56.6)
* For comparability, 1H 2019 Average Room Rate and RevPAR have been translated at constant exchange rates (30 Jun 2020). 50Hotel Operations
Asset Enhancement
While non-essential capital expenditure has been deferred, the Group has utilised periods of low
occupancy to carry out critical guests-related asset enhancement works.
Copthorne King’s Hotel Singapore Studio M Singapore
The makeover of 142 rooms in the Tower Wing Soft refurbishment of all 360 rooms in Studio M
of Copthorne King’s Hotel was completed in Hotel has commenced in phases.
April 2020.
51Divestment – 1H 2020
Millennium Cincinnati
Hotel was closed on 31 December 2019 and sold on 14 February 2020 for
US$36MM (~$49MM) with a disposal gain of $26.4MM.
Millennium Cincinnati. United States
Copthorne Hotel Birmingham
Option to acquire alternative site under the agreement1 was not exercised
and terminated in April 2020.
Exercised the put option1 to sell the existing hotel. Target completion Q3
2021.
Copthorne Hotel Birmingham. United Kingdom
W Singapore
Sale of W Hotel to CDL Hospitality Trusts for $324MM was completed on 16
July 2020.
W Singapore – Sentosa Cove
1. In 2013, M&C entered into a compulsory purchase order agreement with Paradise Circus Limited Partnership (“PCLP”) - a joint venture comprising
developer Argent LLP and Birmingham City Council - regarding Paradise Birmingham. The agreements include put and call options that provide for
the Group to acquire an alternate development site and sale of the existing hotel to PCLP for £17.2MM (~$30.8MM).
52CDL Hospitality Trusts
Trading Performance
1H 2020 1H 2019 Change
$MM $MM %
Gross Revenue 52.1 93.8 (44.5)
Net Property Income
29.7 67.5 (56.0)
(NPI)
Grand Millennium Auckland, New Zealand
Gross Revenue and NPI decreased mainly due to the
unprecedented downturn in global tourism arising from the
lockdown measures and travel restrictions imposed by most
countries.
In mid-July 2020, the divestment of Novotel Singapore Clarke
Quay and acquisition of W Singapore – Sentosa Cove were
completed. The conclusion of the two deals also augmented
CDLHT’s balance sheet with a net cash inflow of $26.8MM.
W Singapore – Sentosa Cove
53CDL Hospitality Trusts
Trading Performance
% Change
Country Remarks
in RevPAR
Experienced 17.6% occupancy rate decline, despite securing government
Singapore (49.2) contracts. Accommodation demand from international travelers affected by
border closures.
Gestation of Raffles Maldives Meradhoo disrupted due to the COVID-19
Maldives (44.6)
situation and closed on 1 April 2020 to contain costs ahead of low season.
New Strong occupancy prior to 19 March lockdown and securing government
(32.2)
Zealand contracts in Q2 mitigated relative decline in RevPAR.
Fewer trade events during the quarter, coupled with occupancy plunge from the
Germany (66.5)
COVID-19 situation. Impairment recognized against rental receivables due.
Temporary closure of Hotel Cerretani Firenze – MGallery from 13 March.
Italy (79.1)
Impairment recognized against rental receivables due.
The travel bans implemented by the Government from 16 April until end-May
Japan (56.9)
restricted arrivals and weighed on demand during the Golden Week holidays.
United Corporate demand hit due to COVID-19 concerns, compounded by mandatory
(68.1)
Kingdom hotel closures on 24 March lasting through end-June.
54Disclaimer: This document may contain forward-looking statements that involve assumptions, risks and uncertainties. Actual future performance, outcomes and results may differ materially from those expressed in forward-looking statements as a result of a number of risks, uncertainties and assumptions. Representative examples of these factors include (without limitation) general industry and economic conditions, interest rate trends, cost of capital and capital availability, availability of real estate properties, competition from other developments or companies, shifts in customer demands, customers and partners, expected levels of occupancy rate, property rental income, charge out collections, changes in operating expenses (including employee wages, benefits and training costs), governmental and public policy changes and the continued availability of financing in the amounts and the terms necessary to support future business. You are cautioned not to place undue reliance on these forward-looking statements, which are based on the current view of management on future events. Numbers in tables and charts may not add up due to rounding.
Artist’s Impression
BOULEVARD 88 I SINGAPORE   www.cdl.com.sg
Appendix
Portfolio Composition – 1H 2020
                                                                    Recurring Income Segments

                             Property                       Hotel                    Investment
$ (MM)                                                                                               Others   Total
                           Development                    Operations                  Properties

Adjusted
EBITDA *
Local                                97                             5                          62      20      184

Overseas                             50                          (97)                          46      41      40

                                    147                          (92)                          108     61      224

Total Assets ^

Local                              6,028                        1,023                      3,587      678     11,316

Overseas                           3,447                        4,706                      3,375      986     12,514

                                   9,475                        5,729                      6,962     1,664    23,830
         * Earnings before interest, tax, depreciation & amortization and impairment losses.
         ^ Excludes tax recoverable and deferred tax asset.

                                                                                                                       58
Diversified Land Bank
Land Area (as at 30 June 2020) – CDL’s Attributable Share
Type of Development Land Area (sq ft)
Singapore International Total %
Residential 473,206 2,952,846 3,426,052 94
Commercial / Hotel 58,982 150,947 209,929 6
Total 532,188 3,103,793 3,635,981 100
Total Land Area1 – 3.6MM sq ft
Commercial /
Others* Singapore Hotel
15% 15% 6%
Australia
15% Composition Composition
By Region UK By Segment
35%
US
20% Residential
94%
* Includes Japan, Korea and Malaysia 59
1 Including M&C and its subsidiaries, exclude CDL New ZealandInternational Property Development
Residential Projects Launched To Date
Project City Equity Total Est. Total Expected
Stake Units Saleable Area Completion
(sq ft)
Australia
The Marker Melbourne 50% 195 174,048 Q4 2021
China
Hong Leong City Center (Phase 1) Suzhou 100% 1,374 1,378,891 Completed
Hong Leong City Center (Phase 2 – T2) Suzhou 100% 430 439,596 Completed
Hongqiao Royal Lake Shanghai 100% 85 385,394 Completed
Eling Palace Chongqing 50% 126 325,854 Completed
Emerald Chongqing 30% 820 1,116,106 Q4 2020
Japan
Park Court Aoyama The Tower Tokyo 20% 160 180,060 Completed
UK
Chesham Street, Belgravia London 100% 6 12,375 Completed
Teddington Riverside London 100% 239^ 233,870 Q3 2020
Sydney Street, Chelsea London 100% 9 15,991 Completed
# Effective economic interest is ~49%
^ Includes 15 affordable apartments
60International Property Development
Unlaunched Residential Projects
Project City Tenure Equity Total Est. Total Saleable Area / Expected
Stake Units GFA^ / Site Area+ (sq ft) Completion
UK
Ransomes Wharf London Freehold 100% 118 249,323^ TBC
Stag Brewery London Freehold 100% 663# 994,585+ TBC
Japan
Shirokane Tokyo Freehold 100% TBC 180,995+ TBC
Australia
Brickworks Park Brisbane Freehold 100% 222 502,345+ 2023
Fitzroy Melbourne Freehold 50% TBC 19,590+ 2024
North Melbourne Melbourne Freehold 50% TBC 33,024+ 2022
#Excludes 150 flexible assisted living / residential units and a care home with 80 ensuite rooms
61China – Project Development
China– Chongqing JV Projects
Eling Palace (鹅岭峯) and Emerald (翡翠都会)
Project Tenure Equity Total Expected
Stake Units Completion
Eling Palace 50 years 50% 126 Completed
50 years
(Residential) /
Emerald 30% 820 2020
40 years
(Commercial)
Eling Palace, Chongqing
Eling Palace:
➢ Sold 98 units with sales value of RMB 585MM*^ since relaunch in
May 2018
Emerald:
➢ Tower 3 with 192 units was launched in Dec 2018
➢ Tower 1 with 234 units was launched in Mar 2019
➢ Tower 2 with 252 units was launched in May 2019
➢ Loft with 142 units was launched in Apr 2020
➢ Sold 730 units with sales value of RMB 2.07B *^
Emerald, Chongqing Artist’s Impression
* As of 9 August 2020 ^ JV entity will manage project sales & marketing 62China – Development / Recurring Income Projects
Suzhou Mixed-use Waterfront Project
Hong Leong City Center (丰隆城市中心)
Equity Total Total Units %
Tenure Expected Completion
Stake Units Sold* Sold*
70 years
(Residential) /
40 years 100% 1,804 1,655^ 92 Completed (Phase 1 & 2~)
(Commercial)
▪ Total sales of RMB 3.98B generated to date:
➢ Phase 1 – 99% sold
➢ Phase 2 – 67% sold
Hong Leong City Center, Suzhou
▪ Phase 1: Tower 1 (462-unit residential) & Tower 3 (912-unit SOHO)
▪ Phase 2: Tower 2 (430-unit residential), 32,101 sqm office tower,
56,000 sqm retail mall & 32,600 sqm hotel
▪ HLCC mall started operations in June 2018 and is 79% occupied.
Recovery in sales and footfall in Q2 after the ease of lockdown
measures. However, it is not recovered to before COVID level
▪ M Social hotel expected to open by end-2021
▪ HLCC’s 32,101 sqm premium Grade A office tower is 75% occupied
and operational since June 2019
HLCC mall, Suzhou
* As of 9 August 2020 ^ Excludes 143 units transferred to CDL’s wholly-owned subsidiary for investment purpose 63
~Phase 2 completion excludes hotel componentChina – Recurring Income Projects
Hong Leong Plaza Hongqiao, Shanghai
Tenure Equity Stake Est. Total GFA (sqm)
50-year lease 100% 32,182
▪ Operational since Q4 2019
▪ Three office towers (71% of total NLA) have been leased out as serviced
apartment and confinement centre
Artist’s Impression
Hong Leong Plaza Hongqiao, Shanghai ▪ Due to slow down in rental market with decrease in office rental rates, a
lower achieved rental rate is anticipated in 2020
Yaojiang International, Shanghai
Tenure Equity Stake Est. Total GFA (sqm)
50-year lease* 100% 4,000
▪ Exterior works including facade and logo installation are
expected to be completed by Q3 2020
▪ Operational since January 2019
Yaojiang International, Shanghai
* With effect from 10 April 2002 64UK – Property Development
Launched Projects
31 – 33 Chesham Street
Total Saleable Area Total Expected
Tenure Equity Stake
(sq ft) Units Completion
Freehold 100% 12,375 6 Completed
• One unit sold and four units leased
31 – 33 Chesham Street
100 Sydney Street
Total Saleable Area Total Expected
Tenure Equity Stake
(sq ft) Units Completion
Freehold 100% 15,991 9+ Completed
• Marketing activities in progress – achieved 3 apartment sales to date
Teddington Riverside 100 Sydney Street
Total Saleable Area Total Expected
Tenure Equity Stake
(sq ft) Units Completion
Freehold 100% 233,870 224^ Q3 2020
• Phase 1: Carlton House and Shepperton House (76 apartments in total), is ready for
occupation
• Phase 2: Launch of townhouses and weir cottage in 2H 2020
+8 residential units + 1 retail unit ^ excludes 15 affordable housing units Teddington Riverside
65UK – Property Development
Unlaunched Projects
Ransomes Wharf
Tenure Equity Stake Est. Total Gross Floor Area (sq ft)
Freehold 100% 249,323
• Planning approvals granted for a 118-unit residential development with
flexible commercial floorspace and a 10-storey residential tower with
commercial accommodation
Ransomes Wharf Artist’s Impression
Stag Brewery
Tenure Equity Stake Site Area (sq ft)
Freehold 100% 994,585
• Planning applications for a mega mixed-use scheme consisting of
residential, community, recreational and commercial uses have been
referred to Greater London Authority (GLA)
Stag Brewery Artist’s Impression
66UK – Property Development
Unlaunched Projects
28 Pavilion Road
Tenure Equity Stake Est. Total Gross Floor Area (sq ft)
Freehold 100% 116,573*
• Planning approvals obtained for a 120-room hotel scheme, a 28-unit
residential scheme and a mixed-use scheme with 24 residential units
and a health club
28 Pavilion Road Artist’s Impression
Development House
Tenure Equity Stake Est. Total Gross Floor Area (sq ft)
Freehold 100% 111,440
• Planning approval granted for a 10-storey office building with flexible
retail space
Development House Artist’s Impression
*Based on a 120-room hotel scheme
67COVID-19 Update
COVID-19
      UPDATE
                   Operational Impact
Unprecedented Disruption Across All Business Segments
PROPERTY DEVELOPMENT               ASSET MANAGEMENT                     HOSPITALITY

 Lockdowns across several          Retail and F&B outlets hard hit:     Sector severely impacted by
 regions have affected sales                                            hotel closures:
 and development works:            ➢ Widespread business closures
                                     in Singapore during circuit        ➢ Government-mandated
 ➢ Residential sales affected by     breaker period – approx. 80%         closures in multiple regions –
   showflat closures                 of retail tenants closed; most       28%* of 152 hotels
                                     are now open under Phase 2           worldwide temporarily closed
 ➢ Construction works affected       reopening
                                                                        ➢ All regions recorded declines in
                                   ➢ Support initiatives amounting to     RevPAR (revenue per available
                                     over $30MM of property tax and       room) driven primarily by a
                                     rental rebates for tenants in        drop in occupancies
                                     Singapore and overseas

                                                                                              * As of 30 Jun 2020.

                                                                                                                     69
COVID-19
UPDATE
Property Development
➢ Singapore: Residential sales and development progress impacted by circuit breaker restrictions
such as temporary closure of 6 sales galleries and halt of construction works
➢ Overseas (China, UK, Australia): Sales and construction works impacted by lockdowns
and restrictions, with easing of measures in several regions
Business Operations Adapt and Remain Nimble
Enhanced Digital Marketing Continued to Register Sales Launch Pipeline for FY 2020
➢ Virtual showflat tours ➢ In Singapore, sales continue even Subject to market conditions:
Over 30% increase in online when sales galleries were closed ➢ Singapore: 566-unit Penrose, a JV
traffic views in April and May from 7 Apr to 18 Jun project at Sims Drive, is expected
➢ Online sales presentations Units Sold* to launch in Q3 2020
600 Units sold since ➢ Australia: 222-unit Brickworks
522 Phase 2
Park, a residential project in
500 Reopening
Alderley suburb, Brisbane
400 227
300
200
295
100
0
Haus on Handy I 2-bedroom virtual tour
19 Jun - 9 Aug Phase 2
Reopening
1 Jan - 18 Jun Artist’s Impression
Brickworks Park, Brisbane
* Includes Executive Condominiums (ECs) and share of JV partners, excludes Nouvel 18.
70COVID-19
UPDATE
Asset Management
Tenants Impacted by Global Shutdown of Non-essential Businesses
➢ Over $30MM rental relief & support to tenants in Singapore & overseas
Impact & Support Provided Month Ave. Rental Rebate
April 100%
Majority of Singapore
Singapore Retail segment hard hit since circuit breaker May 100% retail tenants to receive
• Over $23MM of rental and property tax >2.8 months*
June 50%
rebates to be provided to tenants of gross rental rebates
• Additional assistance available to tenants with July 30%
cashflow issues
Safe Management Practices implemented
China Recovery underway following lockdown exit across Singapore commercial portfolio
• Rental rebates for Suzhou HLCC mall
tenants
• Advertising & Promotion initiatives to drive
traffic sales
Thailand Ban on international travel expected to end
by 30 Jun
• Rental rebates to tenants at Jungceylon
Shopping Mall (Phuket) and Mille Malle SafeEntry at
(Bangkok) Retail & Office
properties
UK Portfolio shows resilience
• Rental deferments and repayment plans need
to be negotiated and agreed upon between
landlords and tenants
* Includes property tax rebates for qualifying commercial properties from the
Government that will be fully passed through to tenants. Thermal temperature scanning & safe distancing markers
71COVID-19
UPDATE
Asset Management
Gradual Recovery and Management on Resumption of Operations
Phase 2 of reopening from 19 Jun in Singapore
➢ Resumption of Retail Outlets, Restricted F&B Dine-in and Social Gatherings.
Singapore China
• Over 85% of retail tenants open
• While footfall has recovered by 88% since Phase 2 re-opening, Occupancy for office and serviced
retailers’ sales remain weak as compared to pre-COVID19 level apartments remain stable around 50% and
• Slight increase in traffic for office buildings with WFH still being the 70% respectively
default arrangement
Thailand
Lift in international travel only for selected
groups of travelers from 1 July 2020
Progressive easing of restrictions
UK
Portfolio shows resilience with the
Government implementing various
economic stimulus initiatives
72COVID-19
UPDATE
Asset Management
Leveraging on technology to ensure safety and well- Singapore
being of tenants and visitors
Autonomous robot
cleaner & scrubber
Use of cleaning robot
ensure more thorough
cleaning and
disinfecting.
73COVID-19
UPDATE
Hotel Operations
1H 2020 Performance Severely Impacted
All regions affected by travel restrictions, lockdowns and safe distancing measures:
➢ Global occupancy: 39.4% (▼ 32.8% yoy)
➢ Global RevPAR: $60.30 (▼ 56.6% yoy)
➢ Global ARR: $153.20 (▼ 20.5% yoy)
28% of Hotels Worldwide are Temporarily Closed (as at 30 June 2020)
➢ As restrictions are eased progressively, another
10 hotels resumed operations in July
Hotels
Total Closed
(as at 30 Jun 2020)
M Social Auckland
Hotel reopened in end
US 18 1 Apr 2020 as New
Zealand eased
UK & Europe 29 18 lockdown restrictions
Middle East* 45 13
Rest of Asia 27 5
Singapore 9 - Orchard Hotel
Singapore
Australasia 24 6 Hotel has obtained
approval for leisure
stays and is actively
Global total: 152~ 43 promoting its
staycation packages
* All franchised hotels to the domestic market
Notes:
1H 2020 Performance data excludes franchised hotels, such as the Middle East portfolio.
~ Excludes Novotel Singapore Clarke Quay which ceased operations from 1 Jul.
74COVID-19
UPDATE
Cost Management
Implementation of Business Optimisation and Cost Management Measures
Board Fees & Value Engineering
Management Cost
(effective since 1 April 2020) ➢ Maximise value engineering
across all projects
➢ Board of Directors: ➢ Leverage existing resources
Voluntary 25% reduction of ➢ Manage working capital
director’s fees
➢ Top management:
20% pay cuts
➢ Senior personnel:
15% pay cuts
Capex Capital Management
➢ Defer non-essential capex and ➢ Conserve cash
operating costs ➢ Maintain adequate liquidity
➢ Initiatives to reduce costs
across asset portfolio in place
75COVID-19
UPDATE
Operational Resilience
Business Volumes & Productivity Remain Strong
DIGITAL–READY WORKFORCE
CDL Homes
www.cdlhomes.com.sg
➢ Business volumes and productivity remains strong
through seamless remote working – Work from Home (WFH)
arrangement remains in place wherever possible for
Singapore’s Phase 2 reopening
Standing Together with Employees
➢ Residential sales continue despite temporary showflat
closures with emphasis on digital marketing initiatives such as ➢ Care packages for employees
virtual tours and online sales presentations ➢ Employee welfare & support: Facilities
management subsidiary CBM provided
➢ Emphasis on capability building and workforce training: accommodation and support for daily needs of
Employees attended >130 sessions online, clocked >21,000 Malaysian and foreign frontline employees
training hours*
* Since 7 Apr 2020.
76COVID-19
UPDATE
Community Initiatives
Supporting Vulnerable Individuals, Families and Communities Affected by COVID-19
Supporting Communities Supporting Frontline Workers
$400,000 donation to The Invictus Fund
➢ M&C hotels in most regions open to support
➢ Donation made by CDL, entire Board and Executive medical personnel, key workers, infrastructure
team to support Singapore’s social service agencies to workers and government employees
continue delivery of critical social services to
vulnerable individuals, families and communities ➢ Singapore hotels offer discounted accommodation
to affected Malaysian employees impacted by
$88,000 donation to workers at CDL Malaysia’s Movement Control Order
development projects
➢ “We Clean. We Care. We Welcome.” global
➢ Dollar-for-dollar match by CDL for contributions by campaign – initiatives to ensure a pleasant and
employees to provide workers with necessities during safe hospitality experience
circuit breaker period
77You can also read