1H FY19 RESULTS 26 Weeks to 30 Dec 2018 - City Chic Collective

Page created by Ruth Nunez
 
CONTINUE READING
1H FY19 RESULTS 26 Weeks to 30 Dec 2018 - City Chic Collective
1H FY19 RESULTS
 26 Weeks to 30 Dec 2018
1H FY19 RESULTS 26 Weeks to 30 Dec 2018 - City Chic Collective
EXECUTIVE SUMMARY

• Strong 1H19 result with 9.6% comparative sales
  growth and Underlying EBITDA growth of 22%

• Fully franked dividend of 5cps

• Significant growth opportunities for the
  business

  – ANZ: online lifestyle and range extensions,
    an expanded store footprint and
    enhancing all customer touchpoints

  – International: continuing growth through
    our multi-channel digital strategy

• Attractive investment proposition

  – High margins and strong cash generation

  – Excellent shareholder returns

  – Relatively low ongoing capital requirements

  – Positive growth outlook, backed up by
    track-record of consistent performance

                                                   1H FY19 Interim Results

                                                                        2
1H FY19 RESULTS 26 Weeks to 30 Dec 2018 - City Chic Collective
CONTENTS

1   Introducing City Chic

2   1H FY19 Results Overview

3   1H FY19 Financials Review

4   Strategy Overview

    Appendix
1H FY19 RESULTS 26 Weeks to 30 Dec 2018 - City Chic Collective
1

INTRODUCING CITY CHIC
1H FY19 RESULTS 26 Weeks to 30 Dec 2018 - City Chic Collective
CITY CHIC COLLECTIVE

       OUR
      VISION
                                                       LEADING A WORLD OF CURVES

      Brand
                                    BOLD                             SEXY                      GLAM             CHIC
                                      We Are                        We Fit for                 We Are a        We Create
                                      Fearless                     Confidence                  Sisterhood        Unique
                                                                                                               Experiences

                                            • City Chic is devoted to serving our curvy, fashion-forward customer and
                                              making her feel sexy and glam

                                            • Longstanding executive team1 who understands our customer

                                            • Plus size is an underserved segment; fastest growing of retail apparel
                                              market

1. Average time with the company is approximately 9 years for the Executive Leadership team.                1H FY19 Interim Results

                                                                                                                                 5
1H FY19 RESULTS 26 Weeks to 30 Dec 2018 - City Chic Collective
LEADING OMNI-CHANNEL RETAILER

                                                            Customer-centric approach

                                                         Understand customer wants and
                                                              spending behaviour
ONLINE CITY CHIC                                                                                             STORES
                                            Well presented and consistent customer touchpoints

                                                      Align team incentives across channels             ONLINE
WHOLESALE1                                                                                       MARKETPLACES2
                                                  Broader ranges to better serve our customer

                                                          Maintain nimble and responsive
                                                                   supply chain

1. Partners own the product and fulfil the sale (store and/or online depending on partner).        1H FY19 Interim Results
2. CCX feed product via partners’ platform, CCX owns the product and fulfils the sale.

                                                                                                                        6
1H FY19 RESULTS 26 Weeks to 30 Dec 2018 - City Chic Collective
2

1H FY19 RESULTS OVERVIEW
1H FY19 RESULTS 26 Weeks to 30 Dec 2018 - City Chic Collective
1H FY19 FINANCIAL HIGHLIGHTS

  Strong top line growth, higher margins
  • Comparable sales growth of 9.6%
  • Gross margin of 60.4% vs 59.4% pcp
                                                                                                              $75m                   $15.8m
                                                                                                              Global Sales             Underlying
      - Reduced discounting to achieve higher sell prices                                                        1H19                  EBITDA 1H19

      - Improved buying discipline, category and channel mix
      - Strong margins in both ANZ stores and online
  • 1H Underlying EBITDA of $15.8m vs $13.0m in pcp (22% growth1)
  • 1H Continuing Operations NPAT of $9.9m (EPS of 5.1 cents)
                                                                                                               9.6%                   21.0%
                                                                                                              Comp Sales             Underlying EBITDA
                                                                                                               Growth3                   Margin

  Strong cash flow, well capitalised
  • Net cash position of $35.5m vs net cash of $16.1m at July 2018
  • Debt facility fully repaid in July 2018; new $15m facility undrawn                                       60.4%                    19.7%
                                                                                                                 Gross                Underlying EBIT
                                                                                                                 Margin                  Margin

  Dividends recommence
  • Fully franked interim ordinary dividend of 2.5cps2
  • Fully franked special dividend of 2.5cps2                                                               $35.5m                     5cps
                                                                                                                Net Cash               Fully Franked
  • Maximum dividend payout to extent distribution can be fully franked                                                                  Dividend

1. Like-for-like earnings growth is higher given two additional trading days in the reported prior corresponding period.          1H FY19 Interim Results
2. Franking credit balance of $49.5m as at 30 December 2018.
3. Excludes wholesale. From FY19 annual results onwards, CCX will be reporting comp sales excluding partner sales (Wholesale and Marketplace/Dropship).
                                                                                                                                                         8
1H FY19 RESULTS 26 Weeks to 30 Dec 2018 - City Chic Collective
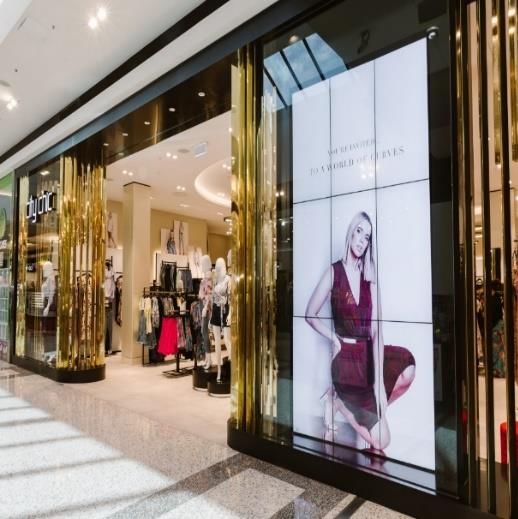
1H FY19 OPERATIONAL HIGHLIGHTS

     Strong momentum across all channels, regions
     • Online represents 40%1 of total sales (29% growth vs pcp)
                                                                                                                          104                       375K
       - Strong growth for ANZ and US website, expanded online exclusive                                                                          Active
         range and customer experience improvements                                                                       Stores3
                                                                                                                                                 Customers
       - Online is the most profitable channel
                                                                                                                          Channel: Contribution
     • Store revenue higher on LFL basis2, significant improvement in GM%
       - 8 Myer concessions closed (earnings neutral), 5 new standalone stores                                    12 Months to 30 Dec 18     12 Months to 31 Dec 17

       - 2nd large format store opened, trading ahead of expectations                                                   5%
                                                                                                                          5%
                                                                                                                                                    6%
                                                                                                                                                         6%

     • Wholesale positive revenue growth, 5% total sales
                                                                                                                                              26%
                                                                                                                  35%               55%
                                                                                                                                                              63%
     Online, cost focus delivers margin improvement
     • Cost of Doing Business (CODB) reduces to 39.5% of sales (40.9% in pcp)
                                                                                                                        Stores            Online Marketplaces
       - Increased contribution from lower cost online channel
                                                                                                                        Online City Chic             Wholesale
       - Tight cost controls at head office and in stores
                                                                                                                          Region: Contribution4
       - Exit from less profitable concessions and loss making stores

                                                                                                                                     16%

     Successful transition to standalone business
                                                                                                                                           84%
     • Moved to standalone IT infrastructure ahead of schedule
     • ANZ online platform integrated with USA platform                                                                          Southern Hemisphere
                                                                                                                                 Northern Hemisphere

1.   Includes City Chic website and Online Marketplace sales.                                                                              1H FY19 Interim Results
2.   1H18 included sales from South African stores, USA stores and select ANZ stores, which were closed in FY18.
3.   104 stores in total as at December 2018; 99 standalone stores (89 in Australia, 10 in New Zealand) and 5 Myer concessions.
4.   Territory breakdown based on 12 months to 30 Dec 18.
                                                                                                                                                                    9
1H FY19 RESULTS 26 Weeks to 30 Dec 2018 - City Chic Collective
TRACK RECORD OF DELIVERING CONSISTENT GROWTH

               SALES ($m)1                                  COMP SALES GROWTH2              ONLINE SALES PENETRATION3
                                    75.4                                                                           40%
                     70.4                                                   10.3%
       66.8                                                                         9.6%
                                                                                                       34%
                                                                                              28%

                                                           4.5%

      1H17           1H18           1H19                   1H17             1H18    1H19     1H17     1H18        1H19

     UNDERLYING EBITDA ($m)1                           UNDERLYING EBITDA MARGIN                 GROSS MARGIN %
                                    15.8                                            21.0%
                                                                            18.5%            61.4%
                     13.0                                                                                         60.4%
                                                                                                      59.4%
                                                           14.9%
       10.0

      1H17           1H18           1H19                   1H17             1H18    1H19     1H17     1H18        1H19

1. 1H FY19 has 2 less trading days than 1H FY17 and 1H FY18.                                            1H FY19 Interim Results
2. Excludes wholesale.
3. Online sales represent City Chic website and Online Marketplace sales.
                                                                                                                            10
3

1H FY19 FINANCIALS REVIEW

                        3

            1H FY19 FINANCIALS REVIEW
1H FY19 RESULTS OVERVIEW

                                                         FINANCIAL PERFORMANCE

  Sales Revenue                • 9.6% CSG2                                         Gross Profit
                                                                                                              • Improved margin to 60.4%
       $75.4m                  • 40% online sales                                     $45.6m                    vs. 59.4% pcp

       EBITDA1                 • 21.0% Margin                                           EBIT1                 • 19.7% Margin
     (Underlying)                                                                   (Underlying)
                               • CODB % of sales decreased                                                    • Relatively low ongoing
       $15.8m                    to 39.5% from 40.9% pcp                              $14.8m                    capital requirements

NPAT: Continuing1              • Strong NPAT result for City                      NPAT: Group3                • Limited earnings impact of
      (Reported)                 Chic business                                       (Reported)                 discontinued business
        $9.9m                  • EPS of 5.1 cents                                     $10.1m                  • EPS of 5.3 cents

                                                    FINANCIAL POSITION (30 Dec 18)

      Net Cash                 • Strong cash flow generation                        Inventory                 • Disciplined buying and controls
                               • Debt fully repaid
       $35.5m                                                                        $15.2m                   • Stock clean
                               • Well capitalised

1. Continuing operations excludes brands sold to Noni B on 2 July 2018.                                                            1H FY19 Interim Results
2. Excludes wholesale.
3. Group NPAT represents NPAT from continuing and discontinuing operations. There are only transaction related adjustments in discontinued operations;
   there is no operating revenue or expense in FY19.
                                                                                                                                                      12
FINANCIAL PERFORMANCE

A$m                             1H FY18   1H FY19

Continuing: Underlying

Sales Revenue                    70.4      75.4     • Strong comp sales growth despite cycling high
                                                      growth in prior period; driven by more full price
 Revenue Growth vs PCP           5.4%      7.1%       sales and strong online performance
 Comparable Sales Growth1        10.3%     9.6%
                                                    • Top-line sales growth impacted by closure of
Gross Profit                     41.8      45.6       loss making stores in South Africa and Australia
                                                      in 2H18, and US stores in Sep 2017
 Gross Profit Margin            59.4%     60.4%
                                                    • Support office costs in line with expectations
Underlying CODB                  28.8      29.8       for the standalone business
Underlying EBITDA                13.0      15.8
                                                    • Earnings margin improvement driven by
 Underlying EBITDA Margin       18.5%     21.0%       growth in online, tight cost control and exiting
                                                      less profitable stores and concessions
Underlying EBIT                  11.8      14.8
                                                    • Strong EBIT margin driven by relatively low
 Underlying EBIT Margin         16.8%     19.7%       capital requirements
Group: Reported
                                                    • NPAT from discontinued operations represents
 NPAT: Continuing                           9.9       transaction related adjustments

 NPAT: Discontinued                         0.3

NPAT: Group                                10.1

1. Excluding wholesale sales.                                                           1H FY19 Interim Results

                                                                                                            13
CASH FLOW

 A$m                                             1H FY18        1H FY19

 Continuing                                                                         • Normalised operating cash flow of $14.6m in
                                                                                      1H FY19; adjusted for “one-off” shortening of
 Receipts from customers                            76.6          82.2
                                                                                      trade creditor terms whilst new trade facility
                                                                                      being implemented and outflows associated
 Payments to suppliers                             (62.2)        (90.2)
                                                                                      with the divested brands, the transaction and
 Interest and other revenue                         (1.0)          0.2                the transition1

 Income taxes                                       (0.3)         (1.0)             • Interest income earned on net cash position

 Operating Cash Flows                              13.1           (8.7)
                                                                                    • Capex primarily relates to IT outlays to
                                                                                      transition to a standalone system and network,
 Capex                                             (0.8)          (3.5)               the new store roll-out and enhancements to
                                                                                      the existing store portfolio
 Sale proceeds                                       -            31.1
                                                                                    • Sale proceeds of $31m received for sale of
 Investing Cash Flows                              (0.8)          27.6                brands to Noni B, prior to completion
                                                                                      adjustments
 Repayment of borrowings                           (19.3)        (12.9)
                                                                                    • Debt facility fully repaid in July 2018
 Financing Cash Flows                              (19.3)        (12.9)
                                                                                    • Interim ordinary dividend of 2.5cps and
                                                                                      special dividend of 2.5cps declared ($9.6m in
 Increase/(Decrease) in Cash: Continuing           (7.0)           6.0                aggregate); to be paid on 19 March 2019

1. Outflows include settlement of select retained supplier and employee liabilities, GST related balances, advisor fees and        1H FY19 Interim Results
   redundancies, which were provided for at 1 July 2018 and reflected in the pro-forma net cash balance of $25 million disclosed
   at the full year FY18 results.
                                                                                                                                                       14
FINANCIAL POSITION

A$m                          31 Dec 17   1 Jul 18   30 Dec 18
                                                                • 30 December 2018 presents post-transaction
Cash and cash equivalents       27.7        28.9       35.5
                                                                  standalone balance sheet for CCX
Inventories                     81.9        15.8       15.2
Other                           11.3         4.2        6.0     • 1 July 2018 presents divested brands as held
                                                                  for sale and 31 December 2017 presents pre-
Assets held for sale               -      125.1           -
                                                                  transaction SFG group
Current Assets                 121.0      174.0        56.7
Property, plant, equipment      51.0         6.7        8.3     • Strong cash position of $35.5m and no debt
Intangibles                     24.0        10.1       12.0
                                                                • Declared interim and special dividend to be
Other                            8.6         5.3        7.3
                                                                  paid in March 2019; not recognised in
Non-current Assets              83.6        22.1       27.6       liabilities as at 30 December 2018
Total Assets                   204.6      196.1        84.3
                                                                • Debt facility fully repaid in July 2018 from
Trade and other payables       103.7        44.3       20.6       divestment proceeds; facility in place until
                                                                  February 2021 with $15m capacity
Provisions and Other            37.7         7.9       11.4
Liabilities held for sale          -        91.8          -     • Post 1 July 2018, transaction settlement and
Current liabilities            141.4      144.0        32.1       separation related payments are primary
Borrowings                       6.4        12.9          -
                                                                  drivers of the reduction in payables, as well as
                                                                  shortening of trade creditor terms whilst new
Provisions and Other            10.7         2.2        4.0       trade facility being implemented
Non-current Liabilities         17.1        15.1        4.0
Total Liabilities              158.5      159.0        36.1     • Ongoing discipline and control around
                                                                  inventory and buying
Net Assets                      46.0        37.1       48.2

                                                                                                    1H FY19 Interim Results

                                                                                                                        15
4

STRATEGY OVERVIEW
CAPITALISE ON DOMINANT ANZ MARKET POSITION

Significant opportunity to grow through lifestyle and range extensions, an expanded
footprint and enhancing all customer touchpoints

   • Women’s plus size apparel market in ANZ is estimated to be 1.0bn1; City Chic has ~10% share

   • Major growth opportunity in online, the most profitable channel
       – Lifestyle extensions to grow market share
       – Broader product range through online exclusives
       – Enhance customer experience – global website platform upgrade underway2

   • Accelerate new store roll-out program, focused on returns and payback
       – Identified 30 new locations with attractive demographics, supported by existing online sales
       – 5 stores opened in 1H FY19, additional new sites agreed for 2H FY19
       – Approximately 20 higher-performing stores earmarked for larger format; significantly improved
         in-store customer experience and strong economics

   • Enhance how we communicate with our customer
       – New email platform implementation underway3
       – Launching new CRM to enhance customer insights and predictive modelling

1. Based on IBISWorld Industry Report.                                                     1H FY19 Interim Results
2. Increased site speed, search engine optimisation (SEO) and conversion.
3. More targeted communications, behavioural learnings and customer journeys.
                                                                                                               17
CONTINUE TO GROW INTERNATIONAL PRESENCE

Exploring optimal growth avenues with a focus on owning the customer

  • Significant opportunity in North America and Europe: >$50bn women’s plus size apparel market1

      – Focused on initiatives that drive profitable growth

  • Priority is to grow City Chic website in the US, the most profitable channel in Northern Hemisphere

      – Targeted customer acquisition

      – Offer new lifestyles and broader range

      – Improve customer experience through global website enhancements and optimised fulfilment

  • Maintain high profile partners, which drive brand and product awareness

  • Exploring new disruptive retail models and collaboration opportunities

1. Estimate based on data from The NPD Group, PwC and Verdict.                             1H FY19 Interim Results

                                                                                                               18
FY19 OUTLOOK

• Positive comparable sales growth in early H2
  FY19, in line with expectations

• No change to capex guidance of $7m

• Significant growth runway in ANZ

• Continue driving profitable growth in the US

                                                 1H FY19 Interim Results

                                                                     19
APPENDIX
EARNINGS RECONCILIATION

                                                                  Continuing               Discontinued                Group

A$m                                                        1H18            1H19      1H18            1H19     1H18             1H19

Underlying EBITDA                                           13.0           15.8       5.4              -      18.5             15.8

Depreciation & amortisation                                 (1.2)          (1.0)     (12.5)               -   (13.7)           (1.0)

Underlying EBIT                                             11.8           14.8      (7.2)             -       4.7             14.8

Net Interest expense1                                       (1.0)              0.2     -                  -   (1.0)            0.2

Underlying NPBT                                             10.9           15.0      (7.2)             -       3.8             15.0

    Impairment of stores (closure)                            -                 -     2.4                 -    2.4               -

    Restructuring costs                                       -                 -    (1.8)                -   (1.8)              -

    Store exit costs                                          -                 -    (1.1)                -   (1.1)              -

    Employment incentive payments                             -                 -     1.4                 -    1.4               -

    Transition costs                                          -            (1.1)       -                  -     -              (1.1)

    Transaction-related adjustments                           -                 -      -              0.4       -              0.4

Underlying Adjustments                                        -            (1.1)      0.8             0.4      0.8             (0.7)

Reported NPBT                                               10.9           13.9      (6.3)            0.4      4.6             14.3

Taxation                                                                   (4.0)                     (0.1)    (1.5)            (4.2)

Reported NPAT                                                                  9.9                    0.3      3.1             10.1

1. Group net interest expense allocated to continuing operations.                                                1H FY19 Interim Results

                                                                                                                                       21
IMPORTANT NOTICE &
DISCLAIMER
This presentation has been prepared by City Chic Collective
Limited (the “Company”). It contains general background
information about the Company’s activities current as at the
date of the presentation. It is information given in summary form
and does not purport to be complete. The distribution of this
presentation in jurisdictions outside Australia may be restricted
by law and you should observe any such restrictions.

The Company has prepared this presentation based on
information available to it, including information derived from
publicly available sources that have not been independently
verified. No representation or warranty, express or implied, is
made as to the fairness, accuracy, completeness, correctness
or reliability of the information, opinions and conclusions
expressed.

Any statements or assumptions in this presentation as to future
matters may prove to be incorrect and differences may be
material. This presentation should not be relied upon as a
recommendation or forecast by the Company. To the
maximum extent permitted by law, none of the Company, its
directors, employees or agents, nor any other person accepts
any liability, including, without limitation, any liability arising from
fault or negligence on the part of any of them or any other
person, for any loss arising from the use of this presentation or its
contents or otherwise arising in connection with it.

                                                                           1H FY19 Interim Results
You can also read