2 ENERGY IN NEW ZEALAND - MBIE
←
→
Page content transcription
If your browser does not render page correctly, please read the page content below
MARKETS – EVIDENCE AND INSIGHTS BRANCH ENERGY IN NEW ZEALAND 2 2020 CALENDAR YEAR Comprehensive information on and analysis of New Zealand’s energy supply, demand and prices
Ministry of Business, Innovation and Employment (MBIE)
Hīkina Whakatutuki - Lifting to make successful
MBIE develops and delivers policy, services, advice and regulation to support economic growth
and the prosperity and wellbeing of New Zealanders.
MBIE combines the former Ministries of Economic Development, Science + Innovation,
and the Departments of Labour, and Building and Housing.

Energy in New Zealand 2021 provides annual information on and analysis of New Zealand’s energy
sector and is part of the suite of publications produced by the Markets team of the Ministry of
Business, Innovation & Employment (MBIE).

The 2021 edition includes information up to the end of the calendar year 2020.

Full data tables may be downloaded from the Energy in New Zealand webpage:

www.mbie.govt.nz/building-and-energy/energy-and-natural-resources/energy-statistics-and-
modelling/energy-publications-and-technical-papers/energy-in-new-zealand/

More information
www.mbie.govt.nz                                           Information, examples and answers to your questions
                                                           about the topics covered here can be found on our website
0800 20 90 20                                              www.mbie.govt.nz or by calling us free on 0800 20 90 20.

Disclaimer
This document is a guide only. It should not be used as a substitute
for legislation or legal advice. The Ministry of Business, Innovation and
Employment is not responsible for the results of any actions taken on the
basis of information in this document, or for any errors or omissions.

Print: ISSN 2537-9372                   Online: ISSN 2324-5913
August 2021

©Crown Copyright

The material contained in this report is subject to Crown copyright protection unless otherwise indicated.
The Crown copyright protected material may be reproduced free of charge in any format or media without
requiring specific permission. This is subject to the material being reproduced accurately and not being used
in a derogatory manner or in a misleading context. Where the material is being published or issued to others,
the source and copyright status should be acknowledged. The permission to reproduce Crown copyright
protected material does not extend to any material in this report that is identified as being the copyright
of a third party. Authorisation to reproduce such material should be obtained from the copyright holders.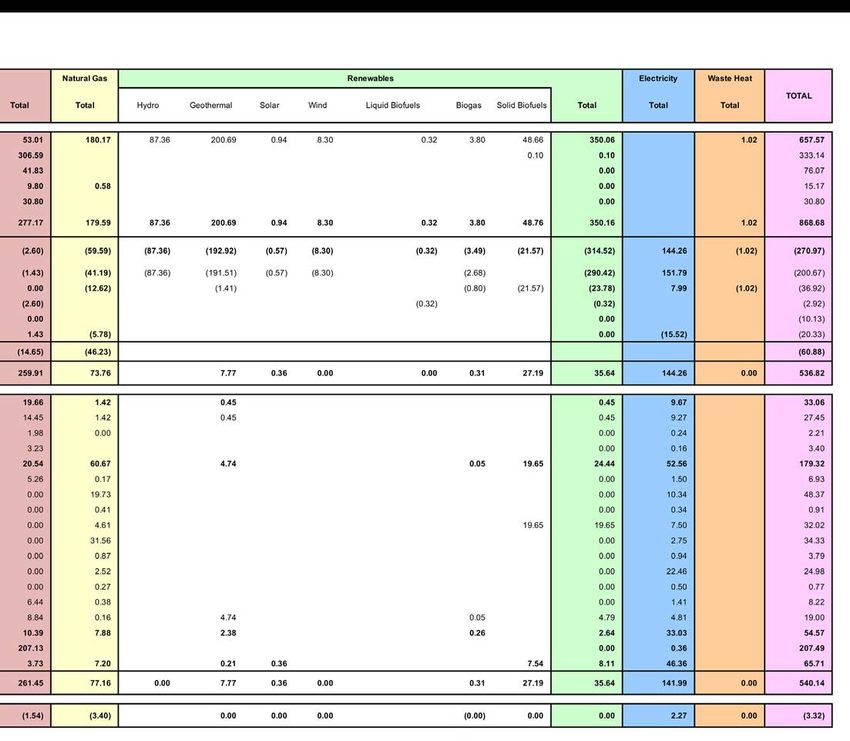
Contents
A Energy B Energy
Overview Balances
PAGE PAGE 7
C Impacts of D Electricity
COVID-19
PAGE 12 PAGE 20
E Renewables F Oil and
Gas
PAGE 31 PAGE 39
G Coal H Special
Feature: Future
Energy Trends
PAGE 56 PAGE 62
J Glossary J Methodological
Improvements
PAGE 73 PAGE 76
*All statistics are year-ending annual measures.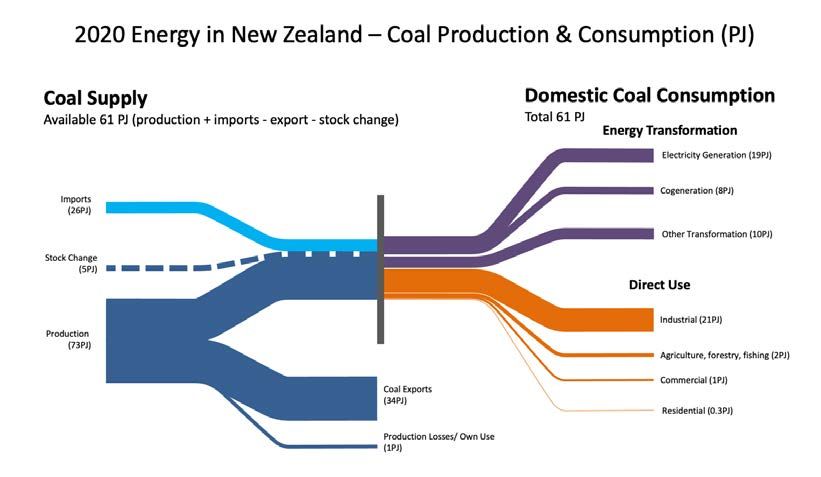
MINISTRY OF BUSINESS, INNOVATION AND EMPLOYMENT                     ENERGY IN NEW ZEALAND 2021

Quick facts for 2020

     Energy consumption in the                                     Our modern
     June quarter 2020 was at the                                  renewable
                                                                   energy share is
     lowest quarterly level since
                   the September
                   quarter 1999                                    27.9%
                                                                   (or 27.9% of our
                                                                   energy demand
                                                                   is renewable)

   Prior to 2020,                                 We have enough gas reserves
   national energy                                to last us until

                                                  2030
   consumption was
   growing an average
   of 1.4% per year

      International Jet fuel                      Combined
      consumption down                            wind and solar
                                                  generation
      59%                                         reached its
                                                  highest
      for 2020 compared to 2019
                                                  ever level.

                                                            New Zealand’s annual
      Residential energy                                    primary energy
      use was the highest                                   supply would supply
      it’s been since 2009                                  Australia for about

                                                                59
                                                                   days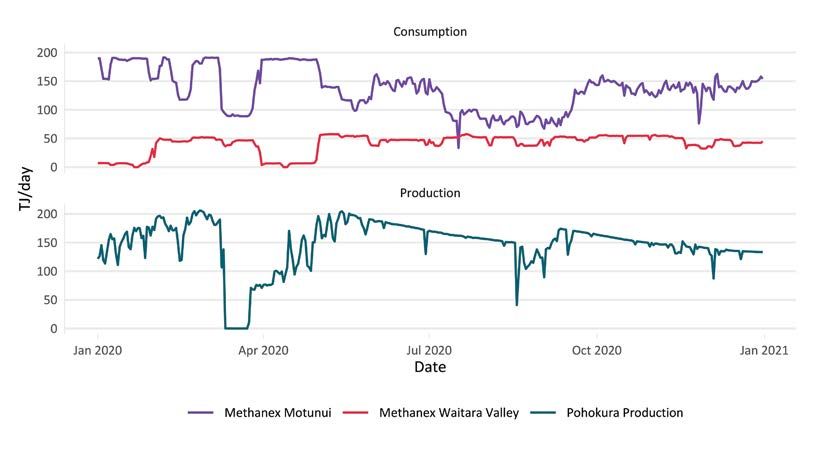
A: Energy Overview
The 2020 calendar year saw disruption to economic activity in New
Zealand, with the impacts of the coronavirus (COVID-19) pandemic
being felt by the energy sector throughout the year and well into
2021. This saw changes to the supply and demand of energy in New
Zealand, with several large energy users citing the pandemic as one
of the factors in initiating strategic reviews of their businesses. For
more detailed analysis on the impact of the COVID-19 pandemic on the
energy sector, see chapter C.

Other developments during the year saw an additional 226 megawatts
of electricity generation capacity commissioned. The government also
launched several initiatives to help lift households and whānau out
of energy hardship, and to support businesses in transitioning to low
emissions fuels.
MINISTRY OF BUSINESS, INNOVATION AND EMPLOYMENT                                             ENERGY IN NEW ZEALAND 2021

2
    Energy consumption at lowest level in seven years
    Restrictions on activities and movement as part of the response to the COVID-19 pandemic impacted
    global economic activity. This saw national energy consumption fall 7.4 per cent to its lowest level
    since 2013, with the largest reductions seen in the industrial sector and in transport use. This fall
    in demand is a contrast to the trend over 1990 to 2019, where sustained increases in energy use for
    transport led to national energy consumption growing an average of 1.4 per cent per year.

    Figure A.1 Energy consumption by sector

    After remaining relatively steady in recent years, energy use by the industrial sector fell 10 per cent
    from 2019 levels as only essential businesses were able to operate under Alert Level 4.1 While the
    majority of industrial sector demand recovered following the lifting of these restrictions, some
    industries saw reduced energy use for the remainder of the year. As a result of the pandemic, New
    Zealand Aluminium Smelters (NZAS), the country’s largest electricity user, closed it’s fourth potline
    (after restarting it in 2018). As at the time of writing, the fourth potline had not been restarted.
    Production at Pohokura, the country’s largest natural gas field, declined relative to 2019. This was
    after it had returned to near normal production levels in 2019, since it had experienced outages in
    2018 (see figure F.21 in the Oil and Gas chapter). These supply constrains at Pohokura saw Methanex
    (one of the country’s largest natural gas users) reduce their activity and therefore energy use.
    Restrictions on travel both within and across regions led to lower transport activity. As the majority
    of energy used for domestic transport in New Zealand is from oil products, this saw demand for oil
    products fall 8.8 per cent from 2019 levels. The largest reductions were seen in petrol use (down 11
    per cent) and use of fuels for domestic aviation (down 31 per cent).

    1 Under Alert Level 4, people were required to stay at home unless for essential movement. Travel was also
    severely limited, with only essential businesses (such as supermarkets and petrol stations) allowed to operate.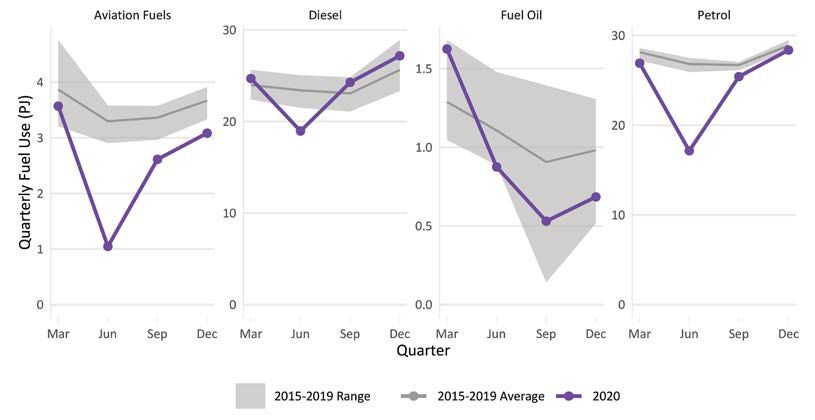
MINISTRY OF BUSINESS, INNOVATION AND EMPLOYMENT                                          ENERGY IN NEW ZEALAND 2020

                                                                                                                      3
Intensity metrics show improvements
Energy intensity provides an indication of the relationship between energy use and economic
growth. It is calculated as energy use divided by gross domestic product (GDP) and tells us the
amount of energy required to produce each dollar of GDP. A fall in the indicator, where less energy is
required to produce each dollar of GDP, is considered an improvement. Energy intensity improved in
2020, with the national average energy intensity indicator falling 4.6 per cent in 2020. Prior to 2020,
national average energy intensity had been improving (falling) on an average of 1.4 per cent per
annum since 1990. This growth had been driven by continued economic growth in the commercial
sector, which is relatively less energy intensive than other parts of the economy as it is service-
based.
Stats NZ produces a measure of emissions intensity. This is calculated as greenhouse gas emissions
produced by households and businesses divided by GDP, and tells us how many emissions are
produced with each unit of output. Like energy intensity, a fall in the indicator (where less emissions
are produced per dollar of GDP) is considered an improvement. Over 2007 to 2019, New Zealand’s
emissions intensity improved on an average of 2.1 per cent per annum.2,3 This aligns with the trend
seen in energy intensity.

COVID impact lowers exports and imports
New Zealand is unable to meet all of its energy needs with domestic production. This can be for
a range of reasons, but means that New Zealand has to engage in trade through exporting and
importing.
Nearly all of the crude oil produced in New Zealand is exported because it is not suited to our current
refining capabilities. This means that all domestic use of oil needs to be met by imports. Reduced
transport demand and changes in the mix of transport activity (most significantly lower aviation use)
in 2020 reduced the need for the country’s only oil refinery at Marsden Point to refine crude oil into
oil products. This drove a 15 per cent fall in the import of crude oil and oil products, with the month
of July 2020 seeing no crude oil imports for the first time in 34 years. In future there is expected
to be a substantial change in the mix of New Zealand’s oil imports, with Refining NZ launching a
strategic review of its operations in 2020 with a view to ceasing oil refining activities and switching
to operating as an import-only terminal.
Under Alert Level 4, mines producing coal for the export market had to temporarily close. This
drove a reduction in coal exports in 2020, down 22 per cent from 2019. This fall, alongside lower oil
production due to natural decline in existing fields, saw total energy exports fall 24 per cent in 2020,
to the lowest level since 1992.
Self-sufficiency is a measure of a country’s ability to meet its own energy supply requirements. A
self-sufficiency value of 100 per cent indicates that a country produces all the energy it needs, while
values above or below indicate whether a country is a net exporter (above) or importer (below) of
energy. National average self-sufficiency for New Zealand increased from 75.2 per cent in 2019 to
75.7 per cent in 2020 as a result of lower domestic production.

2 https://www.stats.govt.nz/information-releases/greenhouse-gas-emissions-industry-and-household-year-
ended-2019
3 Data is available to 2019 as this is the latest year of data in the New Zealand Greenhouse Gas Inventory.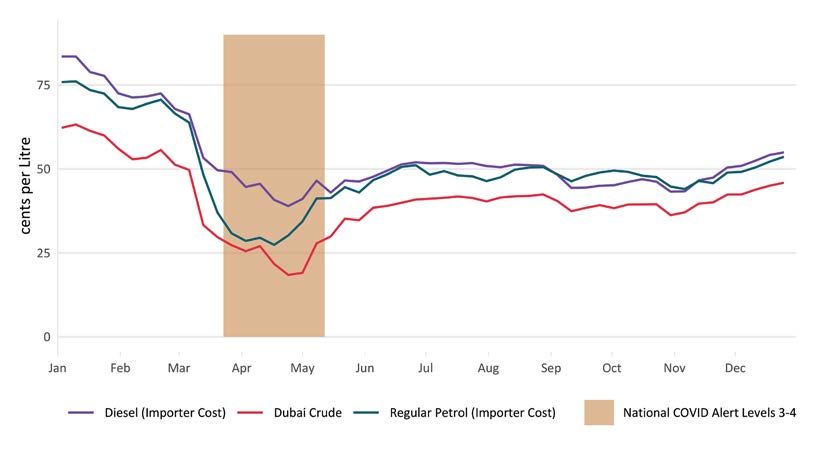
MINISTRY OF BUSINESS, INNOVATION AND EMPLOYMENT                                             ENERGY IN NEW ZEALAND 2021

4
    Share of energy supply from renewable sources hits a high of 40%
    Energy supply fell in 2020 as lower domestic consumption reduced the amount of energy needed
    to meet demand. Primary energy supply of both renewables and non-renewables fell in 2020, with
    a larger fall seen in the supply of non-renewables. This coupled with lower production of coal and
    crude oil saw domestic energy production fall to its lowest level since 2007.
    Overall the share of renewables in total primary energy supply rose from 39.4 per cent in 2019
    to 40.3 per cent in 2020. In this edition of Energy in New Zealand, MBIE has added the share of
    renewables in total final energy consumption (TFEC) to its suite of energy indicators. The details of
    measuring the renewable share of TFEC can be found in Box A.1. The share of renewables in TFEC rose
    from 27.4 per cent in 2019 to 27.9 per cent in 2020.

    The share of modern renewables in total final consumption
    International agencies are now employing a more narrow definition of renewables called ‘modern
    renewables’ to aid comparisons across countries. This change does not affect New Zealand’s share,
    though it will affect other countries and hence our relative ranking.
    MBIE has added the share of modern renewables in total final energy consumption to its suite of
    energy indicators in order to provide a more comprehensive view of the use of renewable energy
    sources across New Zealand’s energy system.
    When viewed in comparison to international data, this will cause the share of modern renewables
    for Less Economically Developed Countries (LEDC) to be less than their original share of renewables
    in total final consumption. For More Economically Developed Countries, their share of modern
    renewables in total final consumption will remain the same as their original share of renewables
    in total final consumption. This difference is a result of changing traditional biomass from being a
    renewable fuel type, to a fossil fuel in LEDC data. This is to aid in international comparisons. You can
    see the effect of this new indicator on renewable shares below:4

    Figure A.2 Comparison of different Renewable shares of consumption for different countries
    in the world

    4 This is based off data for 2017 from the IEA and the United Nations. The New Zealand value has been revised to
    match the 2020 values.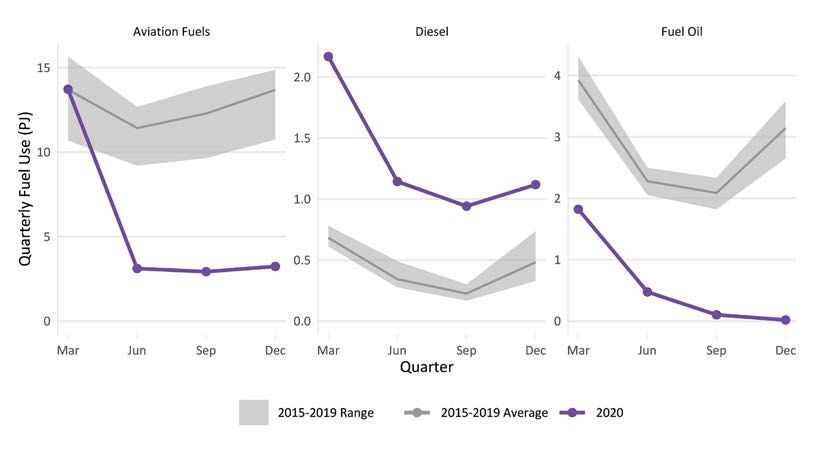
MINISTRY OF BUSINESS, INNOVATION AND EMPLOYMENT                                        ENERGY IN NEW ZEALAND 2020

                                                                                                                    5

        Box A.1        Measuring the share of modern renewables
                       in total final consumption

    There are three indicators that are often used for measuring the renewable share of energy:
    ›    Renewable share of total primary energy supply (TPES), which tells us the share of energy
         available for use in New Zealand that is from renewable sources
    ›    Renewable share of electricity generation, which tells us the share of electricity that is
         generated from renewable sources
    ›    Share of renewables in total final energy consumption (TFEC), which tells us the share
         of energy consumed by end-users (such as businesses and households) that is from
         renewable sources
    The first two measures, looking at TPES and electricity generation, are most commonly used
    internationally as they are relatively easy to measure due to their focus on the supply-side.
    They are also internationally comparable, meaning that we can easily compare the shares for
    New Zealand with other countries.
    However there are some drawbacks with using a renewable share of TPES and these
    drawbacks can have opposite effects on the measure. Most notably:
    ›    The conversion efficiency of geothermal energy to electricity is relatively low. This will
         lead to a renewable share based on TPES overstating the true extent of renewable energy
         available for use in an economy, as a relatively low amount of this geothermal energy is
         ultimately converted to useful energy.
    ›    TPES includes use of non-energy use of fossil fuels. ‘Non-energy use’ refers to use of
         fuels for purposes other than combustion, such as the use of natural gas as a chemical
         feedstock in in the production of methanol and ammonia/urea. The inclusion of supply
         of fuels to non-energy use in TPES will overstate the use of non-renewable fuels in an
         economy, reducing the renewable share of TPES.
    Conversely, there is value in considering a TPES measure as the inclusion of non-energy
    use of fossil fuels shows that there are competing uses for New Zealand’s energy supply.
    For example, natural gas could be used for electricity generation, by businesses for
    their production processes (such as drying milk powder), or as a feedstock for methanol
    production.
    In recent years, there has been a growing focus on increasing the use of renewable energy
    sources, as seen with the United Nation’s Sustainable Development Goals (SDG).5 SDG Goal 7
    to ‘ensure access to affordable, reliable, sustainable and modern energy for all’ has a target
    to increase the share of renewable energy globally by 2030. The United Nations has chosen
    the renewable share of TFEC to be the progress indicator for to this target, rather than a TPES
    based measure.
    Renewable energy can be classified as ‘modern’ or ‘traditional’. ‘Traditional biomass’ refers to
    the use of these energy types for heating and cooking by households in developing countries,
    while ‘modern renewables’ is total renewable energy use less any traditional biomass
    use. The wide use of traditional biomass can lead to some developing countries having a
    renewable share of TFEC that is close to 100 per cent, far higher than any developed country.
    As such, a common approach is to consider the share of ‘modern renewables’ in TFEC, rather
    than the share of all renewables, in order to account for the differences in the circumstances

    5 https://sdgs.un.org/goals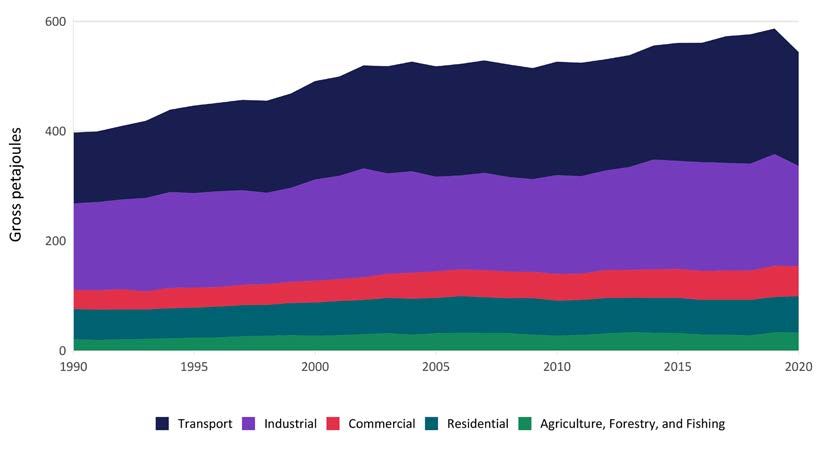
MINISTRY OF BUSINESS, INNOVATION AND EMPLOYMENT ENERGY IN NEW ZEALAND 2021
6
in individual countries and to support international comparability. For developed countries,
all biomass use is assumed to be ‘modern’, while for developing countries only the portion of
energy use that is not used by households is considered to be ‘modern.’
MBIE has added the share of modern renewables in TFEC to its suite of energy indicators in order
to provide a more comprehensive view of the use of renewable energy sources across New
Zealand’s energy system. In 2020 the value was 27.9 per cent. This indicator is calculated as:
Share of modern (Direct use of modern renewables+Electricity use allocated to renewables)
=
renewables in TFEC (Total TFEC)
where:
› Direct use of modern renewables is the use of modern renewable energy by end-users
without it first going through a transformation process (e.g. electricity generation), such
as using geothermal energy for heating greenhouses.
› Electricity use allocated to renewables is calculated by applying the renewable electricity
generation share to final consumption of electricity, to give an estimate of the amount of
electricity consumed that is from renewable sources
Prior to 2005, the share of modern renewables in TFEC and the renewable share of TPES
tracked closely together. Since then, the use of geothermal for baseload electricity
generation has grown. With a relatively low conversion efficiency of geothermal energy to
electricity, this has contributed to the growth in renewable TPES, without similar growth in
TFEC. This has resulted in the two measures diverging in recent years, with a 12.4percentage
point difference between the two measures in 2020.
Box A.1 Figure 1 Comparison of renewable share measures
It is important to note that a renewable share of TFEC indicator does not account for
electricity losses. The renewable electricity generation share is calculated as at the point
of generation and is applied to consumption of electricity on the assumption that the
mix stays the same across all use. That is, it is calculated before the electricity has been
conveyed on the national grid and/or local distribution networks to end-users (eg. businesses
and households). Losses occur in the process of conveying electricity from the point of
generation to end-users due to a range of factors, such as the length and size of power lines.
In 2020, transmission and distribution losses in New Zealand accounted for 6.9 per cent of
electricity supply. The existence of these losses means that the mix of electricity reaching
end-users will not match what is entering the system. In constructing the renewable share
of TFEC as outlined above, the assumption is made that mix of electricity stays the same
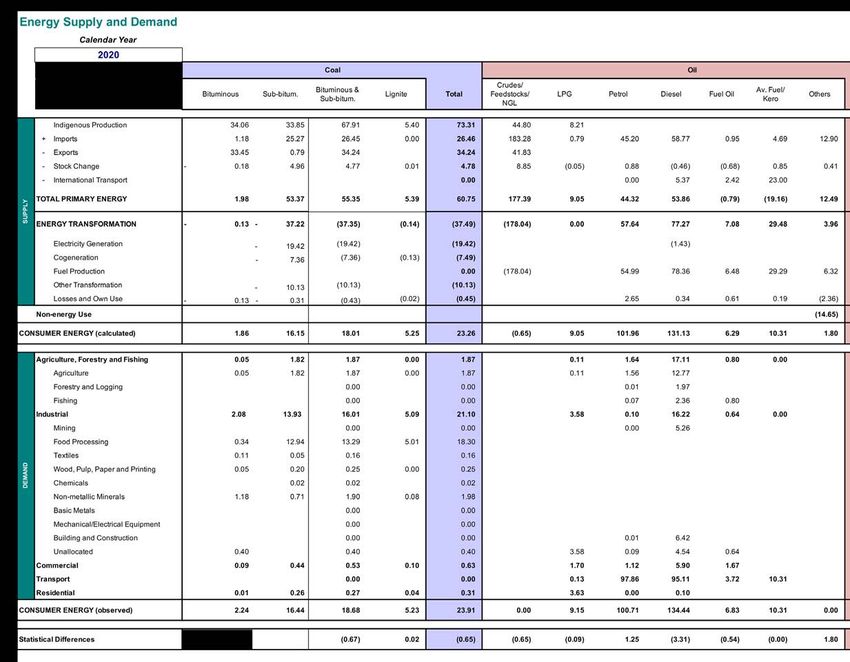
throughout the system and across all use.B: Energy balances New Zealand’s energy production derives from both renewable and non-renewable sources. New Zealand imports and exports fossil fuels, which generate export revenue, but also results in a dependency and vulnerability to energy commodity prices that vary according to international supply and demand factors outside of New Zealand’s control. The energy balance tables reflect how energy supply and demand by sector varies by energy fuel type. Domestic energy supply is derived from either indigenous production or imported from overseas sources. In turn, fuel types can be transformed into different forms of energy, at the cost of losses and inefficiencies which vary by transformation process. Supply, demand, losses and inefficiencies are reflected in balanced energy supply and demand tables. Both the energy supply and demand dimensions of the energy balance tables are derived from surveys spanning different sources. An imbalance exists between the value of consumer energy calculated from supply, and the value of consumer energy observed from statistical measure.
MINISTRY OF BUSINESS, INNOVATION AND EMPLOYMENT                                             ENERGY IN NEW ZEALAND 2021

8
    Interpretation of Energy Balance Tables
    Supply
    Total primary energy is the amount of energy available for use in New Zealand. Much of it is
    converted into other forms of energy before it is used. By convention, fuel used for international
    transport is excluded from total primary energy. Indigenous gas production does not include gas that
    is flared, reinjected, or LPG extracted. The primary energy figures presented are actual data, except
    for some that go into electricity generation as detailed under energy transformation.

    Energy transformation
    Includes generation of electricity (including cogeneration), oil production (including refinery
    operations and the manufacture of synthetic fuel from natural gas – Methanex ceased methanol to
    petrol production in April 1999) and other transformation, primarily steel production.

    Table B.1 Default Electrical Transformation Factors6

     Fuel                          Default Efficiency
     Biogas                                           30%
     Coal                                             30%
     Gas (Single Cycle)                               30%
     Geothermal                                       15%
     Hydro                                        100%
     Oil                                              30%
     Waste Heat                                       15%
     Wind                                         100%
     Wood                                             25%

    In the Energy Transformation section of the balance tables, “energy in” is shown as negative values
    and “energy out” as positive values in the appropriate fuel columns. Transformation of energy
    from one form to another always results in conversion losses, particularly in thermal electricity
    generation, as much energy is lost as heat.
    Transformation losses in electricity generation are derived from the net electricity generated, with
    the actual fuel input being used where available and the conversion factors shown in Table B.1 used
    otherwise. Fuel input to biogas, hydro, wind and waste heat are fully estimated. Quarterly figures for
    electricity generation are made up of actual data from major generators and the Electricity Authority.
    Estimates are made where actual data are unavailable at the time of publishing.
    Liquid biofuel production (bioethanol and biodiesel) appears as renewable energy supply in the energy
    balance tables. As bioethanol and biodiesel are generally blended with motor petrol and diesel before
    consumption, liquid biofuel also appears in Energy Transformation under Fuel Production.
    Losses and own use in the energy balances include losses before and after transformation, losses
    and own use in production, transmission and distribution losses, electricity industry own use free
    of charge, and oil industry losses and own use (which includes distribution tankage losses, stocks,
    accounts adjustment and own consumption). Transformation losses are excluded.
    Non-energy use is primary energy used for purposes other than combustion, e.g. bitumen used in
    road construction, and natural gas used as chemical feedstock in the production of methanol and
    ammonia/urea.

    6 a) Default efficiencies are only used where real data is unavailable. b) For combined cycle plants, the assumed
    efficiency is 55%. Currently, however, actual fuel input data are collected for all combined cycle plants.
    c) Geothermal is predominantly based on real plant steam data and uses a 15% efficiency where these are unavailable
MINISTRY OF BUSINESS, INNOVATION AND EMPLOYMENT ENERGY IN NEW ZEALAND 2020
9
Treatment of Solar Photovoltaic Panels
Estimates of the amount of electricity generated using solar photovoltaics (PV) are included in the
energy balance tables in this edition of Energy in New Zealand. The total primary energy supply
of solar is the sum of the direct use of solar thermal (i.e. for hot water heating), and the amount
of solar energy directly converted into electricity via PV panels. Solar PV electricity generation is
estimated using data on the total installed capacity of grid-connected solar PV installations in New
Zealand , and then converted to output using an assumed annual capacity factor of 14% (i.e. the solar
panels produce their full output 14% of the time). The capacity factor is then scaled using solar-hour
data from NIWA to introduce seasonal variation. Consumption of solar thermal is included in the
demand section of the energy balance table under Renewables – Solar, whereas the consumption of
electricity generated by solar PV panels appears under Electricity. Solar PV consumption by sector is
apportioned using data from the Electricity Authority.
Demand
Consumer energy is the amount of energy consumed by final users. It excludes energy used or
lost in the process of transforming energy into other forms and in bringing the energy to the final
consumers. For example, natural gas is a primary energy source (see Total Primary Energy Supply),
some of which is transformed into electricity, of which some is lost in transmission to consumers.
Consumer energy statistics can be either calculated from supply-side data or observed from usage
data.
Consumer energy (calculated) forms the top half of the energy balance tables and is calculated as
TPES less energy transformation less non-energy use.
Consumer energy (observed) forms the bottom half of the energy balance tables and it represents
reported demand in the agriculture, forestry and fishing; industrial; commercial; transport and
residential sectors. With the exception of domestic/national use of energy for on-road, rail, sea
and air transport in the transport sector, these sectors follow the Australia New Zealand Standard
Industrial Classification 2006 definitions.
Annual figures presented for consumer energy (observed) are actual data except for thermal fuels
used for cogeneration in the industrial and commercial sectors and biogas, wastes and wood.
Estimates of on-site cogeneration demand are included in electricity end use.
Where the energy end-use is not available or confidential, the “unallocated” category is used.
International transport includes international sea and air transport. It excludes coastal shipping,
national air transport and all land transport.
Statistical differences shows the difference between “consumer energy (calculated)” and
“consumer energy (observed)”. This difference is shown at the bottom of the energy balance tables.MINISTRY OF BUSINESS, INNOVATION AND EMPLOYMENT ENERGY IN NEW ZEALAND 2021 10
MINISTRY OF BUSINESS, INNOVATION AND EMPLOYMENT   ENERGY IN NEW ZEALAND 2020

                                                                               11
C: Impacts of COVID-19 On 30th January 2020, the World Health Organisation declared a Public Health Emergency of International Concern over the outbreak of a novel coronavirus (COVID-19). On February 28th, 2020, the first case of COVID-19 was detected in New Zealand. This led to the New Zealand Government establishing the COVID-19 Alert System on 21st March 2020, followed by the alert level being increased to Level 4 on 23rd March, 2020. For the remainder of the year, New Zealand moved between Alert Levels 1 through 4, as the risk of community transmission changed. It is impossible to look at energy use in New Zealand in 2020 without considering the effect COVID-19 had on New Zealand’s society and economy. This section considers the larger effects the pandemic had on energy supply and demand in New Zealand.
MINISTRY OF BUSINESS, INNOVATION AND EMPLOYMENT                                     ENERGY IN NEW ZEALAND 2020

Figure C.1 COVID Alert Levels 2020                                                                               13

        Box C.1        Box F.1: Other notable events of 2020

    While COVID-19 may have been the largest single news story of 2020, there were other major events
    in New Zealand that impacted energy production and consumption that might interest you.
    Here are some of the major events you can read about in other chapters:
    ›   In Electricity: Several new electricity plants were commissioned, while others were delayed
        due to COVID-19.
    ›   In Oil and Gas: Refining NZ announced a strategic review of the Marsden Point oil refinery.
    ›   In Renewables: Developments within the renewable energy space, including projects and
        announcements related to hydrogen, biofuels, solar and super-critical geothermal
MINISTRY OF BUSINESS, INNOVATION AND EMPLOYMENT ENERGY IN NEW ZEALAND 2021
14
Transport consumption dropped sharply
Figure C.2: Fuel Consumption for International Transport
Energy used for international transport fell by 39.6 PJ (56 per cent) in 2020. The largest percentage
drop in international transport use prior to 2020 was a 19 per cent drop in 1980, following the 1979
Oil Crisis. The bulk of the drop occurred in the June quarter 2020, where total use fell by 10.5 PJ on
June 2019 (69 per cent). This is consistent with the implementation of the alert level system, fuels
used by aviation dropped more than marine transport. Aviation fuels fell by 33.5 PJ (59 per cent) in
2020, while marine fuels (diesel and fuel oil) fell by 6.1 PJ (44 per cent) in the same period. Note that
diesel used in marine transportation actually increased by 3.5 PJ (182 per cent) compared to 2020,
suggesting that diesel was being substituted for fuel oil. The substitution between fuels may be
COVID-19 related, but is also likely to be a result of the new MARPOL Annex VI rules for international
shipping.7
7 Effective 1 January 2020, the maximum sulphur content for fuel oil in shipping was lowered to 0.5% from 3.5%.
While New Zealand is not yet a signatory to this requirement (the relevant legislation is being considered by Select
Committee at time of publication), the regulations apply based on where a ship is registered, meaning that ships
visiting New Zealand would be affected if they were registered with a signatory country.MINISTRY OF BUSINESS, INNOVATION AND EMPLOYMENT ENERGY IN NEW ZEALAND 2020 Figure C.3 Fuel Consumption for Domestic Transport 15 The fall in domestic transport fuel use was not as large, though still unprecedented. Across all fuels, domestic transport use fell 21 PJ (9.4 per cent). The largest previous percentage drop in domestic transport use since 1990 was a 2.5 per cent reduction in 2012. Among all fuel types, the largest percentage fall was seen in aviation fuels (31 per cent), followed by fuel oil (17 per cent) and petrol (12 per cent). For most fuels, the quarter with the sharpest decrease was June, in line with the period with the highest alert level. A notable exception is fuel oil, which fell more sharply in the year ending September (46 per cent) than the year ending June (22 per cent). These decreases in fuel oil are matched by increases in diesel use in the September and December quarters, which suggests there may have been substitution between fuel oil and diesel, though the variability in fuel oil consumption makes this less clear than for international transport. Falling global oil demand led to lower retail prices Figure C.4 Fuel Importer Cost 2020
MINISTRY OF BUSINESS, INNOVATION AND EMPLOYMENT ENERGY IN NEW ZEALAND 2021
16 In early 2020, crude oil prices had already started to fall due to geopolitical factors (the Dubai Crude8
price fell 25 per cent between January 3rd and March 6th 2020), but the drop in price became even
more pronounced in early March as many countries started implementing travel and business
restrictions in response to COVID-19. This led to a global reduction in oil demand, and the Dubai
Crude Price fell another 65 per cent between March 6th and April 24th 2020, when it reached its
lowest point of USD 17.55 per barrel.
One factor slightly offsetting some of the fall in international crude prices, was higher shipping rates
for importing crude to New Zealand. As international demand plummeted, refinery activity dwindled
and inventories of product soared. Some tankers were simply converted to floating storage vessels
and this saw shipping rates climb dramatically for a short spell.
Domestic demand for crude fell during this period as well, sharply enough that Z Energy cancelled a
crude oil tanker due to reduced production at the refinery.
Importer costs for petrol and diesel followed a similar trend as the falling international demand and
cheap crude made these products cheaper to buy. Regular petrol importer costs fell from $0.76/L at
the start of 2020, to a low of $0.27/L in mid-April. While importer costs increased over the course of
the year, they did not return to March 2020 levels during the year.
Importer costs for diesel over 2020 were less impacted, but followed a similar course, falling from
$0.84/L on January 3rd 2020 to a low of $0.39/L on April 24th.
Coal production was disrupted by heightened alert levels
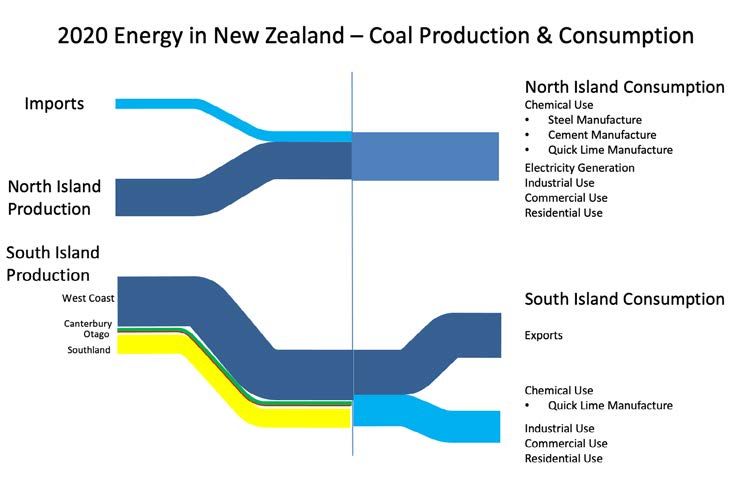
Figure C.5 Coal Production
Coal production for export was not categorised as an essential activity under Alert Levels 3 and
4. COVID-19 mitigation measures under Alert Level 2 for export coal and alert levels 2, 3 and 4 for
domestic production acted as an impediment to production. This, combined with the difficulty of
finding export ships during the pandemic, led to coal production being much lower during the June
and September quarters than the same quarters in the preceding five years. Coal production fell
23 per cent over the year ending June 2020, and 10 per cent over the year ending September 2020.
Production only fell 2 per cent over the year ending December 2020, indicating that coal production
had largely returned to trend by the end of the year.
The drop in production also affected exports – coal exports fell 23 per cent and 12 per cent in the
years ending June and September 2020, respectively.
8 Historically, New Zealand has imported most of its crude oil from the Middle East. This means that the Dubai Crude
price is a better reflection of importing crude to New Zealand than a European crude price like the Brent Oil price.MINISTRY OF BUSINESS, INNOVATION AND EMPLOYMENT ENERGY IN NEW ZEALAND 2020
17
Essential industry status affected industrial energy use
Figure C.6 Industrial energy use
Building and Construction Chemical Products Food Processing
15
2 9
10
6
1
5
3
0 0 0
Metal Product manufacturing Mining (not coal) Textile, Leather, Clothing and Footwear
2.0
6 0.3
Quarterly Energy Use (PJ)
1.5
4 0.2
1.0
2 0.1
0.5
0 0.0 0.0
Transport, Mechanical and Electrical Equipment Unallocated Industrial Wood, Pulp, Paper and Printing
6
9
0.2
4 6
0.1
2 3
0.0 0 0
Mar Jun Sep Dec Mar Jun Sep Dec Mar Jun Sep Dec
Quarter
2015-2019 Range 2015-2019 Average 2020 Essential 2020 Non-Essential
The main driver of whether COVID-19 affected energy use for each industrial sector was dependent
on whether the industry had much of its activity classified as essential or not.
Non-essential industries show a substantial annual decrease in consumption in the June quarter
2020, typically followed by lesser annual decreases in September and December 2020. Industries
that exhibited this reduced fuel use pattern included (for year ending June 2020):
› Textiles and Clothing (39 per cent)
› Wood, Pulp, Paper and Printing (34 per cent)
› Building and Construction (27 per cent)
› Mining (17 per cent)
› Metal Product Manufacturing (10 per cent)
› Unallocated Industrial (8.0 per cent), though this category dropped more sharply in September 2020.
By contrast, the Chemical and Food Processing industries did not exhibit this pattern – as these
industries contained a significant number of essential businesses, their activity was not affected by
the Alert Level.MINISTRY OF BUSINESS, INNOVATION AND EMPLOYMENT ENERGY IN NEW ZEALAND 2021
18
People staying at home increased residential energy consumption
Figure C.7 Commercial and Residential Electricity and Gas use
Commercial Residential
12
Quarterly Electricty and Gas Use (PJ)
15
8
10
4 5
0 0
Mar Jun Sep Dec Mar Jun Sep Dec
Quarter
2015-2019 Range 2015-2019 Average 2020
The COVID-19 alert level restrictions were most stringent in the June quarter, with the September
quarter being the second-most stringent. More than 40 percent of employed people did at least
some of their work from home during the lockdown at COVID-19 alert Levels 4 and 3 in April and early
May.9
This effect can be seen in the energy consumption patterns of natural gas and electricity, the two
largest energy sources for commercial use. While the March 2020 quarter showed residential and
commercial consumption in line with a normal March quarter, subsequent quarters showed higher
than normal residential consumption balanced by lower than usual commercial consumption.
Commercial electricity and gas consumption fell by 1.9 PJ (4.4 per cent) from 2019 to 2020, while
residential consumption increased by 1.2 PJ (2.3 per cent). It is unusual for commercial and residential
electricity and gas consumption to move in opposite directions, especially by more than 1 per cent.
The last time that residential use increased by more than 1 percent and commercial fell by more than
1 per cent (or vice versa) was 2005.
9 https://www.stats.govt.nz/news/four-in-10-employed-new-zealanders-work-from-home-during-lockdownMINISTRY OF BUSINESS, INNOVATION AND EMPLOYMENT ENERGY IN NEW ZEALAND 2020
19
Box C.2 Other Sources of COVID-19 Information
There are a number of sources outside this chapter that can provide additional information
on energy as it relates to COVID-19:
› The other chapters in Energy in New Zealand will provide additional insights for those
energy types.
› MBIE’s Energy Statistics and Modelling10 provides a range of energy data on a quarterly,
monthly or even weekly basis, providing the latest information on energy production,
transformation and consumption.
› Statistics New Zealand also produces a range of high-frequency economic data in their
COVID-19 Data Portal.11 Data on international and domestic travel, electricity demand and
gas consumption may be of particular interest.
10 https://www.mbie.govt.nz/building-and-energy/energy-and-natural-resources/energy-statistics-and-
modelling/
11 https://www.stats.govt.nz/experimental/covid-19-data-portalD: Electricity
MINISTRY OF BUSINESS, INNOVATION AND EMPLOYMENT                                                              ENERGY IN NEW ZEALAND 2020

                                                                                                                                                 21
Supply
Low hydro lake inflows led to a drop in renewable generation
Electricity generation was 1.4 per cent lower than in 2019. This is the first fall in electricity generation
since 2016.
The share of renewable’s in generation fell to 81.1 per cent. This is mainly due to a decline in hydro
generation, which is largely dependent on hydro lake inflows. Hydro lake storage and lake inflows
started off high at the start of the year, with hydro storage exceeding nominal full levels due to
higher than normal rainfall in the South Island hydro catchments.
Subsequently, there was a warm and dry spell across most of the country. The warm and dry weather
continued into the winter season. With below normal rainfall, hydro lake inflows fell below historical
average for most of autumn and winter. This led to annual hydro generation dropping by 5.2 per cent.

Figure D.1 Electricity generation by type
                     160

                     140

                     120
  Gross petajoules

                     100

                      80

                      60

                      40

                      20

                       0
                       1990   1995                2000              2005             2010                      2015                       2020

                                              Hydro      Gas   Geothermal   Coal   Wind     Other*
                                                                                     *Other includes oil, waste heat, biogas, wood, and solar

Electricity generated from wind increased
2020 saw the commissioning of Waipipi wind farm, which started injecting to the grid in November.
Generation from wind increased by 2.2 per cent compared to 2019. The capacity factor12 for wind
generation also increased to 37 per cent, slightly higher than the year before. This increase in
capacity factor accounts for the increase in generation capacity. This suggests that wind conditions
in 2020 was favourable for electricity generation. The September quarter of 2020 saw the highest
ever generation from wind for a September quarter, exceeding 600 GWh.

Electricity generated from natural gas increased despite declining production at Pohokura gas field
There was an increased reliance on fossil fuels as renewable generation was lower than the previous
year. Electricity generated from natural gas and coal increased by 9.6 per cent and 1.9 per cent
respectively, to make up for lowered renewable generation.
Production at Pohokura, New Zealand’s largest natural gas field, declined in 2020. Production from
the Pohokura gas field stopped for a maintenance outage in March and production was subsequently
affected when natural gas demand fell during COVID-19 Alert Levels 3 and 4.13 As a result of the drop

12 Capacity factors tell us how much electricity was generated by a source over a period of time relative to the
maximum amount that could have been generated based on its installed capacity.
13 More information on Pohokura gas field production can be found in the Oil and Gas chapter.
MINISTRY OF BUSINESS, INNOVATION AND EMPLOYMENT ENERGY IN NEW ZEALAND 2021
22 in natural gas production, less gas was available for electricity generation. Therefore, there was an
increase in electricity generated from coal. In 2020, electricity generated from coal made up 5.0 per
cent of all electricity. This is the highest share of electricity generated from coal since 2013.
Major industrial users of natural gas were also affected by constrained natural gas supply. Methanex,
New Zealand’s largest producer of methanol, shut down its Waitara Valley plant and dialed back it's
Motonui plant due to shortage in natural gas. This led to Methanex’s production to fall to 76 per cent
of total operating capacity. The strain in natural gas supply also caused an upward pressure on gas
spot prices and electricity spot prices.
The electricity generation market appears to be moving towards more renewable generation.
Although New Zealand relied more on thermal sources in 2020, Figure D.2 shows that electricity
generation from geothermal sources has overtaken natural gas and generation from wind has
overtaken generation from coal. With the commissioning and announcement of additional wind
and geothermal plants, generation from renewable sources is likely to increase.
Figure D.2 Generation from renewable sources overtaking non-renewable sources
40
15
30
Net generation PJ
10
20
5
10
0
2000 2005 2010 2015 2020 2000 2005 2010 2015 2020
Gas Geothermal Coal Wind
An additional 347 MW will be added to the renewable electricity market in the near future
2020 saw the commissioning of Junction Road natural gas peaking plant, Ngawha OEC4 geothermal
plant, and Waipipi wind farm.14 These three plants added an additional 226 MW to the market.
Several companies made announcements on new plants to support a greater renewable generation
mix. A few construction projects such as Turitea wind farm have been delayed due to COVID-19
related supply chain disruptions. When these plants are complete, these plants will be adding a
further 347 MW to the renewable electricity market.
This chart is based on information published by the Electricity Authority, supplemented with public
announcements by companies. The Ministry has attempted to ensure the information presented
is correct, however there may be instances where generation capacity and consent stage is
misreported. More specific information on new plant developments can be found at the end of this
chapter.
14 Waipipi wind farm was commissioned in November 2020. The additional capacity added is reflected in the data
tables from March quarter 2021 onwards.MINISTRY OF BUSINESS, INNOVATION AND EMPLOYMENT ENERGY IN NEW ZEALAND 2020
Table D.1 Electricity generation developments (MW) 23
Generation Type Status Start 2019 Start 2020
Gas Consented 360
Under Construction 100
Geothermal Applied for consent 35
Consented 282
Under Construction 31.5
Hydro Applied for consent 15
Consent Declined 46
Consented 386.5
Wind Applied for consent 100
Consent Declined 18
Consented 218 1434
Consents Lapsed 125
Under Construction 133 315
Box D.1 Battery Breakout Box
New Zealand's electricity generation is highly dependent on renewable generation, which is
largely dominated by hydro generation. However in a ‘dry year’ – when we have less rainfall
than average in a year – other sources are needed to make up the energy that water would have
otherwise provided to generate electricity. At the moment those sources are fossil fuels. This is
not consistent with the Government’s goal for a 100 per cent renewable electricity system.
If we want to replace fossil fuels in dry years, we will need a renewable ‘battery’ that’s big
enough to store enough energy for an entire dry year sequence. This dry year problem could be
exacerbated as New Zealand turns towards increasingly renewable energy sources like wind and
solar, meaning we could face a more complex ‘dry, calm and cloudy problem’ in the future.
To help solve New Zealand’s dry year electricity problem, in July the Government announced
a $30 million investigation into pumped hydro against other potential energy storage
solutions. With this, the three-phase New Zealand Battery Project was established.
Solutions being considered through the New Zealand Battery Project include a pumped hydro
scheme at Lake Onslow in Central Otago, pumped hydro elsewhere, and other potential
energy generation and storage solutions such as overbuilding renewable generation,
biomass, biogas and green hydrogen.
The team is currently in the first phase of the project, in which they will evaluate the costs
and risks of all these technologies, and advise government on how we can best manage dry
year risk in a 100 per cent renewable electricity system.
What is pumped hydro?
Pumped hydro technology is used throughout the world and involves transferring water
between two bodies of water at different heights. The water flows from one to the other
through tunnels, passing through a power station.
When electricity demand from consumers is low or when surplus power is available, electricity
is used to pump water from the lower level water reserve to fill the upper level reserve.
The water being stored in the upper reserve effectively becomes a battery, and can be
released when it’s needed during times of high demand or during dry years.
When the water is released from the upper reserve, it flows down the tunnels to drive
turbines that generate hydro-electricity.MINISTRY OF BUSINESS, INNOVATION AND EMPLOYMENT ENERGY IN NEW ZEALAND 2021
24
HVDC outage led to increased thermal generation in the North Island
Transpower undertook major refurbishment work on the HVDC inter-island link,15 starting7th
January 2020 for a period of 13 weeks to improve the resiliency of New Zealand’s national grid. The
HVDC outage meant that electricity generated in the South Island, where most of New Zealand’s
hydro generation is located, faced a transmission constraint when exporting electricity to the
North Island. A transmission constraint means that there are limits to the amount of electricity
that can be transferred through the HVDC. This contributed to South Island hydro generation being
lower than usual. As the North Island is where most of the New Zealand’s electricity demand is
located, additional generation was needed in the North Island to make up the shortfall in electricity
transmitted from the South Island.
In the week ended 12th January 2020, thermal generation contributed 16 per cent to the total
generation mix.16 On 18th January 2020, no HVDC transfer occurred due to a planned bipole outage.
This was followed by a planned electrode outage from 19th to 31st January, which reduced HVDC
capacity down to 406MW, in contrast to its normal transfer capability of 1200MW northwards and
850MW southwards. The additional generation in the North Island to make up for the shortfall in
electricity transmitted was mostly thermal. Thermal generation in March quarter 2020 was 21 per
cent higher than December quarter 2019.
Figure D.3 HVDC transfer
1000
Average flow (MW)
500
0
Jan 2020 Apr 2020 Jul 2020 Oct 2020
TimePeriod
Northward at Haywards Southward at Benmore
Demand
Commercial and industrial electricity demand fell, while residential demand increased
Electricity demand fell by 1.5 per cent (2.21 PJ) in 2020, driven by a decrease in demand from
industrial and commercial sectors. While the agriculture, forestry and fishing sector, and the
residential sector experienced increased demand, they did not offset the lower demand from
commercial and industrial sectors.
Most of the country was dry and warm, causing soil moisture levels to fall in key agricultural regions
in the South Island. Soil moisture levels are drivers of electricity consumption in agricultural regions.
15 Electricity transmission between the North and South Islands is done via a high voltage direct current (HVDC)
link from Benmore power station in the South Island to Haywards substation in the North Island
16 Data available from https://www.transpower.co.nz/sites/default/files/bulk-upload/documents/Market%20
Summary%20for%20week%20ended%2012%20Jan%202020_web%20version.pdfMINISTRY OF BUSINESS, INNOVATION AND EMPLOYMENT ENERGY IN NEW ZEALAND 2020 The agricultural sector was also deemed to be an essential service and therefore was not subject 25 to closure or production restrictions during COVID-19 Alert Levels 3 and 4. With lower than normal soil moisture levels combined with the sector being an essential service, this led to a 14 per cent (1.2 PJ) rise in demand from the agriculture, forestry and fishing sector. The closure of all non-essential industries and businesses, as well as schools, meant that there was an increase in the number of people working and studying at home. This contributed to higher daytime electricity usage, which led to a 2.5 per cent increase in residential demand. Demand in the commercial and industrial sectors fell by 4.6 per cent and 4.8 per cent respectively. In addition to COVID-19 related restrictions on business activity, there were significant disruptions to global supply chains. Electricity demand in the pulp, paper, and printing sub-sector fell by 15 per cent (1.38 PJ), the largest demand reduction of all sub-sectors. The fall in electricity demand is reflected in the value of exports, with wood pulp and paper products falling by 13 and 7 per cent respectively.17 Table D.2 Changes in electricity demand Sector 2019 (PJ) 2020 (PJ) Change (PJ) Agriculture, Forestry, and Fishing 8.8 10.0 1.2 ↑ Industrial 53.3 50.7 -2.6 ↓ Commercial 34.4 32.8 -1.6 ↓ Residential 45.4 46.6 1.2 ↑ Fourth potline at Tiwai point closed due to COVID-19 related pressures New Zealand Aluminium Smelters (NZAS) is the single largest consumer of electricity in New Zealand. It uses about 35 per cent of total industrial demand and 13 per cent of total electricity demand in New Zealand. NZAS’ majority owner Rio Tinto announced its decision to close the smelter following a strategic review due to rising electricity costs. The smelter has since reached a deal with Meridian Energy to continue operations until December 2024. Electricity futures prices rebounded in early 2021 following the announcement of that deal. In March 2020, NZAS’ majority owner Rio Tinto announced the closure of its fourth potline at Tiwai Point. The smelter was exempt from closure under COVID-19 Alert Level 4 due to the amount of resource involved in shutting down production. However, the decision to close the fourth potline was made due to falling international aluminium prices18 as the global commodity market slumped, and needing more flexibility to manage the health and safety of staff. The fourth potline was previously shut down in 2012 due to low aluminium prices and rising wholesale electricity prices. It then re- opened in 2018 after international aluminium prices started to recover over 2017. The potential closure of NZAS could signal future demand issues. With potential excess supply of electricity in the lower South Island, electricity will need to be transferred to the North Island where most of the demand is located. Transpower is undertaking the Clutha Upper Waitaki Lines Project (CUWLP)19 as part of maintaining and developing New Zealand’s national grid. With the completion of this project, the national grid will be better placed to support increased electrification. It also will reduce transmission constraints so that excess generation in the lower South Island (that may no longer be used by the Tiwai Point smelter if it closes in 2024) can be transported northwards. The project is expected to be completed by May 2022, and will bring the capacity to around 1,000 MW. 17 Data available from Stats NZ Goods and Services Trade 18 Aluminium was trading at USD$ 1,489 per tonne on the day of the announcement on the London Metal Exchange. International aluminium prices proceeded to drop as the global commodity market slumped with economies putting in place COVID-19 restrictions. 19 More information can be found at https://www.transpower.co.nz/clutha-upper-waitaki-lines-project
MINISTRY OF BUSINESS, INNOVATION AND EMPLOYMENT                                                                ENERGY IN NEW ZEALAND 2021

26   Figure D.4 Industrial electricity demand
                          60

                          50

                          40
       Gross petajoules

                          30

                          20

                          10

                           0
                               1995                 2000               2005                 2010                2015                2020

                                      Tiwai Point   Food Processing   Wood, Pulp, Paper, and Printing   Other Industrial Use

     Cost and Prices
     Electricity wholesale spot prices remain high
     The volume weighted average electricity spot price for 2020 was $114 per MWh. This was down
     slightly from the record high seen in 2019, but remains elevated when compared to the previous
     ten years, as shown in Figure D.5. Wholesale prices over the course of 2020 showed significant
     movements as illustrated in Figure D.6. Prices were subdued over the course of the initial COVID-19
     Alert Levels 3 and 4 during March, April and early May. Prices then surged through the latter part
     of May, and June set the highest monthly average price for the year at $171 per MWh. Higher than
     usual prices persisted for the second half of the year. There were a number of contributing factors,
     including lower than usual rainfall in parts of the country resulted in a worsening hydro storage
     situation, as illustrated in Figure D.7, with average lake levels well below the historical mean.
     However, even after fresh rains boosted hydro storage to more normal levels by early October,
     average prices remained above $100 per MWh through November and December.
     Another contributing factor to the elevated electricity wholesale prices was the ongoing tight supply
     of natural gas. For further information see Chapter F: Natural gas spot prices remain high.

     Figure D.5 Annual average wholesale electricity prices
MINISTRY OF BUSINESS, INNOVATION AND EMPLOYMENT ENERGY IN NEW ZEALAND 2020
Figure D.6 Weekly average wholesale electricity price over 2020 27
250
200
150
$/MWh
100
50
Jan 2020 Apr 2020 Jul 2020 Oct 2020 Jan 2021
Figure D.7 Hydro storage in 2020
4000
3000
GWh
2000
1000
0
Jan 2020 Apr 2020 Jul 2020 Oct 2020 Jan 2021
Mean, all records Controlled storage
Retail Prices
Despite the high prices in the wholesale market, this did not flow through to impact residential and
commercial consumers. As shown in D.8 the average electricity prices faced by these groups did not
change significantly compared to previous years.20 This is partly because electricity retailers have
been sufficiently hedged through a range of market mechanisms so that they have not had to pass-
on all of the wholesale price rises. The other significant factor is that while the energy component
of retail prices increased around 12 per cent from mid-2018 to mid-2020, this was largely offset by
falling transmission and distribution costs, which fell by around 9 per cent over the same period.21
20 Data from MBIE’s Quarterly Retail Sales Survey
21 Data from MBIE’s Quarterly Survey of Domestic Electricity PricesMINISTRY OF BUSINESS, INNOVATION AND EMPLOYMENT ENERGY IN NEW ZEALAND 2021
28 Figure D.8 Trend of retail electricity prices
Cents per kWh (excludes GST)
20
10
0
2013 2016 2019
March years
Commercial ResidentialBox D.2 Electricity Price Review and energy hardship:
Various initiatives are underway
After the release of the 2019 Electricity Price Review, work began on the recommendations
set by the Minister for Energy and Resources. During 2020, the COVID-19 response and
recovery resulted in some delays to this work, but at the time of publication all work is
ongoing. Some key updates are provided here, but further information can be found on the
MBIE website.
Defining Energy Hardship
Although work is ongoing to reduce experiences of energy hardship, there is currently no
generally agreed upon definition of energy hardship for New Zealand. This was an EPR
recommendation, and work continued in 2020, so that it can be measured and monitored. A
discussion document for public feedback will be released in 2021.
Prohibiting Prompt Payment Discounts (PPDs) and Low-user Fixed Charges (LFCs)
The EPR recommended that both PPDs and LFCs be phased out to remove an element of
market distortion that disproportionately impacts low-income consumers, and makes it
confusing to compare prices. In 2020, the Minister of Energy and Resources requested
information from electricity retailers about their use of PPDs, in order to inform decision
making for the phase out.
Budget 2020 announcements
In August 2020 $17 million of funding was announced as part of a budget package for
consumer advocacy and energy hardship. This funding was allocated to:
› Establishing an energy hardship expert panel and reference group
› Developing a network of community-level services to assist households in energy hardship
› Creating a fund for pilot programmes to improve energy efficiency for households in energy
hardship
› Supporting the development of an accepted definition and indicators of energy hardship
› Forming an electricity consumer advocacy council
A further $28 million over four years was announced for the Māori and Public Housing
Renewable Energy Fund.
Support for Energy Education in Communities (SEEC) and the Māori and Public Housing
Renewable Energy Fund
Two funds were established in late 2020 with support from the 2020 Budget. The first round
of SEEC funding (2020/2021) provided a total of $1.26 million to community organisations
or business working to support energy wellbeing, efficiency and affordability. $4 million was
available for renewable energy technologies in the first round, to be split between public and
Māori housing.
Winter Energy Payment
A separate government intervention is the Winter Energy Payment, administered by the
Ministry of Social Development. Understanding that COVID-19 would be economically
challenging for households, as well as increasing the amount of time spent at home, the
Winter Energy Payment was doubled in 2020. This meant that between 1 May and 1 October
2020, people receiving a main benefit were paid between $40.91 and $63.64 each week to
help them stay warm during winter. The energy hardship expert panel and reference group
recommended by the EPR will likely have some involvement in the overseeing of the Winter
Energy Payment, and other energy hardship initiatives.
Up to date information about the EPR can be found at: https://www.mbie.govt.nz/building-and-
energy/energy-and-natural-resources/energy-consultations-and-reviews/electricity-price/You can also read