20 20RESULTS PRESENTATION - TFG Limited

Page created by Benjamin Molina
 
CONTINUE READING
20 20RESULTS PRESENTATION - TFG Limited
20
     RESULTS
             20
PRESENTATION
FOR THE FULL YEAR ENDED 31 MARCH 2020
20 20RESULTS PRESENTATION - TFG Limited
INTRODUCTION
                                 01.
                                       by Anthony Thunström

                                       OPERATIONAL PERFORMANCE & IMPACT OF COVID-19
                                 02.
                                       by Anthony Thunström

                                 03.   RESILIENT BUSINESS MODEL & STRATEGY
      Anthony Thunström
                                       by Anthony Thunström
       Chief Executive Officer
                                       FY20 PERFORMANCE
                                 04.
                                       by Bongiwe Ntuli

             Bongiwe Ntuli             FINANCIAL POSITION
       Chief Financial Officer
                                 05.
                                       by Bongiwe Ntuli
                                       TIMELINE OF PROPOSED RIGHTS OFFER
                                 06.
                                       by Bongiwe Ntuli
                Jane Fisher
    TFG Africa Group Director
                                       TFG AFRICA
                                 07.
                                       by Bongiwe Ntuli

                                       CREDIT PERFORMANCE
                 Ben Barnett     08.
                TFG London             by Jane Fisher

                                       TFG LONDON
                                 09.
                                       by Ben Barnett
                 Gary Novis
               TFG Australia
                                 10.   TFG AUSTRALIA
                                       by Gary Novis
                                       OUTLOOK & CONCLUSION
                                 11.
                                       by Anthony Thunström

2                                                                                     TFG RESULTS PRESENTATION
                                                                                      FOR THE FULL-YEAR ENDED 31 MARCH 2020
20 20RESULTS PRESENTATION - TFG Limited
01.

INTRODUCTION

    Anthony
    Thunström

3               TFG RESULTS PRESENTATION
                FOR THE FULL-YEAR ENDED 31 MARCH 2020
20 20RESULTS PRESENTATION - TFG Limited
Pre-COVID-19
                         OVERVIEW

                         FY2020           •   Resilient financial performance up to end of February 2020
                    11 months to Feb 20

                   React and protect      •   Decisive actions taken to respond to COVID-19 to protect staff, customers and the business
                      March and April     •   Minimise cash outflows and protect liquidity

                                          •   c.80% of TFG Africa stores reopened from 1 May 2020, with all stores trading from 1 June 2020
COVID-19

                        Restore           •   Strong online trading continues
                           May            •   Operating safely and with strict social distancing and hygiene rules

                                          •   Operational and trading headwinds from COVID-19 and constrained consumer expected to
                   Positioning for the        persist - insulate against future shocks and future uncertainty
                         future           •   Continue to invest in our platform and digital transformation journey
                           June           •   Capital raise targeting gross proceeds of up to R3,95 billion

               4                                                                                                              TFG RESULTS PRESENTATION
                                                                                                                               FOR THE FULL-YEAR ENDED 31 MARCH 2020
20 20RESULTS PRESENTATION - TFG Limited
DECISIVE ACTION TAKEN TO RESPOND
     TO COVID-19
     React, protect and restore

     Various measures implemented to conserve cash and reduce expenditure
     Targeted cash savings of up to c.R6bn – with ability to flex depending on trading performance
     Targeted reduction in operating expenses of c.R1bn

     Inventory and merchandising                                Rental savings

     Stock for winter landed and well stocked,                 Discussions with landlords continue to reach
      managing exposure to currency fluctuations                 agreement on ‘fair’ rentals
     Working with merchandise suppliers to either              Closure of underperforming and marginal stores
      cancel or delay merchandise orders in response to         TFG Africa: focus on space rationalisation
      customer demand                                            continues
     Discussions with merchandise suppliers related to         TFG London: shift to turnover-based rentals and
      payment terms                                              shorter lease terms continues
                                                                TFG Australia: well advanced discussions with
                                                                 landlords around relief measures

     Indirect procurement saving
     Several initiatives underway to reduce non-
      essential business spend
     Business optimisation projects fast-tracked
5                                                                                                  TFG RESULTS PRESENTATION
                                                                                                   FOR THE FULL-YEAR ENDED 31 MARCH 2020
20 20RESULTS PRESENTATION - TFG Limited
DECISIVE ACTION TAKEN TO RESPOND
     TO COVID-19
     React, protect and restore

    Financial response
      Paused all discretionary capex
      62% of expansion capex has either been paused,
       delayed, deferred or cancelled in areas such as
       information technology, store refurbishment, logistics
       and services
      Strengthening financial position (access to gov
       support schemes)

    Initiatives to restore operations
     c.80% of TFG Africa stores reopened from 1 May
      2020, with all stores trading from 1 June 2020
     Work from home where possible
     Strong online trading continues
     Operating safely and with strict social distancing and
      hygiene rules

6                                                               TFG RESULTS PRESENTATION
                                                                FOR THE FULL-YEAR ENDED 31 MARCH 2020
20 20RESULTS PRESENTATION - TFG Limited
CONTINUED FOCUS ON CAPITAL ALLOCATION
          Ensuring a robust balance sheet, whilst insulating against shock

   Proposed rights offer targeting gross proceeds of up to R3,95 billion to de-gear and position TFG to capitalise on the re-opening of
    the economy
     • Rights offer subject to shareholder approval
   Increase optionality to continue to invest in the business and to strengthen our competitive advantages

                Invest in the business                        Robust                   Insulate against shocks
                Capex for organic growth                   balance sheet                      Risk of further ‘lockdowns’
                Right sizing as required                                                        and/or disrupted trading
                                                     Strong investment grade                                    in FY2021
                                                           credit rating

               Opportunistic                          Target net debt/EBITDA                              Dividends
               Position to take                         1-1,5x by end FY22*                        To be resumed when
               advantage of attractive                                                                      appropriate
               market opportunities

        * on a pre-IFRS 16 basis for TFG Africa

7                                                                                                                    TFG RESULTS PRESENTATION
                                                                                                                     FOR THE FULL-YEAR ENDED 31 MARCH 2020
20 20RESULTS PRESENTATION - TFG Limited
02.
    OPERATIONAL
    PERFORMANCE
    & IMPACT OF
    COVID-19

       Anthony
       Thunström

8                  TFG RESULTS PRESENTATION
                   FOR THE FULL-YEAR ENDED 31 MARCH 2020
20 20RESULTS PRESENTATION - TFG Limited
SALIENT FEATURES:
       Strong performance prior to COVID-19 impact in March

                                              R

      GROUP              GROSS                HEPS              FREE CASH      NET DEBT
     TURNOVER            MARGIN                                   FLOW        (pre-IFRS 16)

      +3,6%              52,7%               -1,1%            92,2% of NPAT      +3,2%

                         2019:                                    R2,3
    R35 billion                             1 174,4c                          R8,4 billion
                         53,6%                                   billion

9                                                                                    TFG RESULTS PRESENTATION
                                                                                      FOR THE FULL-YEAR ENDED 31 MARCH 2020
20 20RESULTS PRESENTATION - TFG Limited
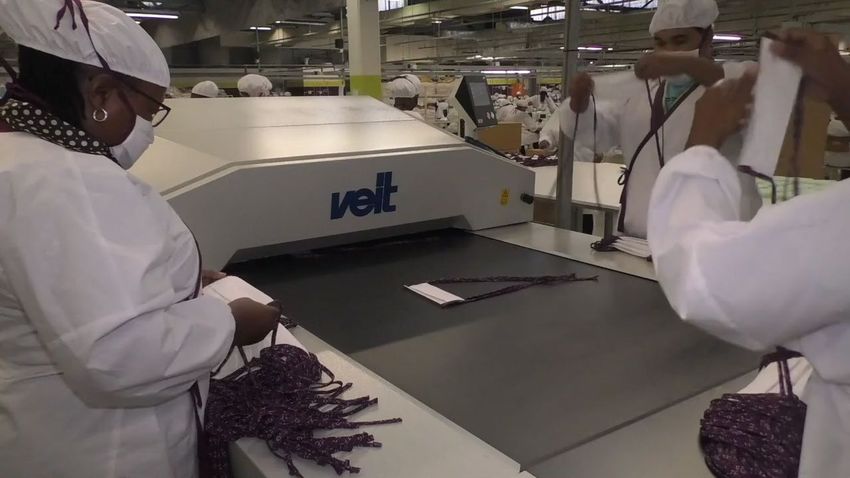
TURNOVER PERFORMANCE:
          COVID-19 impact in March

        +3,6%                        +5,5%            -22,6%                Strong contribution of
     Turnover growth               11 months to      1 month to               cash sales to total
      to R35 billion               Feb 20 (y-o-y)   Mar 20 (y-o-y)              retail turnover

                       c.R600m COVID-19
                                                                                       26%                    28%
                        impact on turnover
                         (1,6% of revenue)                                       FY20                FY19
                                                                           74%                 72%

                                                                                        Cash   Credit
                                                          35 323,3
                                                                                                March                  Feb

                                                                     Credit turnover             -2,5%             -1,4%
     34 101,4

                                                                     Cash turnover                5,9%              8,2%

                                                                         Tighter credit acceptance in FY2021

10                                                                                                TFG RESULTS PRESENTATION
                                                                                                     FOR THE FULL-YEAR ENDED 31 MARCH 2020
COVID-19 STORE CLOSURES:
      LOCKDOWN IMPACT ON TURNOVER

                        STORE CLOSURE DATES        STORE RE-OPENING DATES

                        United Kingdom: 23 March     United Kingdom: 15 June

                                                     South Africa: 1 May
                        South Africa: 26 March
                                                     (phased re-opening)

                        Australia: 27 March          Australia: 1 May (phased
                                                     re-opening)

11                                                                   TFG RESULTS PRESENTATION
                                                                     FOR THE FULL-YEAR ENDED 31 MARCH 2020
03.
     RESILIENT
     BUSINESS
     MODEL &
     STRATEGY

        Anthony
        Thunström

12                  TFG RESULTS PRESENTATION
                    FOR THE FULL-YEAR ENDED 31 MARCH 2020
THE STRATEGY IS RIGHT AND
          YIELDING THE DESIRED OUTCOME

     DIGITAL TRANSFORMATION                                 LEADERSHIP AND
                                                      MANAGEMENT TEAMS:
     E-COMMERCE MARKET                                  exceeded expectation in
     SHARE                                            leading the group through
     NEW BRANDS AND BRANDS                                        this challenge
     REPOSITIONING

                              LOCAL MANUFACTURING
                              GROUP SOURCING

13                            BUSINESS OPTIMISATION
                                                                           TFG RESULTS PRESENTATION
                                                                            FOR THE FULL-YEAR ENDED 31 MARCH 2020
DIGITAL TRANSFORMATION
         Continued to yield results in FY2020                                                                   GROWTH

PROJECTS IMPLEMENTED                                PROJECTS INITIATED AND CONTINUED
 ‘TFG on the go’ app                               ROLL-OUTS
 myWedding website on myTFGworld                    RFID                             80%
 ‘TFG Learn’ e-learning platform                    OneStock                         60%
                                                     OneX and Mobile POS              20%
                                                     Workforce Management (WFM)       10%
                                                     Robotic Process Automation (RPA) 10%
                                                     Store WiFi implementation        70%
                                                     ‘Yoobic                          90%

DIGITAL TRANSFORMATION BENEFITS DURING COVID-19
 E-commerce traded through the lockdown period (no deliveries) – April / May TFG Africa
   online turnover growth of 88%
 ‘OneStock’ solution allowed on-line customer demand access to store stock
 RFID (Radio Frequency Identification) at store level, allowed an improved stock accuracy for
   ‘On-line’ orders fulfilled from stores
 ‘TFG Learn’ App, our mobile e-learning app (with reverse billing), enabled continued
   communication with c.18 000 TFG Africa staff
 ‘TFG on the go’ HR App (with reverse billing) used for all staff permits and letters of
   authorisation to return to work

14
                                                                                                 TFG RESULTS PRESENTATION
                                                                                                 FOR THE FULL-YEAR ENDED 31 MARCH 2020
TFG AFRICA E-COMMERCE
     Impressive growth continues in FY2020                                                        GROWTH

                                                                       1,6%          TFG Africa e-commerce
                                                                                     turnover contribution to
                                                                       of turnover   total TFG Africa turnover

                                                                                     FY2025 target

                                                                                          10%
                                 0,4%
                                of turnover                             53%          FY2020
                                                                       4-year CAGR
                                                                                          1,6%
                                  2016        2017     2018     2019       2020
                                                                                     FY2016
                                          TFG Africa e-commerce turnover
                                                                                       0,4%

15                                                                                   TFG RESULTS PRESENTATION
                                                                                     FOR THE FULL-YEAR ENDED 31 MARCH 2020
SHARE OF CUSTOMER TRAFFIC
               (incl. Website & app) - Bricks and mortar retailers                                        GROWTH

                                  TRUWORTHS         EDGARS    SPORTSMANS
                                                              WAREHOUSE
               DISCHEM
                                                                    COTTON ON
                                              8%    6%   3%
                                                              3%         OTHER
                                  8%                               3%
MR PRICE
                         9%                                                            Most visited
                                                                                       Lifestyle
                      15%                                          28%           TFG   Destination
CLICKS                                                                                 in
                                              17%                                      South Africa

                                        WOOLWORTHS

 Source: SimilarWeb – April 2019-March 2020
                                                                                            TFG RESULTS PRESENTATION
                                                                                             FOR THE FULL-YEAR ENDED 31 MARCH 2020
LOCAL MANUFACTURING:
                 FY20 performance strengthens competitive advantage                                                                          PROFIT

        QR % to TFG Africa apparel

                                                                                                     +8%
                                                     TFG QR advantage over longer leadtimes
                  units                                                                                                    Employment provided
                 34%                  35%
                                                                     -59             +4%

                                                                                                     R50m                   Investment in local
                               21%                               Inventory days    Clearance
                                                                   advantage       advantage
        15%                                                                                                                 supplier development

                                                                                                                            Capital investment to
          FYE19                 FYE20                               +56%          48 days            R21m                   advance quick response
                                                                                                                            (QR)
               QR      Local suppliers                            Local fabric    Ave. lead time
                                                                   sourcing

                                                                                                     R10m
         TFG D&M* QR contribution
           QR contribution
                                73%                                                                                         Investment in digitisation
                                                                                                   Why Quick Response?
           66%                                                                                     Key benefits
                                                     TFG QR model competitive advantage

                                                           Margin advantage
                                                                                                     +57%                   QR capacity
         FYE19                 FYE20

                                                           Trend relevance
 11,7m              8,5m                 26%                                                                             Deepened partnership with
   Units
manufactured        QR units         Total Apparel         Superior inventory cost control                               local fabric conversion
                                                                                                                         suppliers
       * TFG D&M: TFG Design & Manufacturing
  17                                                                                                                           TFG RESULTS PRESENTATION
                                                                                                                               FOR THE FULL-YEAR ENDED 31 MARCH 2020
04.
     FY20
     PERFORMANCE

        Bongiwe
        Ntuli

18                 TFG RESULTS PRESENTATION
                   FOR THE FULL-YEAR ENDED 31 MARCH 2020
PERFORMANCE AT A GLANCE
                Effective cost control evident in reduced expense ratio

          Financial performance                                             Financial position

                               YTD           YTD          YTD                                   YTD           YTD                    YTD
                         March 2020      Feb 2020   March 2019                            March 2020      Feb 2020             March 2019

 Turnover growth                  3,6%       5,5%        19,6%    ROCE                           13,3%               -                  15,1%

 Gross margin                    52,7%      53,4%        53,6%    Debt-to-equity ratio           106,4%     112,8%                     117,8%

 EBITDA margin                   24,1%      25,4%        25,0%    FCF to net profit                92%               -                     85%

 EBIT margin                     13,3%      14,9%        14,3%    Current ratio                     1,5          1,5                         1,6

 Headline earnings           R2 717m            -      R2 745m    Net debt to EBITDA              1,99x      1,98x                        1,94x

 HEPS                         1 174,4c          -      1 187,9c

The above information is post-IFRS 16

   19                                                                                                        TFG RESULTS PRESENTATION
                                                                                                             FOR THE FULL-YEAR ENDED 31 MARCH 2020
REVENUE BREAKDOWN:
               Retail turnover remains key driver

                                                                  +3,6%    Retail turnover

                                            FY 2020 performance
                                  92%

                   FY 2020
                contribution to                                   -0,2%    Interest income
                   revenue
     4%
          4%                                                      +10,4%   Other income

20                                                                                           TFG RESULTS PRESENTATION
                                                                                             FOR THE FULL-YEAR ENDED 31 MARCH 2020
TURNOVER DRIVERS:
                  Good performers

                                   GEOGRAPHY                                                                          TENDER

                       TFG              TFG             TFG                                              CASH                CASH              CREDIT

                                                                                                                                                                             Impact of COVID-19 on March turnover growths
                      Africa          London          Australia                                         (Group)           (TFG Africa)   (Group & TFG Africa)
YTD 12                                                                                       YTD 12
MONTHS               +3,3%            -4,5%            +9,6%                                 MONTHS      +5,9%             +7,7%               -2,5%
YTD 11                                                                                       YTD 11
MONTHS               +4,8%            -0,8%           +13,0%                                 MONTHS      +8,2%              +9,5%               -1,4%

                                     CHANNEL                                                                  MERCHANDISE CATGORY

                     STORES                           ONLINE                                                              HOMEWARE
                                                                                                      CLOTHING CELLULAR             JEWELLERY COSMETICS
                                                                                                                          FURNITURE

YTD 12
MONTHS
                     +4,1%                            -1,9%                                  YTD 12
                                                                                             MONTHS
                                                                                                      +3,9% +1,6%           +5,2%        +2,7%        -1,5%

YTD 11                                                                                       YTD 11
MONTHS                +5,6%                           +4,4%                                  MONTHS   +6,0%       +2,6%     +6,0%         +3,2%       -0,1%

         Geographic turnover growth in local currencies, all other turnover growths in ZAR
   21                                                                                                                                                    TFG RESULTS PRESENTATION
                                                                                                                                                         FOR THE FULL-YEAR ENDED 31 MARCH 2020
TURNOVER & GROSS MARGIN

                 TFG Africa            TFG London            TFG Australia           Group
 Turnover

                  +3,3%                  -4,5%                 +9,6%                 3,6%
              Retail turnover of    Retail turnover of     Retail turnover of   Retail turnover of
                  R22.5bn                £390m                 A$542m                R35bn
                                                                                                              Product Mix

                                                                                                      QR Response Inventory Model
                  47,5%                  59,3%                 65,4%                52,7%
margin
Gross

               (March 2019:           (March 2019:          (March 2019:          (March 2019:
                 48,2%)                 61,4%)                66,0%)                53,6%)

             Relatively stable
                                     Lower margin        Maintained margins
                 margin

            Increase in summer     Markdown & mix of     COVID-19 impact in
              stock provision      promotional sales        March only

22                                                                                                   TFG RESULTS PRESENTATION
                                                                                                     FOR THE FULL-YEAR ENDED 31 MARCH 2020
05.

     FINANCIAL
     POSITION

       Bongiwe
       Ntuli

23               TFG RESULTS PRESENTATION
                 FOR THE FULL-YEAR ENDED 31 MARCH 2020
SOLID FINANCIAL POSITION

                            TFG Africa Inventory Days
                            191                                                            ROCE

     R8,4bn
                                       183
                                                    173                         GROUP TFG AFRICA

         Group                                                                   15,3%       21,6%    MARCH 2020
                           FY2018     FY2019       FY2020
       Inventory

                                                             Pre-IFRS 16
                                      TFG Africa

     R7,8bn
                      •   +4,3% compared to March 2019                           17,3%       24,2%    MARCH 2019

                      •   Allowance for impairment as % of
                                                                            TFG AFRICA medium to long term target:
                          debtors’ book increased to 20,4%                  23% – 25% (pre-IFRS 16)
        Trade             (March 2019: 19,9%)
      Receivables
                                                                                 13,3%       18,7%    MARCH 2020

                                                             Post-IFRS 16
     1,5x
                      •   Stable compared to March 2019
                          (1,6x)
                                                                                 15,1%       20,8%    MARCH 2019

      Current ratio

24                                                                                                         TFG RESULTS PRESENTATION
                                                                                                           FOR THE FULL-YEAR ENDED 31 MARCH 2020
CONTINUED IMPROVEMENT IN DEBT TO EQUITY
                Ratio dropping to 52,4%

                            EBITDA to       Net debt to          Debt to
                                             EBITDA              equity
                                                                                                                                Debt to Equity ratio
                          finance costs
                                                                                                   70%
                                                                                                   60%
                               6,8              1,6               52,4%       MARCH 2020
                                                                                                   50%
    R8,4bn                                                                                         40%
      Net debt                                                                                                   FY2017                FY2018               FY2019                     FY2020
    (pre-IFRS 16)              6,9              1,6               57,7%       MARCH 2019
                                                                                                                                         Debt to equity ratio

                                                                                                  Rbn
                                                                                                                             Debt Repayment Profile*
                               6,4              2,0              106,4%
    R17,0bn
                                                                               MARCH 2020         4,0
                                                                                                         3,0 2,8
                                                                                                  3,0
       Net debt                                                                                   2,0
    (post-IFRS 16)                                                                                1,0
                               6,5              1,9              117,8%        MARCH 2019         0,0

                                                                                                             Mar 20

                                                                                                                              Mar 21

                                                                                                                                                 Mar 22

                                                                                                                                                                       Mar 23

                                                                                                                                                                                            Mar 24
                                                                                                  -1,0
                                                                                                  -2,0
                                                                                                                                                          -2,0                  -1,8                 -1,7
                                                                                                  -3,0
•    Adequate liquidity facilities in place including additional committed facilities of R3,3bn
     (total liquidity available at end May 2020 of c.R6bn)                                        -4,0
•    Covenant waivers for Sept 2020 interim period and covenant reset for FY2021 to 3,5x          -5,0
     LTM EBITDA                                                                                   -6,0
•    No final dividend declared for FY2020 in light of current subdued economic environment.      -7,0                                 -5,8
     Dividends will be resumed when appropriate.                                                                      Cash       Available facilities            Debt repayment

    25                                                                                            * Rescheduled from 2021 to 2022 – R4,1bn                   TFG RESULTS PRESENTATION
                                                                                                                                                             FOR THE FULL-YEAR ENDED 31 MARCH 2020
FREE CASH FLOW CONVERSION
     92% of NPAT

                                            Stable free cash flow generation in FY2020

               Significant impact on EBITDA and net working capital as a result of COVID-19 in FY2020

                            Free cash flow outlook for FY2021 and FY2022 remains uncertain

                Cash movement from FY2019 to FY2020                                  Evolution of Free Cash Flow
                                                                    92% of
                                                                    NPAT at              2,5   30%     55%     77%        85%      92%
            85% of
          NPAT at 31                                                 31 Mar
           Mar 2019                                                   2020
                                                                                         2,0

                                                                                         1,5

                                                                                 ZARbn
                                                                                         1,0

                                                                                         0,5

                                                                                         0,0
                   EBITDA                                                                      FY16*   FY17*   FY18*     FY19     FY20
       FCF MARCH             TAX       CAPEX - WORKING    CAPEX - FCF MARCH
          2019                         MAINTAIN CAPITAL   EXPAND     2020                              FCF     FCF as % of NPAT

                            Increase       Decrease   Total                     * FCF in FY16 – FY18 not restated for IFRS 9, 15 and 16
26                                                                                                                                        TFG RESULTS PRESENTATION
                                                                                                                                          FOR THE FULL-YEAR ENDED 31 MARCH 2020
CAPEX SPEND FOR THE YEAR:
          Deliberate increased investment in digital transformation

                                                                                          R1 119,4m             R942,4m
         Increased investment in
         digital technology partly
                funded with                                          EXPAND                  69%                   59%
       reduced store capex spend

                                                                     MAINTAIN                31%                   41%
                     CAPEX by nature

       Mar 20              55%              36%        9%

       Mar 19              61%               31%       8%                 FY21 Capex allocation guidance
                           Stores   IT   Other

                                                                        Reduction in planned capital spend for FY21
                   CAPEX by segment

     Mar 20                 68%                  18%   14%              Focus remains on digital transformation initiatives and
                                                                        investment to grow successful e-commerce platforms
     Mar 19                67%                   16%   17%
                                                               c.
              TFG Africa   TFG London     TFG Australia      70|30      Planned expansionary / maintenance ratio: c.70|30

27                                                                                                                                TFG RESULTS PRESENTATION
                                                                                                                                  FOR THE FULL-YEAR ENDED 31 MARCH 2020
06.
     TIMELINE OF
     PROPOSED
     RIGHTS
     OFFER

         Bongiwe
         Ntuli

28                 TFG RESULTS PRESENTATION
                   FOR THE FULL-YEAR ENDED 31 MARCH 2020
TIMELINE OF PROPOSED RIGHTS OFFER
           Indicative rights offer terms

       Indicative offer size               Fully underwritten renounceable rights offer to raise gross proceeds of up to R3,95 billion

                                          •1 Insulates the balance sheet
          Use of proceeds                 •2 Continue investing in the business
                                          •3 Position TFG to take advantage of attractive market opportunities

                                               18 June 2020                                   Mid July 2020                 ASAP post EGM
                                                                Shareholder notice period
                                          • March 2020 full                                 • Convening of the             • Launch of
         Indicative timing                  year results                                      EGM                            proposed rights
                                            announcement                                                                     offer
                                                                                            • Results published
                                          • Release of EGM                                    on SENS
                                            circular

                        Proposed rights offer reflects outcome of detailed scenario planning exercise and
                       aim to achieve a target leverage ratio of less than 1,5x LTM EBITDA by end FY2022*

     * on a pre-IFRS 16 basis for TFG Africa

29                                                                                                                                        TFG RESULTS PRESENTATION
                                                                                                                                          FOR THE FULL-YEAR ENDED 31 MARCH 2020
07.

     TFG AFRICA

        Bongiwe
        Ntuli

30                TFG RESULTS PRESENTATION
                  FOR THE FULL-YEAR ENDED 31 MARCH 2020
TFG AFRICA PERFORMANCE

 +3,3%                           29,1%
                                         EBITDA margin
                                               29,1%
    Retail turnover                                           27,9%
     of R22,5bn

  47,5%
     Gross margin
                                Mar 19         Feb 20         Mar 20

  -1,2%
 EBITDA* of R6,3bn

  27,9%                   Strong performance in tough environment, even
                           before COVID-19 impact
    EBITDA margin         Gross margin erosion due to impact of March
                           trading – Feb 2020 margin 48,1% vs March 2019

   2 577                   48,2%
                          Business optimisation part driver for trading
                           expense growth at only 1,9%
         outlets
* Post-IFRS 16 EBITDA
  31                                                                       TFG RESULTS PRESENTATION
                                                                           FOR THE FULL-YEAR ENDED 31 MARCH 2020
KEY MESSAGES

  Market-leading turnover growth to February 2020

  COVID-19 impacted significantly on the month of March 2020

  We continued to gain ground in expense control / optimisation

  TFG Australia performance above expectation

  TFG London performance at expectation in a tough market

  Strong free cash flow generation (R2,3 billion, 92,2% of NPAT)

  We continued to invest for the future (capex of R1,1 billion, 69% of
   which is expansionary)

  We continue to focus on cost and liquidity management and
   scenario planning

32                                                                        TFG RESULTS PRESENTATION
                                                                          FOR THE FULL-YEAR ENDED 31 MARCH 2020
08.

     CREDIT

       Jane
       Fisher

33              TFG RESULTS PRESENTATION
                FOR THE FULL-YEAR ENDED 31 MARCH 2020
TFG AFRICA CREDIT SUMMARY
            Prudent lending in tough conditions

                                                                                              COVID-19 credit actions

 INDUSTRY
                   Pre-COVID-19 TU Consumer Credit Index highlighting deteriorating
                    consumer credit health                                                 Limiting Exposure
                                                                                           Credit granting has been restricted, accept rates
                                                                                           down to
CREDIT EBIT SUMMARY

                  Post-COVID-19 adj                 Pre-COVID-19 adj                                                 Post-COVID-19 Pre-COVID-19
                                                                                                                          adj           adj

                 TFG AFRICA                                        % of credit       TFG AFRICA
                                  % of credit   TFG AFRICA                                            % of credit     TFG AFRICA      TFG AFRICA
                  March 2020                                     transactions         March 2019
                                transactions     March 2020                                         transactions       % change        % change
                        (Rm)                                                                (Rm)

Income               2 375,5            17,2          2 375,5            17,2            2 235,9            15,8               6,2                 6,2
Net bad debt        (1 275,5)            9,2         (1 086,4)            7,9             (992,8)            7,0              28,5                 9,4
Credit costs          (560,9)            4,1          (560,9)             4,1             (529,4)            3,7               6,0                 6,0
EBIT                   539,1             3,9            728,2             5,3              713,7             5,0             (24,5)                2,0

                                                                    Gross bad debt                           Growth in
                                   Income growth                  write off growth and                      credit costs
                                    exceeds book                  provision impact of                      stable despite
                                       growth                     COVID-19 increase                         challenging
                                                                      net bad debt                          environment

    35                                                                                                                                TFG RESULTS PRESENTATION
                                                                                                                                      FOR THE FULL-YEAR ENDED 31 MARCH 2020
09.

     TFG
     LONDON

        Ben
        Barnett

36                TFG RESULTS PRESENTATION
                  FOR THE FULL-YEAR ENDED 31 MARCH 2020
TFG LONDON PERFORMANCE

  -4,5%                                  61,4%
                                                   Gross margin

                                                         60,3%
    Retail turnover
                                                                         59,3%
      of £390m

  59,3%                                  Mar 19          Feb 20          Mar 20
     Gross margin

-18,4%
 EBITDA* of £44,3m
                        • YTD turnover growth flat until February 2020

  11,3%                 • Gross margin negatively impacted by significant promotional activity
                          in the market, adverse foreign exchange movements, impact of
                          continued online growth on logistics costs and higher COVID-19
    EBITDA margin         related stock provisioning
                        • Strong cost control within store estate: 26 new stores at advantageous

       972
                          rents - 76% of the portfolio now with a break event within 3 years
                        • Decline of 5,5% in trading expenses as a result of various initiatives
                          undertaken
         outlets        • Completion of the TFG London unification project, with the
                          implementation of our single finance platform
* Post-IFRS 16 EBITDA
  37                                                                                               TFG RESULTS PRESENTATION
                                                                                                   FOR THE FULL-YEAR ENDED 31 MARCH 2020
COVID-19

    Impact on footfall in selected Asian market visible by end January 2020
    Impact accelerated across all markets by end March 2020
    Sharp reduction in UK mall and high street footfall through course of March
    All stores in brand portfolio closed 23 March

    Trading actions                                     Government support                            Change in retail sales (y-o-y)

 Online operations continued with                       Deemed eligible for government support,
  appropriate safety measures in place                    both in the UK and significant number of      20,0%
                                                          our international markets. This included:
 Working with supply chain partners to                                                                      -
  manage forward commitments                              • Payroll support                                      Jan   Feb             Mar
                                                                                                       (20,0)%
 Discussions with merchandise suppliers                  • Property support
  re a balanced approach to payment terms                 • Tax payment deferrals to manage            (40,0)%
                                                            cashflow
 20% pay reduction across April and May                                                               (60,0)%

  for all store and head office staff and                                                              (80,0)%
  senior management
                                                                                                      (100,0)%
 IT environment stress tested ahead of
  government mandated lockdown to
  ensure that staff can work from home

    38                                                                                                                 TFG RESULTS PRESENTATION
                                                                                                                       FOR THE FULL-YEAR ENDED 31 MARCH 2020
WHY WE ARE WELL POSITIONED
                             TO SURVIVE THIS CRISIS

                     Entered current COVID-19 crisis with:
Pre-COVID-19

                          • a strong brand portfolio
                          • a strong online presence (both direct and through third parties)
                          • limited operational leverage (versus our peer group)
                          • a strong local balance sheet / cash holdings

                     Despite these strengths, the initial impact of the crisis has been severe
                         • our brands have a strong focus on workwear and occasion in contrast to a consumer currently
                             focused on loungewear, activewear and non-fashion

                     To date, reforecasts have been met as trade on our web channels has gradually rebuilt and international
Post-COVID-19

                     markets have gradually re-opened

                     Path to recovery uncertain at this point, however, these key factors are in our favour:
                          • A strong online & multichannel offering
                          • Diverse international presence across Europe, Asia and the Americas
                          • Short store leases with increasing flexibility
                          • Lower operational leverage versus peers
                          • A resilient core consumer
                          • A supportive local government
                          • A supportive group of key stakeholders, including our suppliers, lenders and senior team

                39                                                                                                             TFG RESULTS PRESENTATION
                                                                                                                               FOR THE FULL-YEAR ENDED 31 MARCH 2020
10.

     TFG
     AUSTRALIA

        Gary
        Novis

40               TFG RESULTS PRESENTATION
                 FOR THE FULL-YEAR ENDED 31 MARCH 2020
TFG AUSTRALIA PERFORMANCE

                                                                              EBITDA margin
 +9,6%                                                                                   26,7%

                                                                                                                     25,6%
    Retail turnover
     of A$542m
                                                               24,4%

  65,4%
     Gross margin                                             Mar 19                     Feb 20                      Mar 20

+15,0%
EBITDA* of A$138,7m

  25,6%
                             LFL sales ahead of Australian market at 2,8% (stores) and 4,1% (including
                              online), including a result of -35,1% in March
                             Feb YTD was +7,1% LFL
    EBITDA margin            Rolling 12-month Feb turnover growth was up 11,9% compared to prior year
                             27,6% comparable EBITDA growth to Feb*

       534                   Expense growth in line with expansion
                             FY20 financial performance for the business continued to be ahead of the
                              market
         outlets
* Post-IFRS 16 EBITDA
  41                    •   EBITDA excludes loss on disposal of G-Star franchise assets in Dec 2018 and $4,3m loss
                            on closure of ASA test stores in March 2020                                                       TFG RESULTS PRESENTATION
                                                                                                                              FOR THE FULL-YEAR ENDED 31 MARCH 2020
COVlD-19 IMPACT

                   COVID-19                AUST & NZ                  PHASE 1                    PHASE 2                     Government                    PHASE 3                          PHASE 4
500               Response Plan                Declines                Hibernation                     Testing                   initiatives                  Ignition                       Re-Build
                                         PM announces               Closed all stores
                Plan commences                                                                Skeleton team                 Job Keeper                   Re-opening stores             Ongoing project to
                                         only essential             27th March
400             Supply chain focus
                                         shopping
                                                                                              Digital sales                 Job Seeker
                                                                                                                                                         Commences                     Re-build
                                                                    “Stand Down”
                                         Traffic slows              Entire Head office        exceed plan                                                Phased by State,              Cash Flow
                Rules for returning                                 Team 1st April                                          Landlord Code                Brand, Centre                 Management
                                         into March
                Travelers                                                                     Procedures                    of Conduct
300                                      Traffic plummets
                                                                    Discussions with          developed for                                              Significant                   All China suppliers
                Office protocol                                     major partners            COVID-19                                                   Discounting to                Paid by Mid-June
                                         Week 2 March
                                                                     - Banks (CBA)            operating                                                  Drive traffic and
                                                                     - Landlords                                                                         Sales                         Landlord
                                         Stores become
                                                                     - Suppliers              Testing 1st
200                                      loss making
                                                                                              Rockwear store                                             Building
                                                                                                                                                                                       Negotiations
                                                                                                                                                                                       Continue
                                                                    Cash management
                                         Near zero centre                                                                                                Momentum
                                         fashion activity           Supplier support          All Brands tested                                                                        Sales remain the
                                                                    confirmed                                                                            1St June HO Team              Focus – 6 months
100                                                                                                                                                      returns

0

                        16/2                   01/3                  15/3                   29/3                     12/4                   26/4                10/5                        02/6
           CHINA       INTERNATIONAL   RESTRICTIONS   MARCH   AUS            AUS            SHOPPING    SOCIAL       MAJOR       TESTING     PM:         PM:                 PM:            STATES:
           ANNOUNCES   SPREAD          IN SEA         + 100   RESTRICTIONS   RESTRICTIONS   TRAFFIC     DISTANCING   RETAILERS   LEVELKS     SUPPORT     RESTRICTIONS        RESTRICTIONS   SLOW
                                                      CASES   L1             L2             DECLINE                  CLOSING     >10K/DAY    PACKAGRES   TO EASE             TO STATES      EASING

      42                                                                                                                                                                             TFG RESULTS PRESENTATION
                                                                                                                                                                                      FOR THE FULL-YEAR ENDED 31 MARCH 2020
STRATEGY

 Strategy remains relatively unchanged

 COVID-19 has highlighted numerous strengths including:
   •    The ability to manage wind down and ramp up
   •    The strength of supplier relationships
   •    A sound business continuity plan
   •    The growing online presence of the business
   •    Confirmation of the strategy

 Growth through expansion of existing brands in Australia and New Zealand
  continues with a net increase of 51 stores during the financial year
   • New outlets includes 25 concessions within Myer department stores
   • American Swiss Australia – 6 test stores closed during March 20

   43                                                                        TFG RESULTS PRESENTATION
                                                                             FOR THE FULL-YEAR ENDED 31 MARCH 2020
11.

     OUTLOOK &
     CONCLUSION

        Anthony
        Thunström

44                  TFG RESULTS PRESENTATION
                    FOR THE FULL-YEAR ENDED 31 MARCH 2020
WELL POSITIONED TO CAPITALISE ON RE-OPENING
             OF THE ECONOMY
             Make-up of the retail sector will shift and shopping behavior changes have accelerated

Well-positioned for growth post COVID-19                                    Enhancing our ability to capitalise on strategic actions

✔•     Diversified product mix and customer base, with
                                                                                Fast-track e-commerce evolution and digital
       strong brands supported by growth
                                                                                               transformation
✔•     Geographically diversified across 32 countries
                                                                              Investment through the cycle: Capex investment

✔•     Well established and growing e-commerce platforms                                   to grow market share

                                                                               Positioning for agility and flexibility: Balance
✔
   •   Local sourcing and high degree of vertical
       integration                                                            sheet headroom to respond to market opportunities

✔•     Solid history of management execution and track
       record of delivering quality earnings
                                                                                          Capture market share:
                                                                                    Organic growth and opportunistic M&A

Reduced gearing will allow us to continue to invest in our platform to grow long-term value and to capitalise on market share growth

 45                                                                                                                           TFG RESULTS PRESENTATION
                                                                                                                              FOR THE FULL-YEAR ENDED 31 MARCH 2020
OUTLOOK

                  TFG Africa                                                        TFG Australia                                                TFG London

                                                                                                                                        Phased opening of outlets
      Strong performance in May                      Slow start to May but                                                             from 15 June
       (TFG Africa revenue up c.7%                     trading improving every
       on a like-for-like basis), but                  week
       slowing in June

                                                               Wk 2
                                                                      Wk 3
                                                                             Wk 4
                                                                                    Wk 5
                                                                                           Wk 6
                                                                                                  Wk 7
                                                                                                         Wk 8
                                                                                                                Wk 9
                                                                                                                       Wk 10
                                                                                                                               Wk 11
                                                        Wk 1

     COVID-19 will have a significant impact on FY2021 across all territories, the extent of which is difficult to predict with accuracy

46                                                                                                                                                            TFG RESULTS PRESENTATION
                                                                                                                                                              FOR THE FULL-YEAR ENDED 31 MARCH 2020
20
     RESULTS
             20
PRESENTATION
FOR THE FULL YEAR ENDED 31 MARCH 2020
DISCLAIMER

              This announcement contains certain forward-looking statements with respect to the
              financial condition and results of operations of The Foschini Group Limited and its
              subsidiaries, which by their nature involve risk and uncertainty because they relate to
              events and depend on circumstances that may occur in the future.

48                                                                                   TFG RESULTS PRESENTATION
                                                                                      FOR THE FULL-YEAR ENDED 31 MARCH 2020
DISCLAIMER

THIS DOCUMENT, ITS CONTENTS AND ANY INFORMATION PROVIDED AT THIS PRESENTATION ARE NOT FOR RELEASE,
PUBLICATION OR DISTRIBUTION, IN WHOLE OR IN PART, DIRECTLY OR INDIRECTLY, IN OR INTO THE UNITED STATES OF
AMERICA, ITS TERRITORIES OR POSSESSIONS, CANADA, AUSTRALIA AND JAPAN OR TO ANY RESIDENT THEREOF OR ANY
OTHER JURISDICTION OR TO ANY OTHER PERSON WHERE SUCH DISTRIBUTION WOULD BE UNLAWFUL. THIS PRESENTATION
IS NOT AN OFFER OR AN INVITATION TO BUY, SELL OR SUBSCRIBE FOR SECURITIES IN ANY JURISDICTION.

IMPORTANT: The following applies to this document, the oral presentation of the information in this document by the Foschini Group Limited
(the “Company”) or any person on behalf of the Company, and any question-and-answer session that follows the oral presentation
(collectively, the “Information”). This presentation may not be reproduced in any form, further distributed or passed on, directly or indirectly,
to any other person, or published, in whole or in part, for any purpose. any failure to comply with these restrictions may constitute a violation
of applicable laws and violate the company’s rights.

The Information constitutes factual, objective information about the Company, and nothing contained herein should be construed as
constituting any form of investment advice or recommendation, guidance or proposal of a financial nature as contemplated in the Financial
Advisory and Intermediary Services Act, 2002 (as amended) in respect of the Company. Any decision to purchase securities of the Company
in any offering, including the rights offer discussed herein (the “Securities”), should be made solely on the basis of information contained in
any prospectus or offering circular that may be published by the Company in final form in relation to any proposed offering.

    49                                                                                                                    TFG RESULTS PRESENTATION
                                                                                                                          FOR THE FULL-YEAR ENDED 31 MARCH 2020
DISCLAIMER

The purpose of the Information is to provide an overview of the Company. The Information does not purport to be full or complete. No
reliance may be placed for any purpose on the Information or its accuracy, fairness or completeness. The Information and opinions
contained therein are provided as at the date of the presentation and are subject to change without notice. The Information does not
constitute or form part of any advertisement or marketing material, any offer or invitation to sell or issue, any offer or inducement or
invitation or commitment to purchase or subscribe for, or any solicitation of any offer to purchase or subscribe for, any Securities or
securities in any other entity nor shall it or any part of it nor the fact of its distribution form the basis of, or be relied on in connection with,
any contract or investment decision in relation thereto. The Information is indicative and does not purport to contain the information that
would be required to evaluate the Company, its financial position and/or any investment decision. This document is not intended to
provide, and should not be relied upon for, accounting, legal or tax advice nor does it constitute a recommendation regarding any
transaction.

The Information is not an offer or sale of securities in any jurisdiction where it is unlawful to do so. The Company does not intend to
register the Securities under the US Securities Act of 1933 (the “Securities Act”), or with any securities regulatory authority of any state or
other jurisdiction of the United States, and the Securities may not be offered, sold, resold, pledged, delivered, distributed or transferred,
directly or indirectly, into or within the United States except pursuant to an exemption from, or in a transaction not subject to, the
registration requirements of the Securities Act and in compliance with any applicable securities laws of any state or other jurisdiction of
the United States.

   50                                                                                                                            TFG RESULTS PRESENTATION
                                                                                                                                 FOR THE FULL-YEAR ENDED 31 MARCH 2020
DISCLAIMER

The Securities are not intended to be offered or sold to and should not be offered or sold to any retail investor in the European Economic
Area (“EEA”) or the United Kingdom (“UK”). For these purposes, a retail investor means a person who is one (or more) of: (i) a retail client
as defined in point (11) of Article 4(1) of Directive 2014/65/EU, as amended (“MiFID II”);or (ii) a customer within the meaning of Directive
2016/97/EU (as amended, the “Insurance Distribution Directive”), where that customer would not qualify as a professional client as defined
in point (10) of Article 4(1) of MiFID II; No key information document required by Regulation (EU) No 1286/2014 (the “PRIIPS Regulation”)
for offering or selling or otherwise making available the Securities to retail investors in the EEA or the UK has been prepared. Offering or
selling the Securities to any retail investor in the EEA or the UK may be unlawful under the PRIIPS Regulation.

In South Africa, the Information does not constitute an offer for the sale of or subscription for, or the advertisement or the solicitation of an
offer to buy, and or subscribe for securities.

To the extent available, the industry, market and competitive position data contained in the Information come from official or third party
sources. Third party industry publications, studies and surveys generally state that the data contained therein have been obtained from
sources believed to be reliable, but that there is no guarantee of the accuracy or completeness of such data. While the Company reasonably
believes that each of these publications, studies and surveys has been prepared by a reputable party, neither the Company nor any of its
subsidiaries or affiliates, or their respective directors, officers, employees, advisers or agents have independently verified the data contained
therein. In addition, certain of the industry, market and competitive position data contained in the Information come from the Company’s own
internal research and estimates based on the knowledge and experience of the Company’s management in the markets in which the
Company operates. While the Company believes that such research and estimates are reasonable and reliable, they, and their underlying
methodology and assumptions, have not been verified by any independent source for accuracy or completeness and are subject to change.
Accordingly, undue reliance should not be placed on any of the industry, market or competitive position data contained in the Information.
The Information does not purport to be comprehensive.

     51                                                                                                                               TFG RESULTS PRESENTATION
                                                                                                                                       FOR THE FULL-YEAR ENDED 31 MARCH 2020
DISCLAIMER

The Information constitutes factual, objective information about the Company and nothing contained herein should be construed as
constituting any form of investments advice or recommendation, guidance or proposal of a financial nature as contemplated in the Financial
Advisory and Intermediary Services Act, 2002 (as amended) (the “FAIS Act”) in respect of the Company or any transaction in relation
thereto. The Company is not (and is not required to be) Financial Services Providers as contemplated in the FAIS Act in South Africa and
the Information must not be construed as constituting the canvassing for, or marketing or advertising of, financial services by the Company
in South Africa.

The Information includes forward-looking statements which include, without limitation, any statements preceded by, followed by or including
words such as “target”, “objective”, “believe”, “expect”, “aim”, “intend”, “may”, “anticipate”, “estimate”, “plan”, “project”, “will”, “can have”,
“likely”, “should”, “would”, “could” and other words and terms of similar meaning or the negative thereof. The forward-looking statements
include targets which have not been reviewed or reported on by the company’s external auditors. The forward-looking statements in the
Information are based on management’s beliefs and projections and on information currently available to them; however, these forward-
looking statements are subject to risks, uncertainties and assumptions about the Company and its subsidiaries and investments, including,
among other things, the performance of their businesses, trends in operating industries, and future capital expenditures. Should risks or
uncertainties materialise, or should any underlying assumptions prove to be incorrect, the Company’s actual financial conditions or results
of operations could differ materially from those described herein as anticipated, believed, estimated or expected. No representation or
warranty is made that any forward-looking statement will come to pass.

  52                                                                                                                       TFG RESULTS PRESENTATION
                                                                                                                           FOR THE FULL-YEAR ENDED 31 MARCH 2020
APPENDICES

53                TFG RESULTS PRESENTATION
                  FOR THE FULL-YEAR ENDED 31 MARCH 2020
OPERATING
     CONTEXT

54               TFG RESULTS PRESENTATION
                 FOR THE FULL-YEAR ENDED 31 MARCH 2020
SOUTH AFRICA:

     South African Macroeconomic Environment                                                                 Commentary

                                                                          Weak GDP growth in 2019 of 0,2%
             GDP
             • -1,4% (Q4 2019 q-o-q)
             • +1,4% (Q4 2018 q-o-q)                                      In line with the rest of the world, GDP is expected to contract by 7% in 2020,
                                                                           before a recovery in 2021 and 2022

                                                                          South Africa eased lockdown restrictions in May and June 2020 which has
             CPI                                                           allowed for a controlled restart of the economy allowing several sectors to
             • 4,1% (March 2020 y-o-y)                                     reopen
             • 4,5% (March 2019 y-o-y)
                                                                          Inflation remains subdued and well within the country’s 3% – 6% target band

             Unemployment                                                 Inflation is expected to ease to 3,6% in 2020 (a multi-year low)
             • 29,1% (Q4 2019)
             • 27,1% (Q4 2018)                                            The loss of SA’s last remaining investment-grade credit rating in March has
                                                                           added pressure on the Rand

             Consumer confidence                                          Load shedding has impacted business confidence but electivity supply is
             • -9 (Q1 2020)
                                                                           expected to remain stable
             • 2 (Q1 2019)
                                                                          Consumer confidence remains weak

             Business confidence                                          Substantial drop in interest rates (in response to COVID-19) together with
                                                                           weaker fuel prices is expected to provide impetus to consumer spending
              • 18 (Q1 2020)
              • 28 (Q1 2019)

          Source: Stats SA, BER, South African Reserve Bank, Bloomberg

55                                                                                                                                 TFG RESULTS PRESENTATION
                                                                                                                                    FOR THE FULL-YEAR ENDED 31 MARCH 2020
UNITED KINGDOM:

 United Kingdom Macroeconomic Environment                                                                       Commentary

             GDP                                                                 Subdued annual GDP growth in 2019 of 1,4%
             • 2,8% (2019 y-o-y)
             • 1,4% (2018 y-o-y)                                                 Latest estimate for GDP growth in Q1 2020, showed that the UK experienced
                                                                                  its worst quarterly decline in output since the 2008 Global Financial Crisis

             CPI                                                                 Forecast UK GDP to be between -7% to -13% in 2020
             • 1,5% (March 2020 y-o-y)
             • 1,8% (March 2019 y-o-y)                                           Business confidence is at record lows

                                                                                 Considerable Government support provided in the hope of stabilising the
                                                                                  economy
             Unemployment
             • 3,8% (Q4 2019)                                                    Due to social distancing measures, Household consumption in the UK
             • 4,0% (Q4 2018)
                                                                                  dropped by 1,7% in Q1 2020, driven by falls in spending on transport,
                                                                                  restaurants and hotels, and importantly, clothing and footwear
             Consumer confidence                                                 Unemployment levels have not yet increased due to the launch of the
             • -9 (Q1 2020)                                                       Government’s Job Retention Scheme
             • 13 (Q1 2019)
                                                                                 The UK has now left the EU and is operating through a transition period
                                                                                  until the end of 2020
             Business confidence
             • -87 (Q2 2020)                                                     The terms of the future trading are still to be agreed, with the transition
             • -23 (Q1 2019)                                                      period potentially to be extended given the focus on combatting COVID-19

 Source: Tradingeconomics.com, Office for National Statistics, GfK, Bloomberg

56                                                                                                                                    TFG RESULTS PRESENTATION
                                                                                                                                      FOR THE FULL-YEAR ENDED 31 MARCH 2020
AUSTRALIA:

        Australia Macroeconomic Environment                                                                          Commentary

                GDP
                                                                                     Moderate GDP growth of 1,8% in 2019
                • 2,2% (March 2020 y-o-y)
                • 1,8% (March 2019 y-o-y)
                                                                                     Current risk of recession due to the impact of COVID-19 with GDP
                                                                                      expected to contract by 10% over H1 2020
                CPI                                                                  Annual inflation rose to 2,2% in Q1 of 2020 from 1,8% in Q4, above
                • 2,2% (March 2020 y-o-y)
                                                                                      expectations. It was the highest rate since Q3 2014 and was impacted by
                • 1,3% (March 2019 y-o-y)
                                                                                      drought, bushfires and early effects of COVID-19

                                                                                     Business confidence index rose to -46 in April 2020 from a record low of -
                Unemployment                                                          65 in March with forecasts predicting -12 in 12 months time
                • 6,2% (March 2020)
                • 5,2% (February 2020)                                               The level of unemployment increased from 5,2% in February to 6,2% in
                                                                                      March but below market expectations

                Consumer confidence                                                  Government assistance packages and easing of restrictions expected to
                • 91,9 (March 2020)                                                   prevent increases in unemployment
                • 98,8 (March 2019)
                                                                                     Wages per employee remain flat

                Business confidence                                                  Consumer sentiment rebounded sharply in May 2020 after social
                                                                                      distancing restrictions were eased, offering hope for a relatively quick
                • -65 (March 2020)
                • 0 (March 2019)                                                      revival in spending

     Source: Reserve Bank of Australia, Australian Bureau of Statistics, Westpac-
          Melbourne Institute – Tradingeconomics.com, National Australia Bank -
                                                         Tradingeconomics.com
57                                                                                                                                         TFG RESULTS PRESENTATION
                                                                                                                                           FOR THE FULL-YEAR ENDED 31 MARCH 2020
FY 2020
     RESULTS

58             TFG RESULTS PRESENTATION
               FOR THE FULL-YEAR ENDED 31 MARCH 2020
CONTINUED CHANGE IN LEGISLATIVE AND
            ACCOUNTING ENVIRONMENT

     TFG AFRICA
     South Africa
     • Amendments to the National Credit Act concerning debt intervention (signed by the
       President on 13 August 2019 but not yet effective)
     • Discussion Document setting out proposed amendments to the National Credit
       Regulations (affordability)
     • Pronouncement of an effective date for the remaining sections of the Protection of Personal
       Information Act.
     Rest of Africa
     • Botswana / Eswatini / Kenya: Data Protection legislation
     • Eswatini: Consumer Credit Amendment Act

     TFG LONDON
     • EU: E-Privacy Regulation
                                                                                                     GROUP
     • EU: Revisions to EU consumer protection laws as a result of the Omnibus Directive (“new
       deal for consumers”)                                                                          • IFRS 16: Retrospectively adopted from 31 March
                                                                                                       2018
     • UK: Brexit and potential impact on legislation
                                                                                                       • Resulted in restatement of statement of financial
     • UK: Ongoing impact of National Living Wage
                                                                                                         position, income statement, statement of
                                                                                                         comprehensive income, statement of changes in
     TFG AUSTRALIA                                                                                       equity and cash flow statement.
     • Federal: First Modern Slavery Reports are due
     • Federal: Proposed Privacy Act amendments to penalties

59                                                                                                                            TFG RESULTS PRESENTATION
                                                                                                                              FOR THE FULL-YEAR ENDED 31 MARCH 2020
ACCOUNTING CHANGES:
          IFRS 16 adopted retrospectively

                                                         FACTORS INFLUENCING                       IFRS16
                                                                                                     IFRS16DOES
                                                                                                            DOESNOT
                                                                                                                 NOTIMPACT
                                                                                                                     IMPACTOUR
                                                                                                                             OUR
               MAIN IMPACT                               THE VOLATILITY OF THE                   UNDERLYING  RETAIL PERFORMANCE
                                                                                                          UNDERLYING  RETAIL
                                                            IFRS 16 EXPENSE                              AND CASH
                                                                                                   PERFORMANCE     FLOWS
                                                                                                                  AND CASH FLOWS

Balance Sheet                                     Length of leases                               Our operational model will remain unchanged
 Recognition of right-of-use assets and lease    Escalation rates                               Cash flow remains unchanged
   liabilities                                    Effective interest rate applied                Minimal impact on earnings
 Opening equity decrease due to restatement      Rate and timing of store openings, closures
Income Statement                                   and lease renewals
 NPAT impact – reversal of rent expense and      Lease types – fixed operating
   recognition of depreciation and interest        to variable cost leases
KPIs                                               (e.g. turnover rentals)
 EBITDA, EBIT, ROCE and debt equity              Concession stores excluded
   impacted

                                                                                                                       TFG RESULTS PRESENTATION
                                                                                                                       FOR THE FULL-YEAR ENDED 31 MARCH 2020
ACCOUNTING CHANGES:
     Illustrative impact of IFRS 16

            Illustrative impact (5yr lease) of the                                            TFG LEASES
            change when adopting IFRS 16
                                                                                              LEASE PORTFOLIO

                IAS 17 VS IFRS 16 IMPACT ON INCOME STATEMENT

                                                                  IAS 17
                                                                  IFRS 16

            1         2           3         4       5
                                Years

                                                                                     1         2-4                5             6+

                IAS 17 VS IFRS 16 IMPACT ON BALANCE SHEET                                            Years of lease

                                                                                 Africa and Australia – mainly 5 year leases
                                                            IFRS 16 ASSET        UK recent trend to shorter and/or turnover
                                                            IFRS 16 LIABILITY     based leases (50% of recent new stores
                                                                                  signed on a turnover basis)
                                                            IAS 17 LIABILITY
                                                                                 Concessions and turnover rental stores
                              Years
                                                                                  excluded
                 0        1      2      3       4       5

61                                                                                                                    TFG RESULTS PRESENTATION
                                                                                                                      FOR THE FULL-YEAR ENDED 31 MARCH 2020
ACCOUNTING CHANGES:
                    Balance sheet impact of IFRS 16

                                                                                                            Debt Equity (Up from 62% to 106%)
                                                                                        18000,0                         124%                                                 140%
                                                                                                                                           118%
                                                                                        16000,0                                                                    106%      120%
                                                                                        14000,0
                                                                                                                                                                             100%
                                                                                        12000,0
                                                                                        10000,0      62%                                                                     80%
                                                                                         8000,0                                                                              60%
                                                                                         6000,0
                                                                                                                                                                             40%
                                                                                         4000,0
                                                                                         2000,0                                                                              20%
                                                                                            0,0                                                                              0%
                                                                                                  Opening          Restated           Mar 19                Mar 20

                                                                                                        NAV      Debt Old      Debt       Ratio Old        Ratio
          NAV –       Asset   Liability   Tax     Operating        Trade     Restated
         1/4/2018                               lease liability   payables

    Opening net debt increased from R8bn to c.R17bn and
     the ratio from 62% to 106%

    The debt equity ratio is distorted by the additional
     lease liability

    On the old basis it remains stable

    62                                                                                                                                            TFG RESULTS PRESENTATION
                                                                                                                                                  FOR THE FULL-YEAR ENDED 31 MARCH 2020
ACCOUNTING CHANGES:
     Income statement impact of IFRS 16 not significant for TFG

               The Income Statement for the 2020 financial year was not impacted significantly
               EBITDA and EBIT calculations will be distorted
63                                                                                                TFG RESULTS PRESENTATION
                                                                                                  FOR THE FULL-YEAR ENDED 31 MARCH 2020
STATEMENT OF FINANCIAL POSITION

                                                                             Restated*             Restated*
                                                          Mar-20    Change     Mar-19    Change      Mar-18
                                                        Reviewed        %     Audited        %      Audited
                                                              Rm                   Rm                    Rm
     Non‐current assets                                  21 403,4       7%    20 087,5      10%     18 254,6
     Current assets                                      20 755,3      18%    17 553,6       6%     16 598,9
     Inventory                                            8 431,1      10%     7 680,9      11%      6 900,6
     Trade receivables ‐ retail                           7 762,4       4%     7 439,8       1%      7 373,6
     Other receivables and prepayments                    1 490,4      30%     1 147,6      40%        821,8
     Concession receivables                                  62,7    (64%)       174,3    (41%)        296,8
     Cash and cash equivalents                            2 969,1    167%      1 111,0     (8%)      1 206,1
     Taxation receivable                                     39,6    100%            -         -           -
     TOTAL ASSETS                                        42 158,7      12%    37 641,1       8%     34 853,5

     EQUITY AND LIABILITIES                              15 942,6     13%     14 049,1      9%      12 878,4

     Non‐current liabilities                             12 447,1     (3%)    12 877,3      15%     11 151,4
     Current liabilities                                 13 769,0      29%    10 714,7     (1%)     10 823,7
     Interest‐bearing debt                                5 849,2      83%     3 196,0    (29%)      4 524,9
     Trade and other payables                             4 786,4      10%     4 363,1      21%      3 597,3
     Lease liabilities                                    3 001,0       6%     2 836,4       9%      2 594,5
     Taxation payable                                       132,4    (59%)       319,2    198%         107,0
     TOTAL LIABILITIES                                   26 216,1      11%    23 592,0       7%     21 975,1

     TOTAL EQUITY AND LIABILITIES                        42 158,7     12%     37 641,1      8%      34 853,5
     * Restated for IFRS 16, refer note 15 in results
64                                                                                                             TFG RESULTS PRESENTATION
                                                                                                               FOR THE FULL-YEAR ENDED 31 MARCH 2020
INCOME STATEMENT

                                                      GROUP                       GROUP Restated*
                                                                  % to turnover                       % to turnover     % change
                                                   March 2020                         March 2019
  Revenue (Rm)                                        38 476,5                            37 128,2                                  3,6
  Retail turnover (Rm)                                35 323,3                            34 101,4                                  3,6
  Cost of sales (Rm)                                 (16 700,1)            47,3          (15 820,8)            46,4                 5,6
  Gross profit (Rm)                                   18 623,2             52,7           18 280,6             53,6                 1,9
  Interest and other income (Rm)                       3 153,2              8,9            3 026,8              8,9                 4,2
  Net bad debt (Rm)                                   (1 275,5)             3,6             (992,8)             2,9               28,5
  Trading expenses (Rm)                              (15 816,2)            44,8          (15 432,0)            45,3                 2,5
  Operating profit (Rm)                                4 684,7             13,3            4 882,6             14,3               (4,1)
  Finance costs (Rm)                                  (1 335,4)             3,8           (1 304,5)             3,8                 2,4
  Profit before tax (Rm)                               3 349,3              9,5            3 578,1             10,5               (6,4)
  Income tax expense (Rm)                               (905,5)             2,6             (937,8)             2,8               (3,4)
  Profit for the year (Rm)                             2 443,8              6,9            2 640,3              7,7               (7,4)
  Effective tax rate (%)                                  27,0                                26,2
* Restated for IFRS 16, refer note 15 in results

   The above income statement is post-IFRS 16

    65                                                                                                                TFG RESULTS PRESENTATION
                                                                                                                      FOR THE FULL-YEAR ENDED 31 MARCH 2020
EXPENSES

                                                                    March 2020    March 2019
                          March 2020    March 2019
Occupancy costs (pre-                                  % change          Local         Local    % change
                                 Rm            Rm
IFRS 16)                                                              currency      currency
 TFG Africa                   2 445,9       2 365,4           3,4
 TFG London                     778,8         807,7         (3,6)         41,4          44,9         (7,7)
 TFG Australia                1 045,1         955,9           9,3        103,7          95,6           8,5
 Group                        4 269,8       4 129,0           3,4

% to Group turnover             12,1           12,1

                                                                    March 2020    March 2019
                          March 2020    March 2019
 Depreciation (pre-IFRS                                % change          Local         Local    % change
                                 Rm            Rm
 16)                                                                  currency      currency
 TFG Africa                     562,9         557,9           0,9
 TFG London                     165,2         185,0        (10,7)           8,8          10,3       (14,5)
 TFG Australia                  100,4         101,2         (0,8)          10,0          10,1        (1,6)
 Group                          828,5         844,1         (1,8)

 % to Group turnover              2,3            2,5

 66                                                                                                          TFG RESULTS PRESENTATION
                                                                                                             FOR THE FULL-YEAR ENDED 31 MARCH 2020
EXPENSES

                                                                 March 2020   March 2019
                        March 2020    March 2019
                                                    % change          Local        Local   % change
                               Rm            Rm
Employment costs                                                   currency     currency
TFG Africa                  3 416,4       3 411,0          0,2
TFG London                  1 364,1       1 378,4        (1,0)         72,6         76,6        (5,3)
TFG Australia               1 531,1       1 391,6        10,0         151,9        139,1          9,2
Group                       6 311,6       6 181,0          2,1

% to Group turnover            17,9          18,1

                                                                 March 2020   March 2019
                        March 2020    March 2019
                                                    % change          Local        Local   % change
                               Rm            Rm
Other operating costs                                              currency     currency
TFG Africa                  2 674,1       2 570,5         4,0
TFG London                  1 902,7       1 877,6         1,3         101,2        104,4        (3,0)
TFG Australia                 413,6         371,2        11,4          41,0         36,2        13,3
Group                       4 990,4       4 819,3         3,6

 % to Group turnover          14,1         14,1

 67                                                                                                     TFG RESULTS PRESENTATION
                                                                                                        FOR THE FULL-YEAR ENDED 31 MARCH 2020
SCENARIO PLANNING
          Key economic scenario assumptions

 As part of a detailed scenario planning exercise, TFG has assessed the impact of different macro and
  market variables on operating and financial performance in FY21 and FY22 including the potential scenarios
  of a ‘Slow Recovery’ and a ‘Second Wave and Slow Recovery’
 These scenarios are provided for illustrative purposes and do not constitute a forecast or guidance or
  represent the full range of, or likely, potential scenarios or economic outcomes that may result

  Slow recovery      • April 2020 lockdown – overall FY      • U-shaped recovery in 2022
                       turnover substantially down for TFG
                       Africa on FY2020 actual               • No dividends (FY2021 and
                                                               FY2022)
                     • Reduced capex and working capital
                       aligned to weaker environment

 Second wave and     • April 2020 lockdown                   • Reduced capex and working capital
  slow recovery                                                aligned to weaker environment
                     • Re-enter lockdown in 2020 and
                       overall FY turnover substantially     • U-shaped and weaker recovery in
                       down for TFG Africa on FY2020           2022
                       actual
                                                             • No dividends (FY2021 and FY2022)
  68                                                                                               TFG RESULTS PRESENTATION
                                                                                                   FOR THE FULL-YEAR ENDED 31 MARCH 2020
CREDIT
     STATISTICS

69                TFG RESULTS PRESENTATION
                  FOR THE FULL-YEAR ENDED 31 MARCH 2020
CREDIT KEY RATIOS

                                                                                                                                                 Value pre
                                                                                                TFG AFRICA            TFG AFRICA                COVID-19
                                                                                                March 2020             March 2019    % Growth   adjustment
Key indicators

Number of applications                                                                               2 187 310          1 959 665      11,6%
Accept rates                                                                                            36,9%              45,0%
Number of new accounts                                                                                 805 505            881 509       -8,6%
Number of active accounts (‘000)                                                                       2 788,7            2 725,9        2,3%
Credit turnover (Rm)                                                                                   9 208,6            9 444,5       -2,5%
Credit sales growth %                                                                                    -2,5%              -3,1%
Credit % of total turnover                                                                              40,9%              43,3%
Gross debtors’ book (Rm)                                                                               9 748,4            9 291,4       4,9%
Overdue values % to debtors’ book                                                                          14,7               13,4
Buying position %                                                                                          78,3               81,6
Gross bad debt write off year-on-year growth                                                                22,2              8,3
Net bad debt write-off as % of credit transactions                                                          10,3              7,8
Recoveries year-on-year growth                                                                               -6,8            17,4
Allowance for impairment at reporting date year-on-year growth*                                             7,3              12,6                       -3,0
Allowance for impairment as % of debtors book                                                            20,4%             19,9%                      18,4%
Net bad debt as a % of debtors’ book                                                                       13,1              10,7                       11,1
* Allowance for impairment at reporting date year-on-year growth for 2019 calculated after implementation of IFRS 9

  70                                                                                                                                             TFG RESULTS PRESENTATION
                                                                                                                                                  FOR THE FULL-YEAR ENDED 31 MARCH 2020
BRAND
     OVERVIEW

71              TFG RESULTS PRESENTATION
                FOR THE FULL-YEAR ENDED 31 MARCH 2020
BUSINESS OVERVIEW

                               UPPER MARKET
                      MID TO
               UPPER MARKET

                                         MID MARKET

                                                 VALUE MARKET

72                                                              TFG RESULTS PRESENTATION
                                                                FOR THE FULL-YEAR ENDED 31 MARCH 2020
OUR
     FOOTPRINT

73               TFG RESULTS PRESENTATION
                 FOR THE FULL-YEAR ENDED 31 MARCH 2020
OUR FOOTPRINT

                                 Number of outlets - Group
 4 500
 4 000
 3 500                                                                            4 034      4 085   4 083
 3 000
                                                                        3 328
 2 500                                                          3 125
                                                        2 724                    Australia
 2 000                                                                          expansion
 1 500                                   1 979   2 111
                         1 727   1 857
 1 000   1 539   1 627                                UK expansion
   500
     0
         2009    2010    2011    2012    2013    2014    2015    2016   2017      2018       2019    2020

74                                                                                                           TFG RESULTS PRESENTATION
                                                                                                             FOR THE FULL-YEAR ENDED 31 MARCH 2020
TFG INTERNATIONAL FOOTPRINT

                                              Sweden              08       01

                             Ireland & UK
                                                                          02    Estonia
                             214        465
                                                   12
                                                        Netherlands             01        Latvia

                                                             53         Germany
                            Belgium           05
                                   20                   36         08      Switzerland
     USA    02     37
                              Spain                                                                                                                                                      13
                                                                                                                                                                                               Japan
                                                                                                                                                   South Korea            02
                                                                                      Kuwait         09
                                                                                                                   Qatar
           14    Mexico                                                                                                                  Hong Kong      19        02
                                                                                 Bahrain            03
                                                                                                                   12    UAE

                                                                                                              01
                                                                               Saudi Arabia                        Oman                                      02   Macau
                                                                                                         09

                                                                                               04
                                                                                                    Kenya
                                                                                     31                                                                      01
                                                                                                                                       Singapore   08
                                                                                            Zambia
                                                                           27
                                                                                  Botswana
                                                   Namibia 103
                                                                                     12
                                                                                               Eswatini
                                                                                                                                                                                   487        25
                                                                                                                                                                       Australia
                                                                                          12
                                                                                                 Lesotho

                                                                       2 388 South Africa
                                                                                                                                                                                                                     30

                                                                                                                                                                                                       New Zealand
                                                                                                                        TFG’s number of stores
                                                                                                                        TFG’s number of concessions

75                                                                                                                                                                                 TFG RESULTS PRESENTATION
                                                                                                                                                                                    FOR THE FULL-YEAR ENDED 31 MARCH 2020
TFG INTERNATIONAL FOOTPRINT

             2 577                           972                            534
          TFG AFRICA OUTLETS            TFG LONDON OUTLETS           TFG AUSTRALIA OUTLETS

     64% Contribution to turnover   21% Contribution to turnover   15% Contribution to turnover

76                                                                                TFG RESULTS PRESENTATION
                                                                                   FOR THE FULL-YEAR ENDED 31 MARCH 2020
TFG AFRICA FOOTPRINT

                                                     SOUTH AFRICA    TOTAL        STORES        CONCESSION
                                                     Gauteng             706          706                             0
     COUNTRY    TOTAL        STORES    CONCESSIONS
 South Africa      2 388       2 388            0    Western Cape        426          426                             0

 Namibia            103         103             0    Kwazulu-Natal       282          282                             0

 Zambia                 31       31             0    Eastern Cape        209          209                             0

 Botswana               27       27             0    Mpumulanga          203          203                             0

 Lesotho                12       12             0    Limpopo             185          185                             0

 Eswatini               12       12             0    Free State          150          150                             0

 Kenya                   4        4             0    North West          137          137                             0

                                                     Northern Cape           90        90                             0

77                                                                                          TFG RESULTS PRESENTATION
                                                                                            FOR THE FULL-YEAR ENDED 31 MARCH 2020
TFG LONDON FOOTPRINT

     EUROPE          TOTAL   STORES   CONCESSIONS   AUSTRALASIA    TOTAL    STORES   CONCESSIONS

     UK & Ireland     679       214           465   Hong Kong         21        19             2
     Switzerland       44        8             36   Japan             13         0            13
     Germany           53        0             53   Singapore          9         1             8
     Spain             20        0             20   Australia          8         0             8
     Netherlands       12        0             12   Macau              2         0             2
     Sweden             9         1             8   South Korea        2         0             2
     Belgium            5         0             5
                                                    NORTH AFRICA   TOTAL    STORES   CONCESSIONS
     Estonia            2         0             2
                                                    UAE                12       0             12
     Latvia             1         0             1
                                                    Kuwait              9       0              9
                                                    Saudi Arabia        9       0              9
     NORTH AMERICA   TOTAL   STORES   CONCESSIONS   Qatar               5       0              5
     USA               39        2             37   Bahrain             3       0              3
     Mexico            14        0             14   Oman                1       0              1

78                                                                                                 TFG RESULTS PRESENTATION
                                                                                                   FOR THE FULL-YEAR ENDED 31 MARCH 2020
TFG AUSTRALIA FOOTPRINT

                  AUSTRALIA     TOTAL   STORES   CONCESSIONS

                  Australia      504      479             25
                  New Zealand     30       30              0

79                                                             TFG RESULTS PRESENTATION
                                                               FOR THE FULL-YEAR ENDED 31 MARCH 2020
20
     RESULTS
             20
PRESENTATION
FOR THE FULL YEAR ENDED 31 MARCH 2020
You can also read