20 CHARTS FOR 2020 NEI MARKET OUTLOOK - NEI 2020 MARKET OUTLOOK - NEI Investments

Page created by Lee Myers
 
CONTINUE READING
20 CHARTS FOR 2020 NEI MARKET OUTLOOK - NEI 2020 MARKET OUTLOOK - NEI Investments
20 CHARTS
FOR 2020
NEI MARKET OUTLOOK

NEI 2020 MARKET OUTLOOK   1
20 CHARTS FOR 2020 NEI MARKET OUTLOOK - NEI 2020 MARKET OUTLOOK - NEI Investments
Great global uncertainty leads to… record high stock prices?
Opinions as of December 13, 2019

It’s been said many times that “markets hate                   our global sub-advisors. In one form or another, the            As we look forward to the 2020s, we expect climate
uncertainty.” Well, not in 2019.                               charts we’ve included speak to the following main points:       change and other responsible investing themes to
                                                                                                                               dominate the financial headlines. These themes will
In fact, data to November 30 show the S&P 500 hit 19             • We do not expect a global recession as central              become more important to our political, regulatory and
new highs in 2019 and is on track to end the year with a           banks maintain accommodative policies, with room            financial systems, creating opportunity for those willing
total return of roughly 28% in U.S. dollar terms. The              for governments to add fiscal stimulus if needed.           to adapt and risks for those who are not. As Canada’s
S&P/TSX Composite has also been notching record                                                                                leader in responsible investing, we welcome these
highs as it closes in on a year-to-date total return of 22%.     • Stocks are likely to rise further, but we don’t             changes and believe the 2020s will be a decade of true
And it’s not just equities powering ahead. Bonds have              expect next year’s returns to be as impressive as           impact, where responsible investors can help improve
also had a strong year, with some markets delivering               last year’s.                                                the world’s environmental and social conditions in
double-digit returns (as well as negative yields…).                                                                            meaningful ways.
                                                                 • Longer term, we expect equity leadership to rotate
All this at a time of record policy uncertainty; the U.S.-         out of the U.S. and into international and emerging
China trade war; the slowest global economic growth                markets, but we need more concrete evidence the
since the Great Recession; the neverending saga known              global economy is rebounding before taking a
as Brexit; and a U.S. president facing impeachment and             stronger stance.
an election. And now we can finally add this: a growing
acknowledgement of the risk of climate change to the             • Given global uncertainties, bonds will continue to
financial system, courtesy of global central banks.                be an important part of portfolios, but expect lower
                                                                   returns than what we got in 2019.

So, what’s next?                                                 • We expect the policy response to climate change to
                                                                   rise ever higher on the priority list of global financial
To help you prepare for client conversations about what            leaders, which will in turn find its way into asset                              John Bai, CFA
could be in store for markets next year, we offer 20               prices, with both positive and negative impacts.                                 VP and Chief Investment Officer
charts for 2020, assembled in collaboration with many of                                                                                            NEI Investments

      2020
NEI 2020   MARKET
         MARKET     OUTLOOK
                OUTLOOK                                                                                                                                                                    2
20 CHARTS FOR 2020 NEI MARKET OUTLOOK - NEI 2020 MARKET OUTLOOK - NEI Investments
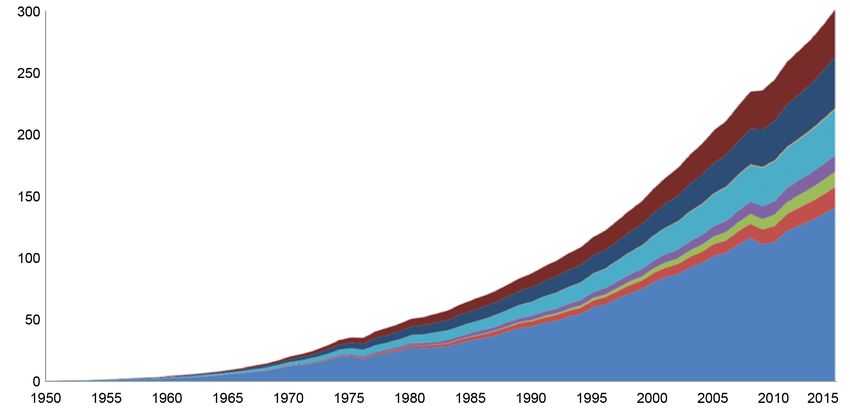
2019: A strong year for most asset classes
Stocks and bonds performed exceptionally well in 2019. Many indices closed not just at or near the highest level of the year,
but at or near their highest levels on record.

YTD performance of 20 asset classes
30%
25%
20%
15%
10%
 5%
 0%
 -5%
-10%

                                                                                                                                                                                                                                                                                                                                               Gold
                                                                                                                                       International Equity

                                                                                                                                                                                                                                           US HY Bonds

                                                                                                                                                                                                                                                                                                                             Crude Oil (WTI)
                                                                                                                                                                                                                  Emerging Market Equity
                                   US Large Cap Equity

                                                                                     Developed Market Equity

                                                                                                                                                                                                                                                                                                                                                                                                         USD (vs. CAD)

                                                                                                                                                                                                                                                                                                                                                                                                                         EUR (vs. CAD)
                                                         Canadian Large Cap Equity
          Global Equity (Growth)

                                                                                                                                                                                                                                                                                                                                                      Commodities (BoC Index)

                                                                                                                                                                                                                                                                                                                                                                                USD (Trade Weight)
                                                                                                                                                              Global Equity (Value)

                                                                                                                                                                                                                                                                             US IG Bonds

                                                                                                                                                                                                                                                                                                             Canadian Cash
                                                                                                                 US Small Cap Equity

                                                                                                                                                                                                                                                         Canadian IG Bonds
                                                                                                                                                                                      Canadian Small Cap Equity

                                                                                                                                                                                                                                                                                           Global IG Bonds
                                                                                                               EQUITIES                                                                                                                                                  FIXED INCOME                                                      COMMODITIES                                               CURRENCIES
Source: Bloomberg and Morningstar, data as of November 30, 2019.

      2020
NEI 2020   MARKET
         MARKET     OUTLOOK
                OUTLOOK                                                                                                                                                                                                                                                                                                                                                                                                                  3
20 CHARTS FOR 2020 NEI MARKET OUTLOOK - NEI 2020 MARKET OUTLOOK - NEI Investments
The economic backdrop

        While we do not see recession on the horizon, we do
        expect continued slower global growth in 2020

        Downside risks remain elevated as uncertainty abounds

      2020
NEI 2020   MARKET
         MARKET     OUTLOOK
                OUTLOOK                                         4
Secular trends point to slower growth ahead in developed economies
Shrinking workforce + declining productivity growth = lower potential growth across developed economies. Expect this to
result in lower equity returns and the ongoing suppression of bond yields.

Working age population as % of total population                                             Annual change in GDP per hour worked

70%                                                                                          3.0%

                                                                                             2.5%
68%
                                                                                             2.0%

66%
                                                                                             1.5%

                                                                                             1.0%
64%

                                                                                             0.5%

62%
                                                                                             0.0%

60%                                                                                         -0.5%
      1971   1976      1981     1986      1991    1996     2001     2006     2011                   Canada       France   Germany     Italy     Japan         UK        US

              Canada          Euro Area      Japan        US        All OECD                         1995-2000        2000-2005     2005-2010     2010-2014        2014-2018

Source: Organization for Economic Cooperation and Development, data accessed November 30, 2019.

      2020
NEI 2020   MARKET
         MARKET     OUTLOOK
                OUTLOOK                                                                                                                                                        5
Global growth increasingly driven by emerging economies
The growth and maturation of emerging economies will present ever-increasing investment opportunities outside
North America.

World economy breakdown
                                                                                                                          • Emerging economies made
100%
                                                                                                                            up only 25% of the world’s
                                                                                                                            economy in 1980
                                                                                                                          • By the end of 2019, emerging
75%
                                                                                                                            economies are expected to
                                                                                                                            make up 40% of world GDP

50%

25%

  0%
       1980     1984       1988       1992        1996      2000        2004     2008         2012   2016   2020   2024

                                             Advanced Economies          Emerging Economies

Source: International Monetary Fund, data accessed November 30, 2019.

      2020
NEI 2020   MARKET
         MARKET     OUTLOOK
                OUTLOOK                                                                                                                                    6
Emerging economies expected to grow at twice the pace of developed economies
Over the next year, the anticipated economic rebound in emerging economies could lead to outperformance of EM equities,
debt and currencies.

             World                                         DM                   EM            • Economic growth likely to
                                                                                                slow further for developed
                                                                                                economies in 2020
                                                                         4.9                  • Emerging economies
     3.8                                                                                        expected to rebound slightly
                                                                                       4.4
                                                                                4.2
                3.2         3.2                                                                 in 2020
                                                                                              • Gap between developed and
                                                                                                emerging markets is expected
                                                2.2                                             to widen, though downside
                                                            1.7                                 risks continue to dominate
                                                                  1.4

    2018       2019        2020                2018        2019   2020   2018   2019   2020

Source: Amundi Research forecast, data as of November 4, 2019.

      2020
NEI 2020   MARKET
         MARKET     OUTLOOK
                OUTLOOK                                                                                                        7
U.S. economic growth driven by strong consumer spending
Despite the presence of global macro headwinds, a strong domestic economy will likely prevent a U.S.-led recession in 2020.

University of Michigan Consumer Sentiment Index
                                                                                                                                          • Consumer confidence is an
120                                                                                                                                 100
                                                                                                                                            important leading indicator,
                                                                                                                                    90      used to estimate future
                                                                                                                                    80
                                                                                                                                            consumption behaviour
100
                                                                                                                                    70
                                                                                                                                          • Confidence tends to stem
                                                                                                                                            from job security and wage
                                                                                                                                    60
                                                                                                                                            satisfaction, providing insight
  80                                                                                                                                50      into the labour market
                                                                                                                                    40

                                                                                                                                    30
  60
                                                                                                                                    20

                                                                                                                                    10

  40                                                                                                                                0
    1978          1983           1988           1993           1998           2003           2008           2013          2018
                   U.S. Recession

Source: Surveys of Consumers, University of Michigan, University of Michigan: Consumer Sentiment © [UMCSENT], retrieved from FRED, Federal Reserve Bank of St. Louis;
https://fred.stlouisfed.org/series/UMCSENT, November 19, 2019.

      2020
NEI 2020   MARKET
         MARKET     OUTLOOK
                OUTLOOK                                                                                                                                                       8
Uptick in key leading indicator a sign of hope
Some Composite Purchasing Managers’ Indices may have bottomed in September 2019, with a continued rebound acting
as a potential driver of further equity upside.

Composite Purchasing Managers’ Indices
                                                                                                                                • Germany and the larger
56
                                                                                                                                  eurozone showing a notable
55                                                                                                                                bounce-back
                                                                                                                                • China, emerging markets
54
                                                                                                                                  rising since June 2019
53                                                                                                                              • Developed markets overall
                                                                                                                                  still headed lower – but for
52
                                                                                                                                  how long?
51

50

49

48
Nov 2018 Dec 2018     Jan 2019   Feb 2019 Mar 2019   Apr 2019 May 2019   Jun 2019    Jul 2019   Aug 2019 Sep 2019    Oct 2019
     Developed Markets        US        Eurozone     Germany      Emerging Markets         China       Expansion/contraction

Source: Bloomberg, data as of November 30, 2019.

      2020
NEI 2020   MARKET
         MARKET     OUTLOOK
                OUTLOOK                                                                                                                                          9
Policy uncertainty at record high, driven by trade tensions
The abatement or escalation of historically high trade tensions can have a significant impact on markets on a
day-to-day basis.

U.S. Categorical Policy Uncertainty Index
                                                                                                                                   • Current concern over trade
2,000
                                                                                             Monetary policy
                                                                                                                                     policy is having a greater impact
1,800
                                                                                             Fiscal Policy
                                                                                                                                     on overall sentiment than any
1,600                                                                                        National security
                                                                                                                                     other factor in recent past
                                                                                             Trade policy                          • Risk of U.S./China trade tension
1,400
                                                                                             Sovereign debt, currency crises         spreading to other regions –
1,200                                                                                        U.S. Recession                          notably Europe and Japan – has
1,000                                                                                                                                hurt business and investor
                                                                                                                                     sentiment
 800

 600

 400

 200

    0
     1997            2000            2003            2006            2009             2012              2015             2018

Source: “Measuring Economic Policy Uncertainty” by Scott Baker, Nicholas Bloom and Steven J. Davis at www.PolicyUncertainty.com.

      2020
NEI 2020   MARKET
         MARKET     OUTLOOK
                OUTLOOK                                                                                                                                            10
                                                                                                                                                                   10
Monetary and fiscal policy

        Central banks have responded to slowing growth by
        lowering interest rates and increasing balance sheets

        Additional stimulus from fiscal policy is available if needed

        Central banks are increasingly turning their attention to
        climate change as a key risk to financial stability

      2020
NEI 2020   MARKET
         MARKET     OUTLOOK
                OUTLOOK                                                 11
                                                                        11
U.S. Fed rate cuts may neutralize once-reliable recession indicator
Proactiveness of U.S. central bank is another reassuring sign that a recession may not come just yet.

U.S. yield curve, Federal Reserve rate, and recessions
                                                                                                              • Inverted yield curve (dark blue
400bps
                                                                                                                line falling below orange line)
                                                                                                        20%     has consistently preceded past
300bps
                                                                                                                recessions
200bps                                                                                                        • Overly tight monetary policy
                                                                                                        15%
                                                                                                                stifles economic growth, and a
100bps                                                                                                          closer look reveals the Fed has
                                                                                                                raised rates in the lead-up to
                                                                                                        10%
   0bps                                                                                                         each yield curve inversion
                                                                                                              • This time, the Fed has cut rates
-100bps
                                                                                                        5%      prior to August 2019 yield curve
-200bps
                                                                                                                inversion, preventing a longer
                                                                                                                and more pronounced period of
-300bps                                                                                                 0%      inversion.
       1979            1985             1991       1997            2003          2009            2015

                                  U.S. Recession     2s10s (LHS)          Fed Funds Rate (RHS)

Source: Bloomberg, data as of November 30, 2019.

      2020
NEI 2020   MARKET
         MARKET     OUTLOOK
                OUTLOOK                                                                                                                       12
                                                                                                                                              12
How much lower can central banks go?
With rates at rock bottom (and below zero), central banks will have to forego a primary policy tool for combatting crisis
conditions like what we saw in 2008.

Central bank policy rates
                                                                                                                       • 2019 saw another wave of
9%
                                                                                                                         global central bank easing amid
8%                                                                                                                       softening economic data and
7%                                                                                                                       escalating trade uncertainty
6%                                                                                                                     • Most developed nations
5%                                                                                                                       already have policy rates below
4%
                                                                                                                         the rate of inflation, meaning
                                                                                                                         majority of policy rates around
3%
                                                                                                                         the world are actually negative
2%
                                                                                                                         in real terms
1%

0%

-1%
   2006    2007     2008     2009       2010   2011      2012    2013     2014   2015   2016   2017   2018   2019

       Eurozone             Australia              Canada               Japan           South Korea      New Zealand
       Norway               Sweden                 Switzerland          UK              US               China

Source: Bloomberg, data as of November 30, 2019.

      2020
NEI 2020   MARKET
         MARKET     OUTLOOK
                OUTLOOK                                                                                                                               13
                                                                                                                                                      13
New ECB president may help shift focus to fiscal policy in eurozone
Christine Lagarde may attempt to improve coordination between monetary and fiscal policies.

Public investment as % of GDP
                                                                                                                          • Christine Lagarde took over as
6.0                                                                                                                         ECB president in November,
                                                                                                                            making the case for investing
5.0                                                                                                                         “in a common future that is
                                                                                                                            more productive, more digital
4.0                                                                                                                         and greener”
                                                                                                                          • Eurozone austerity measures
3.0
                                                                                                                            since 2011 have brought down
                                                                                                                            the amount of public investment
2.0                                                                                                                         as % of GDP, so this has
                                                                                                                            significant room to grow
1.0

0.0
   1995      1997       1999      2001       2003        2005     2007   2009      2011       2013      2015       2017

              Germany           Ireland          Spain          France     Italy          Netherlands          Portugal

Source: Eurostat, data accessed November 2019.

      2020
NEI 2020   MARKET
         MARKET     OUTLOOK
                OUTLOOK                                                                                                                                  14
                                                                                                                                                         14
Central banks acting on climate change
Almost 50 central banks and regulators have formed Central Banks and Supervisors’ Network for Greening the Financial
System, defining best practices in climate risk management.

Number of Central Banks that have adopted environmental activities by type
55                                                                                                                                    The importance of climate-related
                                                                                                                                      issues for financial stability and
                       Green network membership
                                                                                                                                      monetary policy have become
45                     Green lending guidelines or green bond program
                                                                                                                                      increasingly clear. This is
                       ESG risk incorporation
                                                                                                                                      particularly true for Canada, where
35                                                                                                                                    resources play a vital role in our
                                                                                                                                      economy and where the natural
25
                                                                                                                                      environment is a defining feature
                                                                                                                                      of our national identity.”

15                                                                                                                                          – Bank of Canada Governor
                                                                                                                                                        Stephen Poloz
 5

       2007     2008      2009      2010     2011      2012     2013      2014      2015     2016      2017     2018      2019
 -5

Source: Bloomberg https://www.bloomberg.com/news/articles/2019-09-23/no-laughing-matter-how-climate-change-is-scaring-central-banks

      2020
NEI 2020   MARKET
         MARKET     OUTLOOK
                OUTLOOK                                                                                                                                               15
                                                                                                                                                                      15
Bonds

        We don’t expect double digit returns to repeat in 2020 –
        we’d likely need a recession for that

        We emphasize more defensive positioning:

          • Higher quality investment grade credit
          • Shorter duration

      2020
NEI 2020   MARKET
         MARKET     OUTLOOK
                OUTLOOK                                            16
                                                                   16
Core bond yields expected to stay low
Yields should stay in a low range as major developed economies continue to experience slow growth next year; expect bond
volatility around trade concerns.

Inflation – developed economies                                                                 10-year bond yields – developed economies
4%                                                                                               4%

3%                                                                                               3%

2%                                                                                               2%

1%                                                                                               1%

0%                                                                                               0%

-1%                                                                                             -1%
   2014        2015        2016       2017        2018          2019       2020       2021         2014         2015        2016         2017        2018   2019    2020   2021
             Canada         U.S.       Eurozone          U.K.          Japan      Target                               Canada        U.S.       Eurozone    U.K.   Japan

Source: Bloomberg. Inflation data as of October 31, 2019; bond yield data as of November 30, 2019. 2019–2021 projections are based on Bloomberg consensus
estimates. Bloomberg consensus estimates for both inflation and bond yields are indicated with dotted lines.

      2020
NEI 2020   MARKET
         MARKET     OUTLOOK
                OUTLOOK                                                                                                                                                      17
                                                                                                                                                                             17
Respect credit cycles
U.S. firms are more leveraged than ever, but this risk is not currently reflected in credit spreads.

U.S. corporate debt versus credit spreads
49                                                                                                                                                                                                                                          18
                                                                                                                                                                                                                                                 • Historically, high yield
                                                                                                                                                                                                                                                   spreads have been closely
                                                                                                                                                                                                                                            16
47
                                                                                                                                                                                                                                                   correlated with an increase in
                                                                                                                                                                                                                                            14     corporate debt
45                                                                                                                                                                                                                                          12   • Since the 2008 financial crisis,
                                                                                                                                                                                                                                                   loose monetary policy has
                                                                                                                                                                                                                                            10
43                                                                                                                                                                                                                                                 lowered borrowing costs and
                                                                                                                                                                                                                                            8      encouraged corporations to
41                                                                                                                                                                                                                                          6      take on more debt
                                                                                                                                                                                                                                            4
39
                                                                                                                                                                                                                                            2

37                                                                                                                                                                                                                                          0
     1987
            1988
                   1989
                          1990
                                 1991
                                        1992
                                               1993
                                                      1994
                                                             1995
                                                                    1996
                                                                           1997
                                                                                  1998
                                                                                         1999
                                                                                                2000
                                                                                                       2001
                                                                                                              2002
                                                                                                                     2003
                                                                                                                            2004
                                                                                                                                   2005
                                                                                                                                          2006
                                                                                                                                                 2007
                                                                                                                                                        2008
                                                                                                                                                               2009
                                                                                                                                                                      2010
                                                                                                                                                                             2011
                                                                                                                                                                                    2012
                                                                                                                                                                                           2013
                                                                                                                                                                                                  2014
                                                                                                                                                                                                         2015
                                                                                                                                                                                                                2016
                                                                                                                                                                                                                       2017
                                                                                                                                                                                                                              2018
                                                                                                                                                                                                                                     2019
                   U.S. Recessions                                   U.S. Nonfinancial corporate debt/GDP (% LHS)                                                             U.S. high yield spread (% RHS)

Source: Haver Analytics, Ned Davis Research, Bloomberg, QV Investors. Data as of December 1, 2019.

      2020
NEI 2020   MARKET
         MARKET     OUTLOOK
                OUTLOOK                                                                                                                                                                                                                                                             18
                                                                                                                                                                                                                                                                                    18
Stocks

        We expect equities to outperform bonds over
        the next year

        Regionally, we see opportunity in international
        and emerging market equities

        From a style perspective, value may be making
        a comeback

      2020
NEI 2020   MARKET
         MARKET     OUTLOOK
                OUTLOOK                                   19
                                                          19
U.S. by far the strongest stock market since 2009 crisis low
The longest bull market on record has helped drive the S&P 500 to a gain of more than 300%, while the S&P/TSX Composite,
MSCI World and MSCI Emerging Market indices have lagged significantly.

Total equity returns for major regions (C$)
350%

                      Canada
300%
                      U.S.

250%                  International
                      Emerging Markets
200%

150%

100%

 50%

  0%

-50%
    2009               2010              2011      2012   2013   2014   2015        2016       2017        2018

Source. Bloomberg, data as of November 30, 2019.

      2020
NEI 2020   MARKET
         MARKET     OUTLOOK
                OUTLOOK                                                                                              20
                                                                                                                     20
International equities: comparable earnings growth, cheaper valuations
While rest of the world has lagged the U.S. in terms of historical equity performance, the fundamentals favour international
equities going forward.

Equity characteristics: U.S. versus rest of world
                                                                                                                                            101.0%

            S&P 500
            ACWI Ex US

                                                                                                                                                      63.0%

                                                                      23.2x                      20.8x
     15.9%                                                                         17.0x                    16.1x        16.5x
                                                                                                                                   10.4x
                                      6.7%         6.7%
                   0.6%

   EPS Growth (trailing)           EPS Growth (forward)           Price/Earnings (trailing)   Price/Earnings (forward)   Price/Cash Flows     Debt/Equity

Source: Factset, data as of November 2019. Index shown for comparison purposes only.

      2020
NEI 2020   MARKET
         MARKET     OUTLOOK
                OUTLOOK                                                                                                                                       21
                                                                                                                                                              21
Lower interest rates supportive of equities
Equity risk premiums (ERP) have risen globally versus year-ago levels; ERP around the world suggest equity markets
outside the U.S. hold more opportunity.

The equity risk premium is the
difference between the earnings                                    CANADA
                                                                 ERP Sep 2019:
yield and the 10-year U.S.                                                                              U.K.                              CHINA
                                                                                                                                       ERP Sep 2019:
Treasury, representing the “extra”                                  5.8%                            ERP Sep 2019:

return you receive for owning                                                                          7.6%                               5.8%
equities over bonds.

                                                                                                                     GERMANY
                                                U.S.                                                                ERP Sep 2019:
                                            ERP Sep 2019:                                                                                                 JAPAN
                                                                                                                       8.3%                            ERP Sep 2019:
                                                4.2%                                                                                                      7.8%

                                                                   BRAZIL
                                                                 ERP Sep 2019:
                                                                                                                        AUSTRALIA
                                                                    0.8%                                               ERP Sep 2019:
    > 7%
    5% – 7%                                                                                                               5.1%
    < 5%

Numbers may not sum due to rounding. Source: FactSet, MSCI and AB, data as of September 30, 2019.

      2020
NEI 2020   MARKET
         MARKET     OUTLOOK
                OUTLOOK                                                                                                                                                22
                                                                                                                                                                       22
Canadian equity dividend yield higher than long bond yield
Investors can earn better income from stocks than bonds, but volatility risks are higher with stocks.

S&P/TSX dividend yield versus 10-year Govt Canada bond yield
                                                                                                                                                                                                                                                                                                     • Bond yields and inflation have
20
                                                                                                                                                                                                                                                                                                       both been falling on a secular
18                                                                                                                                                                                                                                                                                                     basis since the early 1980’s
16
                                                                                                                                                                                                                                                                                                     • The dividend yield on the
14                                                                                                                                                                                                                                                                                                     Canadian stocks have slowly
12                                                                                                                                                                                                                                                                                                     risen over the past twenty years
10                                                                                                                                                                                                                                                                                                   • On a cross-asset class basis,
 8                                                                                                                                                                                                                                                                                                     data suggest stocks are likely
 6                                                                                                                                                                                                                                                                                                     the better investment from a
 4
                                                                                                                                                                                                                                                                                                       yield perspective, though full
 2
                                                                                                                                                                                                                                                                                                       equity valuations plus elevated
                                                                                                                                                                                                                                                                                                       macro risk warrant a cautious
 0
                                                                                                                                                                                                                                                                                                       approach
                       Aug-83
                                Nov-84

                                                           Aug-88
                                                                    Nov-89

                                                                                               Aug-93
                                                                                                        Nov-94

                                                                                                                                   Aug-98
                                                                                                                                            Nov-99

                                                                                                                                                                       Aug-03
                                                                                                                                                                                Nov-04

                                                                                                                                                                                                           Aug-08
                                                                                                                                                                                                                    Nov-09

                                                                                                                                                                                                                                               Aug-13
                                                                                                                                                                                                                                                        Nov-14

                                                                                                                                                                                                                                                                                   Aug-18
                                                                                                                                                                                                                                                                                            Nov-19
              May-82

                                                  May-87

                                                                                      May-92

                                                                                                                          May-97

                                                                                                                                                              May-02

                                                                                                                                                                                                  May-07

                                                                                                                                                                                                                                      May-12

                                                                                                                                                                                                                                                                          May-17
     Feb-81

                                         Feb-86

                                                                             Feb-91

                                                                                                                 Feb-96

                                                                                                                                                     Feb-01

                                                                                                                                                                                         Feb-06

                                                                                                                                                                                                                             Feb-11

                                                                                                                                                                                                                                                                 Feb-16
                                                                                TSX Dividend Yield                                                      Canada Long Bond Yield

Source: Bloomberg, data as of November 2019.

      2020
NEI 2020   MARKET
         MARKET     OUTLOOK
                OUTLOOK                                                                                                                                                                                                                                                                                                                 23
                                                                                                                                                                                                                                                                                                                                        23
Value stocks underperformance versus growth stocks near record levels
Value stocks displaying compelling risk/reward characteristics

Rolling 10-year total return difference: FAMA-French HML (value vs growth)
                                                                                                                                               • Relative to growth, value
14%                                                                                                                                              is experiencing its weakest
12%
                                                                                                                                                 performance in nearly
                                                                                                                                                 8 decades
10%
                                                                                                                                               • Underperformance gap
 8%                                                                                                                                              between value and growth
                                                                                                                                                 exceeds that of the tech
 6%
                                                                                                                                                 bubble and is second only to
 4%                                                                                                                                              the Great Depression
 2%                                                                                                                                            • Opportunities to find quality
                                                                                                                                                 and value have opened up in
 0%
                                                                                Tech Bubble                                                      industrials, financials and
-2%                                                                                                                                              energy sectors
                  Great Depression                                                                              Recently
-4%
   1936    1941    1946   1951    1956    1961    1966   1971    1976    1981    1986   1991    1996    2001    2006   2011    2016

Source: Kenneth French, QV Investors, Data as of December 31, 2018: http://mba.tuck.dartmouth.edu/pages/faculty/ken.french/data_library.html

      2020
NEI 2020   MARKET
         MARKET     OUTLOOK
                OUTLOOK                                                                                                                                                          24
                                                                                                                                                                                 24
The global plastics problem – an opportunity for the responsible investor
From 1950 to 2015, plastic waste production has soared across major sectors.

                                           Other
                                           Textiles                                                                                          The transition to a more
                                                                                                                                             sustainable economy presents
Primary Plastic Waste Generation (in Mt)

                                           Industrial Machinery
                                           Consumer & Institutional Products                                                                 opportunities for investors and
                                           Electrical/Electronic                                                                             risks to companies that choose
                                           Building & Construction                                                                           to ignore strong trends in
                                           Transportation                                                                                    changing consumer preferences
                                           Packaging                                                                                         for more sustainable products,
                                                                                                                                             advances in technology and
                                                                                                                                             innovation, changing global
                                                                                                                                             regulations, and the impact of
                                                                                                                                             larger societal factors.”

Source: Cosmos Magazine, “Global plastic waste totals 4.9 billion tonnes,” July 20, 2017: https://cosmosmagazine.com/society/global-plastic-waste-totals-4-9-billion-tonnes; GEYER, JAMBECK, LAW,
‘SCIENCE ADVANCES’, JULY 2017.

      2020
NEI 2020   MARKET
         MARKET     OUTLOOK
                OUTLOOK                                                                                                                                                                         25
                                                                                                                                                                                                25
The “first corporate casualty of climate change”
California-based utility company PG&E named the “first corporate casualty of climate change” by The Wall Street Journal
after it sought bankruptcy protection in January 2019.

Stock Price of PG&E
                                                                                                         • PG&E named the “first
80
                                                                                                           corporate casualty of climate
                                                   California wildfires of late 2017 among
70                                                              most damaging on record                    change” by The Wall Street
                                                                                                           Journal
60                                                                                                       • After facing more than
                                                                                                           US$30 billion in liabilities
50
                                                                                                           related to wildfires, PG&E
40
                                                                                                           sought bankruptcy protection
                                                                   PG&E faces deeper scrutiny over
                                                                                                           in January 2019
30                                                              responsibility for 2017/2018 wildfires   • The utility company has been
20
                                                                                                           found responsible for the
                                                                                                           destruction of hundreds of
10                                                              PG&E seeks bankruptcy protection
                                                                                                           acres of land
                                                                                     in Jan 2019
 0
  2006                      2009                   2012                   2015                  2018

Source: Bloomberg. Data as of November 27, 2019.

      2020
NEI 2020   MARKET
         MARKET     OUTLOOK
                OUTLOOK                                                                                                                    26
                                                                                                                                           26
Too few companies reacting to the challenges of climate change
The Transition Pathway Initiative says 21% of companies do not disclose enough information to allow investors to understand
their exposure to the transition to a low-carbon economy, presenting an opportunity for shareholder engagement.

Alignment to Paris Agreement benchmarks by sector
100%
              1               1                              2                              2                                            2020 should be the year when a
                              1              1
 90%
              3                                                                             2
                                                                                                                                         strategic focus on climate change
                                                                             5
 80%                          4
                                                                                                           12                            becomes a necessity and those
                                                                                            2
                                                                                                                                         companies who are ahead of the
 70%
                                                            10                                                                           trend should flourish. Investors
                                             4                               4
 60%                                                                                                                                     can play an important part in this
                                                                                                            8                 9
 50%
                                                                                            9                                            by engaging with companies to
             14                                                              3                                                           facilitate and encourage the
 40%
                             14                                                                                                          transition, particularly in those
 30%                                                                                                                                     sectors which continue to lag.”
                                                            10                                             16
 20%                                         3                               7              8
 10%
              2                                                                                                               1
  0%
                              1                                                                             1
           Airlines         Autos        Aluminium        Cement           Paper           Steel        Electricity     Oil & Gas

                  No disclosure       Not aligned       Paris aligned      2 degrees aligned        Below 2 degrees aligned

Source: http://www.lse.ac.uk/GranthamInstitute/tpi/wp-content/uploads/2019/07/TPI-State-of-Transition-Summit-presentation-20190712.pdf

      2020
NEI 2020   MARKET
         MARKET     OUTLOOK
                OUTLOOK                                                                                                                                                  27
                                                                                                                                                                         27
Summary
        We do not expect a global recession as central banks maintain accommodative
        policies, with room for governments to add fiscal stimulus if needed.
        Stocks are likely to rise further, but we don’t expect next year’s returns to be as
        impressive as last year’s.
        Longer term, we expect equity leadership to rotate out of the U.S. and into
        international and emerging markets, but we need more concrete evidence the
        global economy is rebounding before taking a stronger stance.
        Given global uncertainties, bonds will continue to be an important part of
        portfolios, but expect lower returns than in 2019.
        We expect the policy response to climate change to rise ever higher on the
        priority list of global financial leaders, which will in turn find its way into asset
        prices, with both positive and negative impacts.

      2020
NEI 2020   MARKET
         MARKET     OUTLOOK
                OUTLOOK                                                                         28
                                                                                                28
Summary
        As we look forward to the 2020s, we expect climate change and other responsible
        investing themes to dominate the financial headlines.
        These themes will become more important to our political, regulatory and financial
        systems, creating opportunity for those willing to adapt and risks for those who are not.
        As Canada’s leader in responsible investing, we welcome these changes and believe
        the 2020s will be a decade of true impact, where responsible investors can help
        improve the world’s environmental and social conditions in meaningful ways.

      2020
NEI 2020   MARKET
         MARKET     OUTLOOK
                OUTLOOK                                                                             29
                                                                                                    29
The bottom line

                              We remain optimistic the economic cycle
                              will continue to be supportive of stocks over
                              bonds, though as always, we take a balanced
                              approach in our portfolio solutions to insulate
                              investors from ongoing volatility and the
                              potential for a more pronounced downturn.

      2020
NEI 2020   MARKET
         MARKET     OUTLOOK
                OUTLOOK                                                         30
                                                                                30
The outlook

                              As we look forward to the 2020s, we
                              expect responsible investing themes to
                              dominate the financial headlines creating
                              opportunity for those who are willing
                              to adapt and risks for those who are not.

      2020
NEI 2020   MARKET
         MARKET     OUTLOOK
                OUTLOOK                                                   31
                                                                          31
neiinvestments.com
Commissions, trailing commissions, management fees and expenses all may be associated with mutual fund investments. Please read the prospectus and/or Fund Facts before
investing. Mutual funds are not guaranteed, their values change frequently and past performance may not be repeated. NEI Investments is a registered trademark of Northwest &
Ethical Investments L.P. Northwest & Ethical Investments Inc., is a wholly-owned subsidiary of Aviso Wealth Inc. (“Aviso”). Aviso is a wholly-owned subsidiary of Aviso Wealth
Limited Partnership (“Aviso Wealth LP”), which in turn is owned 50% by Desjardins Financial Holdings Inc. (“Desjardins”) and 50% by a limited partnership owned by the five
Provincial Credit Union Centrals (the “Centrals”) and the CUMIS Group Limited.

Views expressed regarding a particular security, industry or market sector should not be considered an indication of trading intent of any funds managed by NEI Investments.
This material is for informational and educational purposes and it is not intended to provide specific advice including, without limitation, investment, financial, tax or similar matters.
Please consult with your own professional advisor on your particular circumstances.
The views expressed herein are subject to change without notice as markets change over time. NEI Investments endeavors to ensure that the contents have been compiled or
derived from sources that we believe are reliable and contain information that is accurate and complete. However, NEI Investments makes no representation or warranty, express
or implied, in respect thereof, takes no responsibility for any errors and omissions contained herein.

      2020
NEI 2020   MARKET
         MARKET     OUTLOOK
                OUTLOOK                                                                                                                                                                       32
You can also read