20 Years nitrogen dynamics study by using APSIM nitrogen model simulation for sustainable management in Jilin China - Nature
←
→
Page content transcription
If your browser does not render page correctly, please read the page content below
www.nature.com/scientificreports
OPEN 20 Years nitrogen dynamics
study by using APSIM nitrogen
model simulation for sustainable
management in Jilin China
Nazia Tahir1,2, Jumei Li1*, Yibing Ma1,3, Aman Ullah1, Ping Zhu4, Chang Peng4,
Babar Hussain1 & Subhan Danish5
The tremendous increase in industrial development and urbanization has become a severe threat to
the Chinese climate and food security. The Agricultural Production System Simulator model was used
to simulate soil nitrogen in black soil in Yangling Jilin Province for 20 years. The observed values are
consistent with the simulated values. The predicted values of total soil NO3−–N and NH4+–N nitrogen
are 10 kg ha−1 and 5 kg ha−1 higher than the observed values. The total soil NO3−–N loss has the same
trend as the rainfall, and it increases with the number of rainfall days over the years. The average
20 years losses of NO3−–N and NH4+–N observed were 1375.91 kg ha−1, and 9.24 kg ha−1, while in the
simulation increase was 1387.01 kg ha−1 and 9.28 kg ha−1, respectively. The difference between the
observed and simulated values of NO3−–N and NH4+–N of mean loss was 11.15 kg ha−1 and 0.04 kg ha−1
respectively. Moreover, our findings highlight the opportunity further to improve management
policies (especially for nitrogen) to maintain crop yield.
Global agricultural intensification significantly increased food production over the last decade, driven by
increased fertilizer use and irrigation1. By 2050 the world will need 70–100% more food2,3, China must feed
20% of the world’s population with 7% of the world’s arable land and 6% of its water resources. A recent study
on global climate change has shown significant changes by w arming4. The intergovernmental panel on climate
change (IPCC) fifth assessment reported that the earth surface temperature had been continuously increasing
in the past three decades. Around 1880 and 2012, the global average temperature increased by 0.85 degrees Cel-
sius, and the temperature rise from 1951 to 2012 was nearly double that of 1880–19505. The regional and global
weather conditions are expected to become more change than present, with the increasing flood, hailstorm,
drought, and other climatic c hanges6. By bringing in greater crop yield variability, local food supplies, and higher
landslide and erosion damage risks, they can adversely affect food supply stability and food safety. In addition,
the rates and levels of the predicted warming may increasing the historical experience in some r egions6,7. China
has encountered one of the most significant challenges in the twentieth century in trying to maintain increased
annual cereal production to about 600 Mt by 2030 and to assure food security with diminishing cropland and
limited resources while improving soil fertility and protecting the environment. Chinese farmers have been
switched from a traditional farming system to advance which was accumulated with efficient utilization of dif-
ferent crop rotation, intercropping, and all possible nutrients (e.g., nitrogen (N), phosphorus (P), potassium (K),
and Sulphur (S) resources to the usage of synthetic fertilization8. So, there is an urgent need for long-term field
experiments to understand productivity, soil nutrients, crop management, weather processes & interactions, and
to maintain sustainable agricultural management in the future. Some trends of soil processes cannot be consist-
ently determined during short-term studies and may be visualized over a period of time9. Disproportionate and
uninterrupted addition of ammonium or urea-based N fertilizers in crop production caused soil acidification.
It also changes soil chemical properties10, that can minimize biodiversity, hinder nutrient cycling and release
potentially lethal metals into water and plants, leading to environmental pollution, soil degradation and reduced
1
Institute of Agricultural Resources and Regional Planning, Chinese Academy of Agricultural Sciences, 12
Southern Street of Zhongguancun, Beijing 100081, China. 2Department of Agronomy, Gardan Campus, Abdul
Wali Khan University, Mardan, Khyber Pakhtunkhwa, Pakistan. 3Macau Environmental Research Institute, Macau
University of Science and Technology, TaipaMacau 999078, China. 4Jilin Acadmey of Agricultural Science, Jilin
City, China. 5Department of Soil Science, Faculty of Agricultural Sciences and Technology, Bahauddin Zakariya
University, Multan 60800, Punjab, Pakistan. *email: lijumei@caas.cn
Scientific Reports | (2021) 11:17505 | https://doi.org/10.1038/s41598-021-96386-5 1
Vol.:(0123456789)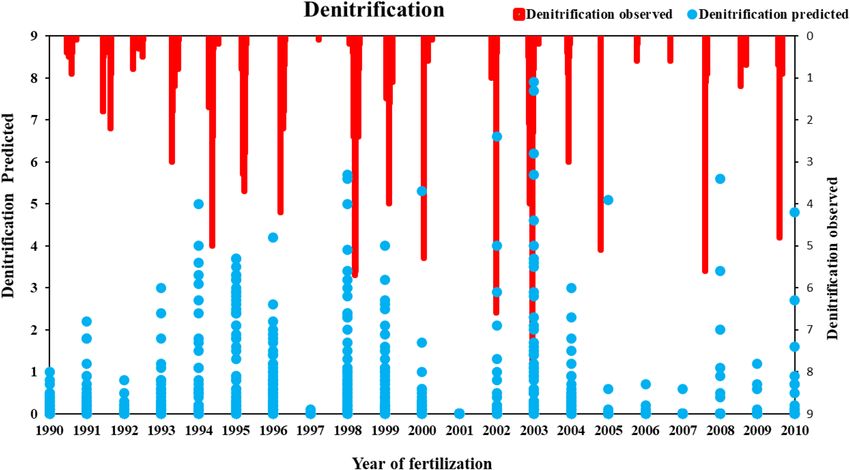
www.nature.com/scientificreports/
crop yield8,9,11–13. Soil type and topography are relatively constant within time, while land use and vegetation are
influenced by anthropogenic activities and climate14. Therefore, China had big challenge with food security15.
Agricultural production plays a significant role in global climate change16. China’s food production is highly
dependent on irrigation, but water scarcity has challenged irrigated a griculture17. Agricultural production has a
significant impact on global climate c hange16. Approximately 65% of global nitrous oxide (N2O) emissions are
from agricultural soils. this primarily comes from nitrogen (N) fertilizer, which is misused at the national level
and the optimization of N management, therefore, a target for sustainable agriculture18. Furthermore, large inputs
of mineral N fertilizer above crop demands can result in low N use efficiency and lead to several negative impacts
on the environment, such as surface water eutrophication, groundwater nitrate pollution, soil acidification, and
emitting greenhouse gases. Such environmental problems are getting worse because mineral N fertilizer will
increase predictably in the future19.
APSIM (Agricultural Production Systems Simulator) is a software system that provides a versatile framework
for simulating climate and soil management effects on crop growth in agricultural systems and soil resource
changes. APSIM’s predictive accomplishment for soil water and nitrate nitrogen simulation in contrasting soils
(clay loamy) and environments20. APSIM allows modular configuration of crop models, pastures, soil water,
nutrients, and erosion to simulate the different production systems21. Many variables, including weather fluctua-
tions, will restrict producers’ revenues and reduce yield by moderate inputs22. A key feature of APSIM, which
differentiates it from other models, is the soil’s central position rather than the crops. In response to manage-
ment and weather, alteration in the status of soil state variables are simulated crops constantly come and go,
find the soil in a given state and leave it in a changed state. Another aspect is its integrated structure: high order
mechanisms (i.e., soil water balance, crop production and soil N dynamics) as distinct modules. Several process-
based models are in use or are being developed, for example, A PSIM23, DAISY24, DNDC24, and W NMM25.
These models present the ability to examine the role of particular process towards system outputs. They help to
understand better that how environmental conditions shared with management strategies interrelate to control
N cycling and losses. However, the conceptualization of N transformations in APSIM and DNDC models are
different. DNDC is a microbial growth model. APSIM defines denitrification and nitrification processes using
equations of empirical reaction conveyed using Michaelis Menten type e quation26. APSIM model correlated
well with measurements (r = 0.97), while NZ-DNDC performed well on the Otago soils (r = 0.83 and 0.92 for
Wingatui and Otokia, r espectively24. Much of the code that comprises the APSIM SOILWAT and soil nitrogen
has developed from prior experiences with, firstly, models of the CERES family, notably CERES-Maize27 and,
secondly, PERFECT28 was primarily established to create the effects of erosion on productivity of vertisols in
the Australian subtropics but did not address N. PERFECT involved schedules for simulating impacts of surface
residues on soil runoff and evaporation. Surface residues decay was modelled as a simple time function. The
CERES models treat and residues from previous crops as integrated into the soil and therefore cannot involve
any effect on soil water balance from surface residues. CERES deals with nitrogen, and the simulation of fresh
residue decomposition takes into account the residue ratio C: N and the moisture and temperature environ-
mental factors. These models’ code had been re-engineered into discrete modules. APSIM was a broadly used
model of the agro-ecosystems. It stimulates plant growth on a daily basis, based on incoming solar radiation and
depends on both water content and Nitrogen supply. In APSIM the standard model for soil, water uses a tipping
bucket approach29. It simulates nitrate movement linked to the vertical water flow, and eventually drainage and
leaching. Evapotranspiration potential is calculated using Priestley Taylor27 and the runoff is calculated using
an approach to the USDA soil curve number.
This study aimed to study the dynamics of nitrogen fertilization and its effect on nitrification and denitri-
fication. The vertical movement of nitrate in soil was investigated. To explore the novelty of the simulation, to
observe and predict future nitrogen loss under the same conditions of nitrate content change, to reduce the
20-year environmental consequences and its impact on nitrogen loss, the nitrogen model was calibrated and
validated. New to this study is examining nitrogen dynamics and its response to the environment and the use
of the APSIM nitrogen model.
Materials and methods
Site description and experimental data. Data for the study was measured from the long-term soil
monitoring research station in Gongzhuling-Jilin, China. The province is located between (43° 30′ 23′ N, 124°
48′ 33′ E) latitude and longitude while the altitude of (220 m) the study area in China. Jilin’s mean annual tem-
perature and precipitation were found as 4–5 °C & 500 mm with cool temperate, highly continental, and 13.5 °C
& 1000 mm respectively. The crop was maize and which holds a relatively large area and main crop. The soil type
is clay loam, and pH was 7.6. The organic carbon C (g kg−1), Total N (g kg−1), Total P (mg kg−1), Available N (kg
ha−1), Available P (mg k g−1), Available K (mg k g−1) were 20, 1.34, 0.546, 15.3, 10, 119. Soil pH was measured
in a 1:5 soil: ratio, the organic carbon g kg−1 was measured by the walkley wet combustion method30, total N
measured by the Kjeldahl method31, available P with 0.5 M NaHCO332, and exchangeable K with N ammonium
acetate33. The long-term experimental sites in Gongzhuling, Jilin, China was measured from 1990 to 2010. To
check the -long-term status on the soil nitrogen dynamic and s improve this soil better for estimating the pol-
lution level and crop productivity. A composite soil was selected for the soil sampling, and the soil was sampled
in October every year, up to the depth of 20 cm, and for APSIM modeling, simulation depth was kept at up to
180 cm. The APSIM soil parameters include soil property and hydrodynamic values; these values were calcu-
lated by the formula. These values were used by APSIM nitrogen model to simulates soil properties and nutrient
cycling by each soil layer.
Scientific Reports | (2021) 11:17505 | https://doi.org/10.1038/s41598-021-96386-5 2
Vol:.(1234567890)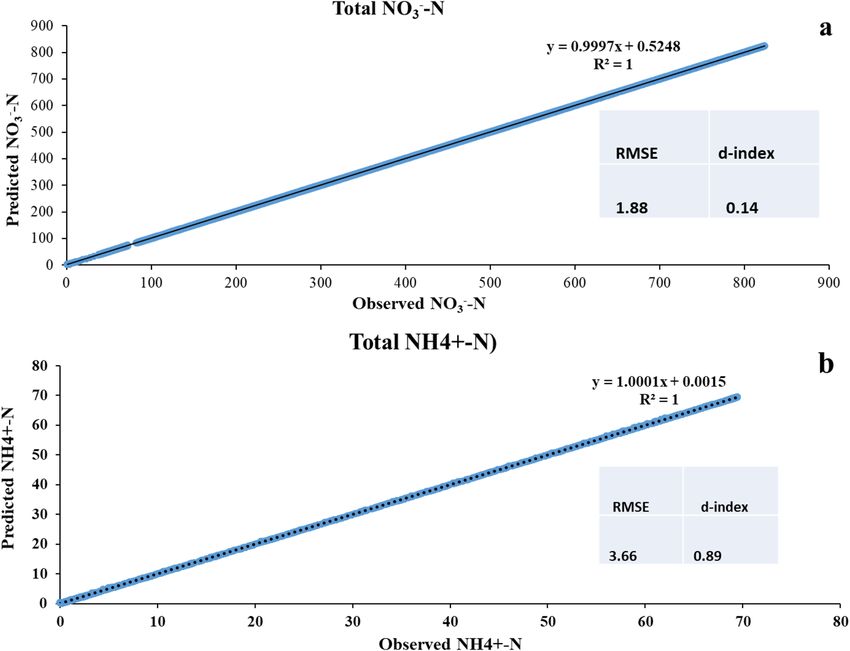
www.nature.com/scientificreports/
S. no Modules Abbreviation of Model Modle name References
35
CERES
1 Soil water SoilWat 28
PERFECT
a 42
2 APSWIM
43
3 Soil nitrogen SoilN CERES
44
4 Maize AUSIM maize
Table 1. List of APSIM Modules used in the study and simulate in the nitrogen model. Intellectual property
remains that of the original developer. APSWIM (APSIM-Soil water infiltration and movement) it measures
soil water behavior in APSIM. a Four modules, a soil–water module (SOILWAT2), the soil nitrogen module
(SOILN2) and the fertilizer module (FERTILIZ), and a specific crop module (APSIM-maize).
Soil layers (cm) 1 2 3 4 5 6 7
Maize LL (mm/mm) 0.11 0.14 0.16 0.17 0.19 0.2 0.2
Maize KL (/day 0.08 0.08 0.08 0.08 0.06 0.04 0.03
Maize XF (0–1) 1 1 1 1 1 1 1
Table 2. Crop’s LL = lower limit (water content at -15 bar pressure potential), KL = rate of water extraction XF
parameters of the APSIM model at Jilin site. There are seven layers in from 0 to 180 cm.
Weather module in APSIM. Daily weather data were collected from a weather station 50 m away from
the experimental site, including daily maximum temperature (Tmax), minimum temperature (Tmin), sunshine
period, and precipitation between 1990 and 2010. The sunlight period was transformed into solar radiation
using the Ångstrom formula34.Historical weather data were downloaded from China’s meteorological sharing
service network (http:/cdc.cma.gov.cn/). The essential module for the simulation of the APSIM model is the
meteorological module (APSIM met generator). Temperature (Tav), the maximum amplitude of the monthly
average temperature (Amp), time (year and day); Tav and Amp for each location were calculated by the software
included with APSIM 7.135. The weather file was created by following the below link in APSIM https://www.
apsim.info/support/apsim-training-manuals/creating-an-apsim-met-file-using-excel/.
It runs daily weather data as an input file, i.e., daily maximum and minimum temperature, rainfall, and solar
radiation. The Tav (annual average ambient temperature) is about 5.82 °C, and Amp (annual amplitude in mean
monthly temperature) is 39.5 °C. The line graph with variation showed the minimum recorded amount of yearly
precipitation. The total precipitation from 1990 to 2010 is 17,560.1 mm. The total precipitation was 587.3 mm in
1990, 251.22 mm in 1995, 283.8 mm in 2000, 334.7 mm in 2005, and 389.3 mm in 2010. The regression analysis
over 20 years with the precipitation was ( r2 = 0.9977) maximum temperature ( r2 = 0.0001) and minimum tempera-
ture was ( r2 = 5E−05). The Precipitation trend analysis showed that the ( r2 = 0.997) over 20 years and significantly
changed was observed in Table S5.
APSIM model overview. APSIM includes a series of modules that simulate biological and physical pro-
cesses in farming systems, including crop growth, soil water, and carbon and nitrogen dynamics due to climate
variation and interaction20. This analysis performed in APSIM version 7.5. Maize crop production is measured
as a function of photoperiod-modified thermal time (Table 1). The Agricultural Production Systems Simula-
tor (APSIM) is a modular modeling framework that has been developed by the Agricultural Production Sys-
tems research unit in A ustralia36. Four modules, a soil–water module (SOILWAT2), the soil nitrogen module
(SOILN2) and the fertilizer module (FERTILIZ), and a specific crop module (APSIM-maize), were linked within
APSIM to simulate the cases described in this paper (Table 2). APSWIM is based on the numerical solution
of the equation of Richards coupled with the formula of convection dispersion to the movement of the model
solute. The APSIM model’s application is based on the ‘standalone’ SWIMv2.1 (soil water infiltration and move-
ment)37. Soil water properties parameterization for APSWIM includes specification of the relationships of mois-
ture characteristics and hydraulic conductivity in each soil layer. Runoff is handled by considering the roughness
of the soil.
The ability to hold surface water might be change over time, e.g., increasing due to agricultural practice or
decreasing due to raindrop effects. The surface roughness of soil also effects rainfall effect. This also varies in
response to tillage performance. The soil–water module (SOILWAT2) is a model of water balance in c ascades23,29.
Water movement is defined as using separate saturated or unsaturated flow algorithms23. In this module, the
redistribution of solutes, such as nitrate- and urea-N, is done. Evaporation is a two-stage process based on
potential evaporation (Priestly-Taylor) (energy-limited and water-limited). The APSIM model is distinctive to
soil organic matter. The CERE model divided the soil organic matter into two subgroups: fresh organic matter
(FOM) and humus (HUM), which boosts the microbial pool. HUM, is not susceptible to decomposition; this is
specified as Finert (Figs. 1a, 2b).
Although soil microbial biomass only represents a small part of organic matter, it has a significant effect on
itrogen38,39. The APSIM soil pH module provided a representation of soil acidification
the nutrient cycle and soil n
Scientific Reports | (2021) 11:17505 | https://doi.org/10.1038/s41598-021-96386-5 3
Vol.:(0123456789)www.nature.com/scientificreports/
Figure 1. (a) Volumetric water content and whereas (SAT) is the saturated water content, (DUL) is the field
water holding capacity and lower water absorption limit (LL15) (b) Soil SOC (soil organic carbon), fraction of
biomass_C, inert_C,and volumetric water content in soil profile in Jilin. The data was from initial soil sample
collected from Jilin.
and how pH changes are disseminated through the profile due to cation and anion absorption imbalances, nitrate
leaching, and changes in soil organic matter content40 and soil pH refers to the proton b alance41. APSIM’s evo-
lution was primarily as a modeling framework for climate response and management simulation of cropping
systems. Soil nitrogen is the module that simulates nitrogen mineralization and thus the N supply available to a
soil crop and residues/roots from previous c rops29. The model observed value for N O3−–N was 15 kg h a−1, and
NH+–N was 0 kg ha−1, while in predicted N O3−–N was 25 kg ha−1 and NH4+–N was 5 kg ha−1. Fertilizer amount
N, P, and K at a soil monitoring station in Gongzhuling, Jilin from 1990 to 2010 for NPK treatment N kg ha−2
was 165 kg ha−2, P2O5 82.5 kg ha−2, and K2O 82.5 kg ha−2. The Control has no fertilizer.
APSIM parameterization. The soil module parameterization is critical to correctly simulate the nitro-
gen and water balance of the soil–crop system. The soil textures, drained upper limits (DUL) and lower limits
(LL15) obtained from laboratory measurements were used to set these parameters. The initial water content was
selected to the soil water storage capacity. The crop was maize, and the soil organic carbon and nitrogen value
is written in the site description in the material method. The initial surface residue was zero, and the organic
matter pool name was maize.
Vertical movement in the soil profile of nitrate. To check the distribution of nitrate through the soil
profile, throughout the depth after 31 days of fertilization, and again after five months. To visualize this, we cre-
ated a depth plot. Two values needed for depth plot, the “dlayer” variable. It holds the depth of each variable.
Scientific Reports | (2021) 11:17505 | https://doi.org/10.1038/s41598-021-96386-5 4
Vol:.(1234567890)www.nature.com/scientificreports/
Figure 2. The APSIM observed and simulated NO3−–N of 7 layers of the soil under the same weather condition
with different ammonia and nitrate levels at Gongzhuling, Jilin. The R2 values showed significant change among
the years over 20 years in predicted and observed data.
O3−–N and NH4+–N as a variable (layered)
The layered variables were always kept in arrays form. We included N
and not as total.
Soil parameters in APSIM. There are two soil parameters such as hydrodynamic parameters and soil
property. The different models in APSIM simulate nutrient cycling and soil properties by soil layers. These vari-
ous soils can also give of different results and all the changes that happened in the layers. This obliged the study
of the vertical soil distribution of nitrogen and water dynamic changes in the complete soil profile and root zone.
The average saturated water content of the 0–180 cm soil depth is 59.1%, the field water holding capacity is 47%,
and the soil bulk density is 1.07 g cm−3. The soil organic carbon, soil microbial biomass, and passivated organic
matter was shown in Fig. 1a, and the soil hydrodynamic parameters are shown in Fig. 1b. The soil properties
Scientific Reports | (2021) 11:17505 | https://doi.org/10.1038/s41598-021-96386-5 5
Vol.:(0123456789)www.nature.com/scientificreports/
S. no Observed Predicted Change in observed and predicted
Essential soil water 286.73 286.73 0.00
Total NO3−–N (kg ha−1) 1375.86 1387.01 11.16
Total NH4+–N (kg ha−1) 9.24 9.28 0.04
NO3−–N (1) (kg ha−1) 378.65 379.04 0.39
NO3−–N (2) (kg ha−1) 217.42 217.75 0.32
NO3−–N (3) (kg ha−1) 356.63 357.70 1.07
NO3−–N (4) (kg ha−1) 239.69 241.37 1.67
NO3−–N (5) (kg ha−1) 113.89 116.12 2.23
NO3−–N (6) (kg ha−1) 49.74 52.36 2.62
NO3−–N (7) (kg ha−1) 19.83 22.68 2.84
NH4+–N (1) (kg ha−1) 8.49 8.49 0.00
NH4+–N (2) (kg ha−1) 0.30 0.30 0.00
NH4+–N (3) (kg ha−1) 0.29 0.30 0.01
NH4+–N (4) (kg ha−1) 0.16 0.16 0.01
NH4+–N (5) (kg ha−1) 0.00 0.01 0.01
NH4+–N (6) (kg ha−1) 0.00 0.01 0.01
NH4+–N (7) (kg ha−1) 0.00 0.01 0.01
Denitrification (kg ha−1) 0.06 0.06 0.00
Urea (kg ha−1) 3.58 3.58 0.00
Table 3. 20-years average soil NO3−–N and N H4+–N, essential soil water and urea and denitrification losses in
the soil layer from 1 to 7 in observed and predicted values.
were modified based on the measured values at other locations. The hydrodynamic parameters are calculated in
conjunction with the parameters of the soil properties. Equations 1 are as follows:
SAT = 1 − BD/2.65 − 0.05 (1)
here SAT is the saturated water content, DUL is the field water holding capacity, BD is the soil bulk density, and
2.65 is the soil-specific gravity. The soil pH was 7.6; bulk density was 1.07 and change to 1.35 up to the depth of
180 cm. The total depth was divided into seven layers. SAT and DUL reduced with the depth from (59 to 49) %
and (47 to 39) %. Depth layer is the soil layers divided into seven layers from top to bottom as shown in Fig. 1a.
Crop parameters in APSIM. The crop in the study site was maize. The maize module also involves two
crops, soil parameters, namely the crop’s lower water absorption limit (LL) and the crop water absorption coef-
ficient (KL) at various root depths. LL characterizes the residual value of crops after different soil water depths
after the water supply was discontinued during the vigorous crop growth period. KL characterizes the day-to-
day absorption of effective moisture by crop layer. Since there was no measured value of LL, LL15 was used
instead of LL, and only KL is adjusted. Since there was no moisture calculation in this experiment, KL’s estimate
was based on the APSIM estimation process and value in Australia (Table 3).
Statistical analysis. Model calibration and validation. To test the accuracy of modeled, soil nitrogen data
was compared with observed and simulated data and correlate with various measures such as45. These included
the (R2) and (RMSE) coefficient of determination, root mean square error. To determine model performance,
we calculated the following four indicators: coefficient of determination (R2), Root Mean Square Error (RMSE),
and index of agreement (D-index). Willmott concordance index (d) describes the deviation between observed
and predicted values. If d = 1, it means that the model performance is perfect while d = 0, it indicates a model for
which the mean square error is just matching the variability in the observed.
n
2
RMSE =
Oi − pi /n (2)
i=1
n 2
i=1 (Oi − Pi)
d = 1 − n 2 (3)
i=0 IPi − IOi + IOi − OI))
In our study, the crop was maize, the average sowing date and maturity date was observed from the field
ith46 dates. Calibration is a significant
of long-term of Gongzhuling (43° 30′ N, 124° 48′ E), it was validated w
step for the adjustment of model parameters under location agro-climatic conditions. The model calibration of
the phonological parameters of maize, sowing dates, and harvesting dates were observed values of the site. The
model was run when soil and weather data of the site was input and the year of the simulation was from 1990 to
Scientific Reports | (2021) 11:17505 | https://doi.org/10.1038/s41598-021-96386-5 6
Vol:.(1234567890)www.nature.com/scientificreports/
Figure 3. (a) APSIM total NO3−–N observed and simulated with R2 value and RMSE. where R 2 represents
the coefficient of determination and RMSE (root mean square error). (b) APSIM observed and simulated total
NH4+–N with two different scenarios under the same weather condition and fertilizer inputs. The observed and
H4+–N calibration with R
simulated changes over 20 years of fertilization observed and predicted total N 2 and
RMSE (root mean square analysis).
2010. The model was parameterized through adjustment of soil and crop and weather file factors for maximum
matching of observed and simulated data. The field result was used for the model calibration from the 1990–2010
field experiment with model outputs. In this step, for the parameterization of the models, we used the derived
parameter. The process of calibration followed phases: soil data, climate data, fertilizer data, and crop data. We
then used the supplementary data set to independently validate the models. For calibration and validation, we
analysed the goodness-of-fit among models observed and simulated the values of nitrogen and total nitrate and
total ammonia as well as denitrification. In addition, the conventional R 2 regression is for comparison calcula-
tion of the mathematical (least-squares decision coefficient), which is fundamental, which is vital when testing
simulation model output.
Regression. We used SPSS to check the regression model for estimating the climatic change in precipitation,
temperature. We also used trend analysis to check the change in 20 years.
Plant material collection and use permission. No permission is required for plant material as it was
purchased from certified dealer of local area.
Ethics approval and consent to participate. We all declare that manuscripts reporting studies do not
involve any human participants, human data, or human tissue. So, it is not applicable.
Complies with international, national and/or institutional guidelines. Experimental research and
field studies on plants (either cultivated or wild), comply with relevant institutional, national, and international
guidelines and legislation.
Results
Model performance. The performance of APSIM model calibration in terms of maize simulation, N
dynamic, soil water, and losses of NO3−–N and NH4+–N from the soil zones shown in Figs. 1a, 2, 3 and 4. APSIM
was able to capture the maize crop by adjusting the soil and climatic phenomena. Comparison of soil N dynam-
ics, NO3−–N, NH4+–N predictions and observations in simulated maize season. APSIM can capture maize crops
by adjusting soil and climate phenomena. The model also correctly simulates the dynamics of N O3−–N and
NH4+–N, as shown in Fig. 4. Calibration model parameters were based on nitrogen processing using observa-
O3−–N and N
tions of N H4+–N and RMSE (RMS error) is 1.889, (d-index) 0.14 is 0.14, ammonium-NO3−N, R2 is
Scientific Reports | (2021) 11:17505 | https://doi.org/10.1038/s41598-021-96386-5 7
Vol.:(0123456789)www.nature.com/scientificreports/
Figure 4. Denitrification rate over 20 years of fertilization of predicted and observed values.
1, RMSE is 3.67, d index is 0.895 (Figs. 2, 3, 4). Observations of denitrification in both observed and simulated
conditions show that losses were low high in predicted as compare to observed. The losses were not significantly
different because the percent change was low (Fig. 4).
Total NO3−–N and NH4+–N changes over 20 years of fertilization. During 20 years of fertiliza-
tion, soil changes of NO3−–N were observed and simulated. A comparison between the observed and simulated
results showed that simulated NO3−–N had higher variations in fertilization and loss. The average loss of NO3−–N
depends on the application of nitrogen input to the soil system. The simulation was done on seven soil layers,
and each layer showed significant changes with the year of fertilization. Regression analysis showed that the
significant change over 20 years in observed and simulated. The average 20 years losses of N O3−–N and N H4+–N
observed were 1375.91 kg ha−1 and 9.24 kg ha−1, while in the simulation increase was from 1387.01 kg ha−1 and
9.28 kg ha−1 respectively. The average total change between observed and simulated NO3−–N and N H4+–N was
about 11.15 kg ha−1and 0.04 kg ha−1 respectively. The losses of NO3−–N from soil were not the same for observed
and simulated results by APSIM. It has directly related to the application of nitrogen rates and rainfall events.
In general, the APSIM nitrogen model significantly predicted the changes in soil NO3−–N and NH4+–N over
different application rates. The difference in precipitation significantly changes over-fertilization years, while
essential soil water content also wildly fluctuates with rainfall events (R2 = 0.171). The denitrification in (Fig. 4)
showed that the changes were significant with a year of fertilization in both observed and predicted. To study
the impact of individual year, we divide the years into five scenarios and predicted the N O3−–N and N H4+–N
losses with depth, denitrification, and nitrification with precipitation for observed and simulated values in the
APSIM model. The average 20 years of losses of denitrification and urea losses in observed and predicted were
not changed significantly. The essential soil water content remained the same and did not change over 20 years,
as shown in Table 3.
Nitrogen model on observed value year 1990. The nitrogen model under climatic change (weather
condition) on total nitrogen, denitrification, and depth nitrogen losses and simulation from 1990 to 2010. For
every five years for observing data and simulation result for 1990 and 2010. The result in Fig. 5a showed that in
O3−–N and N
the start of the days after urea application, the losses of the total N H4+–N were minimized, while
+ −
after 50 days in N H4 –N and N O3 –N on day 100, the losses were stated and increased up to 350. This is the
change of losses of nitrogen in the soil after urea application. The graph in Fig. 5b showed the date versus rain,
denitrification on the right-hand axis, essential soil water, and total NO3−–N. The graph showed that denitrifica-
tion increased with the increase in rainfall. The average value of 365 days of esw was 192.9 mm, total NO3−–N
was 114.01 mm, total N H4+–N was 6.32 mm, and dnit was 0.02 mm. The total N O3−–N also showed the same
trend with rainfall and losses of it occurs with days’ increase, the losses of total N O3−–N (kg h a−1) in 7 layers
was 48.47 followed by 24.92, 23.57, 49.60, 2.52, 2.39, and 2.45. The same decreasing trend was observed in
total NH4+–N (kg h a−1) 5.29, 0.58, 0.28, and 0.140. The losses of both were minimum up to 50 days of fertilizer
application while increase with days. The main cause of direct N2O emissions from agricultural fields was soil
microbial activity, mainly nitrification (in well-aerated soils) and denitrification (in saturated soils) processes.
Because these loss mechanisms are biological, soil N 2O losses were caused by temperature and soil water con-
ditions. Natural N2O emissions will occur as a result of whether fertilizer is used because soil organic matter
decomposition often contributes to the same microbial soil processes that produce N 2O. Nevertheless, the appli-
Scientific Reports | (2021) 11:17505 | https://doi.org/10.1038/s41598-021-96386-5 8
Vol:.(1234567890)www.nature.com/scientificreports/
Figure 5. The graph was created for the year 1990 were (a) Date versus urea, total ammonium, and total nitrate,
(b) Date versus Rain, DNIT (on Right Hand Axis), esw (extractable soil water) (mm), and total N O3−–N (kg
ha−1) and total NH4+–N (kg ha−1) (c) distribution of nitrate through the soil profile throughout the depth.
Scientific Reports | (2021) 11:17505 | https://doi.org/10.1038/s41598-021-96386-5 9
Vol.:(0123456789)www.nature.com/scientificreports/
cation of fertilizer would increase the amount of direct N 2O emissions and indirect nitrogen losses significantly
due to greater availability of N. The graph in Fig. 5c showed the distribution of nitrate through the soil profile on
31 January and 16 June after fertilization. The distribution of nitrate in the soil profile on days 1, 15 and 31 days
after the addition of urea fertilizer and at 5 months. The result revealed that with depth on two different days of
the year, simulation of leaching and losses of NO3−–N and N H4+–N occur. The losses increased with depth, the
denitrification on 16th June is higher than the 31th January.
Nitrogen result for the year 1995. Nitrogen directly or indirectly affected the metabolism and growth
of plants in many aspects and was the main element affecting crop yield. In crop production, nitrogen and
phosphorus fertilizers can improve and regulate soil nitrogen and phosphorus supply capacity and promote
crop growth, which has become essential elements and means to increase crop yield. The graph in Fig. 6a was
between rain versus urea, N O3−–N, and N H4+–N showed the long-term fertilization effect on the dynamic of
nitrogen in the soil. The result was similar to the 1990 year simulation such as the urea vanish up to 50 days and
soil NO3−–N was stable up to first fourty five days and start losses as it reached 50 days and the losses were high
after this. The esw (mm) was 167.18, total NO3−–N (kg ha−1) was 110.57 and NH4+–N (kg ha−1) was 8.99, and
dnit loses 0.4. The soil NH4+–N losses also occur after 85 days as depletion and leaching. This showed that the
losses of nitrogen occur in the soil.
The soil nitrogen directly influences the crop growth and metabolism in the crop and one of the main elements
in crop yield. The graph in Fig. 6b between day versus total N O3−–N, rain, essential soil water (esw) and total
+
NH4 –N showed that rainfall in 1995 is relatively low and frequent rainfall occurs in the middle of the year. The
total NO3−–N (kg h a−1) in the seven layers was 59.68 followed by 59.68, 23.31, 13.58, 6.63, 2.39, 2.45, and 2.52, the
same decreasing trend was observed in total NH4+–N (kg ha−1) 8.11, 0.43, 0.30 and 0.14 respectively and zero up
to 7th layer. The rainfall is the main factor in losses of nitrogen. When the soil is saturated with water, a process
called denitrification and cause nitrogen was loss from the soil zone. Denitrification was the transformation of
nitrate into one of the gaseous types of nitrogen that will be lost to the environment. This process usually occurs
when there were conditions for the absence of oxygen (anaerobic), such as in saturated soils. A method called
denitrification will cause a loss of N when the soil was saturated with water. Figure 6b showed denitrification
losses between 150 and 200 days due to high rainfall between this time. When the long-term improper use of
nitrogen fertilizer increases considerably, the accumulation of nitrate-nitrogen in deep soil, even more than the
single application of nitrogen fertilizer.
The chance of leaching has increased considerably. To investigate the impact of nitrogen fertilizer on the .
The nitrogen was lost through denitrification in large amounts of nitrate available in the soil when it’s in saturated
conditions. Figure 6c showed that the losses of the total ( NO3−–N and N H4+–N) with different depth showed
−
that the losses of NO3 –N losses depend on the rainfall events; at 16-6-1995, the losses were higher as compared
with the January 31. The N H4+–N also followed the same pattern because it was also affected by rainfall and
temperature. Compared with the soil layers, the change of the total nitrogen content with the soil layer depth
gradually increased. This indicates that with the increase of nitrogen application rate, the accumulation of soil
nitrogen below the root layer (generally, the corn root layer is 120 cm) increases, which increases the leaching
loss of nitrogen.
Nitrogen dynamics for the year 2000. The results in Fig. 7a showed that in the year 2000, the losses
of nutrients were the same and followed the 1995 year with minimum variation. The rainfall event is also high
from 150 to 220 days of the year, so the essential soil water also fluctuates, which results in the changes in total
NO3−–N in the soil. The average mean of esw was 311.53 mm, total NO3−–N was 1359.93 kg ha−1, NH4+–N
was 16.77 kg ha−1 and dnit was 0.03 kg ha−1, respectively. The total NO3−–N in kg h
a−1 in first seven layers were
H4+–N were 16.04, 0.27, 0.28, and 0.17. The losses
320.82, 192.44, 356.21, 265.76, 139.55, 61.65, and 23.5, while N
started when rainfall occurs, and the denitrification showed a significant change in Fig. 7b. The Total N H4+–N
denitrification in January was higher as compared to June. The denitrification losses in this year were less than
in previous years because of low rainfall. While in Fig. 9c showed that the changes of the depth versus different
dates wise. The N O3−–N and N H4+–N losses showed that the change was slightly different from the 1995 pattern.
−
In Fig. 7c, the total N
O3 –N losses in June-16 started higher losses with depth than January-31.
Nitrogen changes in 2005. The nitrogen model simulation through APSIM was shown in Fig. 8a, the
urea, total NO3−–N and NH4+–N versus days in the year 2005 simulation of nitrogen changes as urea fertilizer
was applied. The losses of the total NO3−–N and NH4+–N were followed by the year 2000. The losses were similar
to the previous year. The esw was 157.20 mm, total NO3−–N was 115.70 kg ha−1, total N H4+–N was 8.48, and
zero denitrification. The average total N O3−–N (kg h a−1) losses were 63.15, 20.45, 16.28, 8.38, 2.42, 2.47, and 2.56
while total N H4+–N losses in (kg h a−1) was 7.74, 0.33, 0.25, and 0.13 respectively. Figure 8b showed that the day
versus total NO3−–N, rainfall, essential soil water (esw), and denitrification (dnit) showed that the rainfall was
high in the mid-year range from 150 to 215 days. The total soil NO3−–N losses were highly dependent on the
rainfall event. The essential soil water also changes with the rainfall and constant when rainfall did not occur in
the start and end of the year. The total soil NO3−–N losses were high, and Fig. 8c showed that the Nitrate distribu-
tion through the soil profile at 31 days after fertilization and again at 5 months. To help visualize this, we build a
depth plot. Layered variables were kept in ranges at all times. For this reason, we included NO3−–N and NH4+–N
as layered variables, and the nitrogen leach downward up to the soil depth. Figure 8c showed the distribution of
nitrate in the soil profile after 21 days of fertilizer addition and at 5 months.
Scientific Reports | (2021) 11:17505 | https://doi.org/10.1038/s41598-021-96386-5 10
Vol:.(1234567890)www.nature.com/scientificreports/
Figure 6. The graph of the year 1995 (a) between rain versus urea, N O3−–N and NH4+–N showed that the
O3−–N, Rain, Essential
long-term fertilization effect on dynamic of nitrogen in the soil, (b) day versus total N
H4+–N and rainfall in 1995 while (c). The losses (NO3−–N and NH4+–N) with different
soil water (esw), total N
depths showed that N O3−–N losses depend on the rainfall events at different dates of the year.
Scientific Reports | (2021) 11:17505 | https://doi.org/10.1038/s41598-021-96386-5 11
Vol.:(0123456789)www.nature.com/scientificreports/
Figure 7. The graph of the year 2000 (a) the graph between Rain versus urea, Total NO3−–N and NH4+–N and
days of the year (b) day versus Total NO3−–N, Rain, Essential soil water (esw) and Total NH4+–N while (c) The
losses (NO3−–N and NH4+–N) with different depth indicated that the losses of NO3−–N losses depend on the
rainfall occasions at other dates of the year 2000.
Scientific Reports | (2021) 11:17505 | https://doi.org/10.1038/s41598-021-96386-5 12
Vol:.(1234567890)www.nature.com/scientificreports/
Figure 8. The graph was made on simulation datausing nitrogen model for the year 2005 (a) the nitrogen
changes graph with different days of the year versus urea, total (NO3−–N and NH4+–N), (b) the graph of day
O3−–N, Rain essential soil water (esw) and denitrification (dnit) while, (c) the graph of nitrate
versus total N
distribution through the soil depth at different dates in the year.
Scientific Reports | (2021) 11:17505 | https://doi.org/10.1038/s41598-021-96386-5 13
Vol.:(0123456789)www.nature.com/scientificreports/
Figure 9. The graph was made on observed data for the year 2010 (a). The soil nitrogen Total ( NO3−–N, and
H4+–N) and urea versus day. (b) The days of the years versus denitrification (dnit), rainfall, esw, and total
N
NO3−–N while (c) depth of the profile versus NO3−–N and NH4+–N with different year dates.
Scientific Reports | (2021) 11:17505 | https://doi.org/10.1038/s41598-021-96386-5 14
Vol:.(1234567890)www.nature.com/scientificreports/
Nitrogen dynamics in 2010. The losses of nitrogen through leaching from agricultural soil leads to low
yield and environmental issues. The soil total nitrogen (NO3−–N and NH4+–N) and urea versus day were shown
in Fig. 9a; it states that, after urea fertilization, the soil total (NO3−–N and N
H4+–N) losses were minimum up to
the first 50 days of the year of fertilization while increase occurs as days passes and showed constant losses up to
the end of the year. The average annual mean of esw was 165.37, total NO3−–N was 108.73 kg ha−1, NH4+–N was
8.03 kg ha−1, and dnit was 0.7 kg ha−1 respectively. The total NO3−–N (kg ha−1) were 55.5, 22.24, 16.23, 7.32, 2.42,
2.47, and 2.52 and total N H4+–N (kg ha−1) were 7.06, 0.54, 0.27, and 0.13. The losses in Fig. 9b of total N
O3−–N
showed that the losses were higher than previous years and the rain fall in this year was higher, which affected the
soil saturation level and led to nitrogen losses. The denitrification (dnit) losses were higher among 200–250 days,
and rainfall was also high. Soil essential water also fluctuated with the rainfall throughout the year. Figure 9c
showed that the nitrogen losses with depth occur in the soil, and the graph showed that the NO3−–N losses were
higher in the 5th month of the year compared to the start of the year. The NH4+–N losses also suggest that the
losses were higher on the 5th of the month than the start of the month. This showed that characteristics of nitrate
leaching in this region occurred, and it needs to address during the summer maize season.
Simulated data results for the years 1990 and 2010. Nitrogen simulation on simulated data. To
check the dynamics of nitrogen level, if the nitrogen level increase in the soil from the observed value, what
will be the fate of nitrogen. The nitrogen simulation in Fig. 10a was made on the same environmental condi-
tion; soil properties and all other conditions were kept constant. The change in total N O3−–N and N H4+–N were
change from 25 kg ha−1 to 5 kg ha−1. The average simulated observation for esw was 192.92 mm, total N O3−–N
was 128.07 kg ha−1, total NH4+–N was 7.17 kg ha−1, and dnit was 7.7 kg ha−1. The average annual losses of total
NO3−–N (kg h a−1) were 49.27, 25.87, 26.09, 12.16, 4.97, 4.81, and 4.87 while N H4+–N kg h a−1 were 5.35, 0.65,
0.42, 0.28, 0.13, 0.14, and 0.14 respectively. In Fig. 10a Total NO3−–N showed that losses were high after 50 days,
and higher losses were observed up to the end of the year. If large amounts of nitrate were available in saturated
soil conditions, nitrogen was lost through denitrification. Soil essential water requirement and denitrification
were related to each other; higher denitrification occurs between 150 and 240 days of the year. The higher deni-
trification was in 200–250 days, as shown in Fig. 10b. An increase in precipitation also enhanced the denitrifica-
tion rate in the soil. The NH4+–N losses were up to 400 m depth while NO3−–N losses started from 100 m depth
after 31th month of fertilization, as shown in Fig. 10c. The NH4+–N start losses up to 0.32% till the soil depth
while NO3−–N losses started from 65 till 600 m up to the soil depth.
The nitrogen simulation in Fig. 11a showed that after urea fertilization, it depletes in the soil after 50 days.
This result in the uptake of nitrogen by the plant was high at the start of the year. The total N O3−–N showed that
losses started from 80 days of the year while NH4+–N losses started after 100 days. The average mean of annual
esw was 165.37 mm, total N O3−–N was 122.48 kg ha−1, total N H4+–N was 8.96 kg ha−1, and dnit was 0.7 kg ha−1.
The annual average mean of seven layers of N O3−–N (kg h a−1) losses were 56.51, 23.27, 18.6, 9.65, 4.74, 4.80,
and 4.85 while total NH4+–N (kg h a−1) were 7.12, 0.61, 0.42, 0.29, 0.15, 0.15, and 0.15. The rainfall in Fig. 11b
was constant, and this year receive maximum rainfall and reached up to 60 mm at peak level on 210 days of the
year. The essential soil water (esw) showed a different level throughout the year. The denitrification rate only
experienced on 220 days of the year. At the same time, total NO3−–N was available in the start-up to 80 days
while start depletion. The soil depth Fig. 11c represents that in the start 31th January, the N O3−–N show losses
up to 1000 mm while N H4+–N loss started from 50 to 400 m. After the 5th month of fertilization application,
the depletion of N H4+–N showed depletion from 0.1 to 0.2 and sudden change and losses started. The NO3−–N
started from 65 to downward up to 200 cm and below the root zone.
Discussion
The globe’s average temperature increased over the last decades and continues to increase and rise in prediction,
with the great chance to experience hot days—this increase in temperature solar radiation, and precipitation
will have a high impact on a griculture47. The world’s annual fertilizer nitrogen consumption has reached up to
70 million tons. China has an annual consumption of over 15 million tons and is the world’s largest consumer
of fertilizer nitrogen.
The result of simulation indicates that for enhancing crop production and APSIM mineralization, the chemi-
cal composition of biochemical needs to address and accounted for, moreover by enhancing the soil N pool
from crop residues which come from C and N partition (CARB, CELL etc.), the crop biochemical composition
of residual crop or by adding a conceptual pool or imitated SMM. Various studies also support the result by
separating the chemical digestion of organic material into f ractions48,49. However, nitrogen fertilizer efficiency
was low, and there were large losses to the environment. It is estimated that agricultural nitrogen losses can be
as high as 40–60% of nitrogen in our c ountry50. Overuse of chemical N fertilizers, high net mineralization and
nitrification, and predominance of rainfall during the summer season with a light soil texture were the main
control factors responsible for the heavy nitrate leaching51. In this study, we assessed the dynamic of nitrogen
fertilization and climate change with respect to solar radiation, temperature, precipitation, and its impact on
nitrification, denitrification, and nutrient losses with depth. We used the nitrogen model in APSIM and used
irrigation level constant to check the soil runoff, which plays a key role in nitrate leaching, depending primarily
on precipitation and irrigation levels. For example, when drainage declined from 570 to 79 mm, the irrigation
rate decreased from 500 mm to no irrigation52. Water was an important feature in nitrogen losses, and nitrate
was transported by the flow of soil water and can lead to loss of leaching if there were abundant water move-
ment out of the root zone. Leaching of nitrates also occurs during the drainage season when precipitation and
irrigation surpass evaporation53. The result was similar to the finding o f54 losses of nitrogen included leaching
of nitrate ( NO3−–N) and gaseous emissions via ammonia ( NH3) volatilization and denitrification (emissions of
Scientific Reports | (2021) 11:17505 | https://doi.org/10.1038/s41598-021-96386-5 15
Vol.:(0123456789)www.nature.com/scientificreports/
Figure 10. The graph was created on weather data of 1990, and the simulation of NO3−–N and NH4+–N value
was change to check the simulation of nitrogen losses with the same weather data. (a) nitrogen simulation graph
such as days versus total ( NO3−–N and NH4+–N) and urea, (b) denitrification graph in which days of the years
versus denitrification (dnit), rain, esw, and total NO3−–N while, (c) the depth of the profile versus N
O3 and
NH4+–N with different days of the year.
Scientific Reports | (2021) 11:17505 | https://doi.org/10.1038/s41598-021-96386-5 16
Vol:.(1234567890)www.nature.com/scientificreports/
Figure 11. The graph was generated on simulated data for the year 2010 (a). The soil nitrogen Total ( NO3−–N
and NH4+–N) and urea versus day. (b) The denitrification (dnit), rainfall, esw, and total N
O3−–N versus days of
the year’s while (c) The depth of the soil profile NO3−–N and NH4+–N with two different dates of the year.
Scientific Reports | (2021) 11:17505 | https://doi.org/10.1038/s41598-021-96386-5 17
Vol.:(0123456789)www.nature.com/scientificreports/
nitrous oxide ( N2O) and dinitrogen ( N2). In this study, the nitrogen model uses rainfall parameters to check the
denitrification, the higher the rainfall higher will be the denitrification. Our result was similar to the findings
of55, which stated that pasture growth in the deep soils was not affected by irrigation frequency, while denitrifi-
cation increased with higher frequency irrigation, particularly in the poorly drained soil, resulting in increased
N2O emissions. All soils and climates showed significantly higher denitrification and N2O emissions under
high-frequency/low-intensity irrigation (Irr1) compared to low-frequency/high-intensity (Irr6), because soils
exceeded a critical moisture content that favors denitrification. The rainfall cause runoff, and it result in losses
of nitrogen; our result was also similar to the finding o f56,57 where he stated that nitrogen losses by leaching and
surface runoff were the highest among all climatic scenarios for each treatment under the RCP 8.5 scenarios. The
explanation may be due to the expected more regular heavy precipitation events and high soil nitrate concentra-
tion due to the introduction and mineralization of mineral Nitrogen. In our study, the higher average annual
denitrification rates under some years under APSIM scenarios, this result was similar to the finding o f56,58, he
stated that the climate change would increase N2O emissions globally. Based on the simulating findings in Fig. 11,
inter annual variability steadily enhanced application of nitrogen rates greater than 25 kg N ha−1 similar result
was also reported by59–61. The Nitrogen budget or balance was often calculated by comparing different N inputs
and outputs in plant–crop systems, taking into account shifts in soil mineral N itrogen57. In most cases, in spite
of the great uncertainty associated with its calculation, denitrification was also seen as an important process of
nitrogen loss. A long-standing issue in soil N research was the direct quantification of denitrification nitrogen
loss from nitrogen fertilized soils57. This result was similar to the findings of our nitrogen model simulation of
nitrogen losses; for example, willigen P compared 14 nitrogen cycle models and found that these 14 models
could not be simulated in late spring and early summer. Loss of soil inorganic nitrogen after fertilization62.
However, the study provided the adverse effects of climate change and give a clear picture of nitrogen dynamics
under long-term weather conditions. In most cases, despite the great uncertainty associated with its measure-
ment, denitrification was also seen as an important process of nitrogen loss. Clear denitrification quantification,
the loss of nitrogen from N-fertilized soils were a long-standing issue in soil nitrogen r esearch57. Because the
soils were above a critical moisture content that favors denitrification55. Yet expected N losses have increased
by leaching, denitrification, and N 2O emissions. Pasture growth in the deep soils was not affected by irrigation
frequency, while denitrification increased with higher frequency irrigation, especially in the poorly drained soil,
resulting in increased N2O emissions. Based on these modeling results, it was possible to reduced nitrogen losses
n54. The change in the soil microsites under the incubation conditions may also illustrate the
with little effect o
response of N 2O of emissions from denitrification response to the availability of temperature and soil N O3−–N.
As observed, the increase in the temperature of soil respiration levels is likely to result in O2 depletion, affecting
NO3−–N as the terminal electron acceptor during denitrification. The nitrous oxide emission from denitrification
and partitioning of gaseous losses as affected by nitrate63.
The study indicated that the use of synthetic nitrogen (N) fertilizer has played a critical role in boosting
food production to an increasingly growing population of the world. Furthermore, high inputs of mineral N
fertilizer overcrop demands can lead to decreased N use efficiency and affect several negative impacts on the
environment, such as surface water eutrophication, groundwater nitrate pollution releasing greenhouse gases,
and soil acidification. These environmental issues were getting worse because the use of mineral nitrogen fer-
tilizer would grow predictably in the f uture19. Complex interactions between soil properties, weather patterns,
crop growth, and nitrogen loss networks make it more challengingto sync up fertilizer management with crop
nitrogen demand, leading to under- or above-N u tilization64. As such, the overall objective of this study was to
provide a clearer understanding of increasing dynamics in the supply and demand balance of water, its effects
on food p roduction17. Appropriate strategies for fertilization must be adopted for further optimization to fit in
with future climate change. Future more, climate change could significantly impact the soil nitrogen, especially
the combined effects of elevated temperature, increased losses, and increased precipitation event increase deni-
trification. The APSIM nitrogen simulation model was used to simulate the influence of climate change on soil
nitrogen dynamics based on future climate change across maize cropping regions in China.
Conclusion
Quantitative information on nitrogen and its impact on soil under long-term fertilization, the best strategies, is
essential for the assessment of nitrogen loss and availability. The results of the model showed that the nitrogen
model between observed and simulated values for nitrogen losses, denitrification, and nitrogen losses through
different depths. The nitrogen simulation through APSIM showed that after urea fertilization, it depletes in the
soil after 50 days. This result in the uptake of nitrogen by the plant was high at the start of the year. The total
NO3−–N showed that losses started from 80 days of the year while NH4+–N losses started after 100 days. The
model predicted that with an increase in rainfall events in the year, losses of nitrogen increase. This study illus-
trates the potential for using crop management and nitrogen simulation models as an information technology
tool for maintaining the suitable management strategies for maize production in Jilin province, China. This can
provide alternative management strategies to overcome the nitrogen losses in maize crops. The weather record
and long-term soil data offer the best management scenario for the analysis and prediction of nitrogen. The
future recommendation about the study area was to 20-year, long-term simulation with APSIM validated model
exhibited that N application (15 kg N ha−1) improves both the long-term average nitrogen losses. The nitrogen
content 25 (kg h a−1) showed increased N losses with the same climatic condition. This implies a lower average
yield under an increased amount of nitrogen application; hence 15 kg N ha−1 appear more appropriate for farm-
ers, therefore and a higher yield with minimum losses of N will be observed, thus vulnerability will be reduced.
Scientific Reports | (2021) 11:17505 | https://doi.org/10.1038/s41598-021-96386-5 18
Vol:.(1234567890)You can also read