2015- 2016 INVESTMENT PLAN - 12 SEPTEMBER 2014 - WELTEC
←
→
Page content transcription
If your browser does not render page correctly, please read the page content below
2015- 2016 Investment Plan

                 12 September 2014
TABLE OF CONTENTS

INTRODUCTION ................................................................................................................................. 1
Taking Up The Challenge ................................................................................................................... 1

EXECUTIVE SUMMARY....................................................................................................................... 3

PART 1: CONTEXT ............................................................................................................................. 5
1.1      The Choice Protocol................................................................................................................. 5
   1.    A Fully Functioning Combined Academic Board................................................................................ 5
   2.    Shared Services Deliver Cost and Delivery Benefits .......................................................................... 6
   3.    Campus Planning ............................................................................................................................... 6
   4.    Joint Centres of Excellence ................................................................................................................ 7
   5.    Branding and Communication ........................................................................................................... 7
   6.    International Marketing of Wellington ............................................................................................. 8
   7.    Developing a Single Structure of Advisory Committees .................................................................... 8
   8.    Students............................................................................................................................................. 8
   9.    Joint Council Operations and Statute ................................................................................................ 8

PART 2: STRATEGIC INTENT ............................................................................................................. 10
2.1      The Performance Story .......................................................................................................... 10
   2.1.1       The Current Environment......................................................................................................... 10
   2.1.2       WelTec’s Strategic Direction 2015-2017 .................................................................................. 18
   2.1.3       Outcomes Framework Chart .................................................................................................... 20
   2.1.4       Capital Development Plan ........................................................................................................ 21
2.2      The TES Priorities .................................................................................................................. 23
   2.2.1       TES Priority 1 Delivering Skills For Industry .............................................................................. 23
   2.2.2       TES Priority 2 Getting At Risk Young People Into A Career ...................................................... 27
   2.2.3        TES Priority 3: Boosting Achievement of Māori And Pasifika ................................................. 29
   2.2.4       TES Priority 4 Literacy, Language And Numeracy (LLN) ........................................................... 34
   2.2.5       TES Priority 5: Strengthening Research-Based Institutions...................................................... 37
   2.2.6       TES Priority 6 Growing International Linkages ......................................................................... 39
2.3      WelTec Activity in Relation to TEC’s identified WelTec-specific “Change Expectations” ........... 42
PART 3: SUMMARY OF ACTIVITY ...................................................................................................... 43
3.1      Mix of Provision .................................................................................................................... 43
3.2      The Mix of Provision and Regional needs ............................................................................... 43
3.3      Changes to the Portfolio ........................................................................................................ 45
3.4      Financial Request .................................................................................................................. 49

PART 4: PERFORMANCE COMMITMENTS ......................................................................................... 50
Appendix 1: Quality Assurance Reviews ........................................................................................... 56
Appendix 2:          An Assessment of workforce in relation to areas of WelTec Provision........................ 58
Appendix 3: How WelTec’s Strategic Activities Contribute to Government’s TES Priorities and Better
Public Service targets ...................................................................................................................... 65
Appendix 4: 2015 SAC Performance Commitments Templates ........................................................ 66
Introduction
Taking Up The Challenge

WelTec will play an increasingly important role in realising the Government’s and the TEC’s vision for the
tertiary sector’s contribution to our economy and society.

We exist to deliver talent to industry. By doing this strategically we will meet the needs of the diverse
groups of individuals, cultures and businesses with whom we interact.

As an organisation we have made major moves to re-engineer and adapt to the challenges facing our
sector, our institution, our students, our graduates and the skills requirements of industry.

The Government and TEC have clearly outlined their determination to see our sector move towards
being more outward-facing, more effectively engaged with business and more rigorous in pursuit of the
priorities outlined in the Tertiary Education Strategy. WelTec’s staff, management and Council are well-
positioned to meet these challenges.

This document outlines a number of the initiatives we are taking to increase student skills and work-
readiness, how we are creating powerful links to industry, becoming a leader in vocational-focussed
education, and achieving both growth and greater efficiency within our business.

This document addresses the requirements outlined in the TEC’s General Plan Guidance and provides
information on WelTec’s operational intentions over the next two years.

Roger Sowry
ONZM
Chair of Combined WelTec and Whitireia Council

                                                                                                   Page 1
Page 2
Executive Summary
Wellington Institute of Technology (WelTec) welcomes Government’s six key Priorities for the tertiary
education sector, in particular the first Priority, Delivering Skills for Industry.

WelTec is already well-known for strong and collaborative relationships with the industries that
spearhead the Wellington regional economy and those that drive wider growth in the New Zealand
economy. Seeing our role as the engine room of the region’s economic growth, WelTec puts the
industries and professions with whom we work front and centre of our curriculum development,
student support, research and success determination.

In the two years ahead WelTec will enhance this reputation even further by reconstituting our subject
advisory committees as Industry Partnership Committees and growing our Business Partnership Team
by initially adding a second Jobs Broker. We will also task ourselves with a broad responsibility to make
the “talent pipeline” from tertiary enrolment to successful employment and delivery of value to
industry, responsive, trusted, and efficient.

Government’s priorities around increasing parity and success for priority learners will continue to
receive strong emphasis from WelTec, working as always in partnership with iwi and communities we
serve.

For the Wellington region, the pressures of a fast-growing labour force participation rate coupled with
acute needs for highly skilled workers require WelTec to put increasing emphasis on high-end
qualifications without losing our focus on a workplace-relevant and workplace-based hands-on learning
experience for our students. In the next two years we will grow Level 3 and above EFTS by just under 5%
while our overall EFTS growth will be 4.4%. Growth will mirror the major areas of industry strength for
the region, including ICT, engineering, construction, the film and screen industry, and, particularly for
Hutt City (Technology Valley), advanced manufacturing.

The Wellington region has lagged behind other parts of New Zealand in the number of places available
for Trades Academy provision. As one of the most successful performers in the Trades Academy arena,
we welcome the Ministry of Education’s decision to significantly increase the number of places allocated
to WelTec as the Wellington Trades Academy in 2015.

WelTec’s strategic partnership with Whitireia will deepen and deliver efficiencies and increasingly
effective education outcomes in the coming years. We will also grow our partnerships with Victoria
University, Te Wānanga o Aotearoa, with Massey University in Wellington and internationally-oriented
secondary schools and PTEs to enhance the attractiveness of Wellington for international students and
institutional partners.

Finally, WelTec will develop non-governmental income sources. Compared with other Metropolitan
institutes of technology, WelTec has underdeveloped non-government funding sources. This work will
receive priority in the next two years.

Linda Sissons
Chief Executive

                                                                                                  Page 3
Page 4
Part 1: Context
1.1 The Choice Protocol
WelTec And Whitireia Show What Can Be Achieved In Partnership
In January 2012, WelTec and Whitireia formed a Strategic Partnership. This followed extensive research
and consultation during 2011 as to how the two institutions could work together to increase benefits for
students and industry in the Wellington region.
While the institutions are separate entities, they are governed by a joint Council.
Both institutions are committed to working together to:
Increase the educational benefits for students in the Wellington region
Improve the on-going operational efficiency of each institution
Ensure the vocational skill needs of industry are met
Ensure that students will be able to transition seamlessly between Whitireia and WelTec.
Nine areas where the Choice Protocol is delivering a better return on investment
1. A fully functioning Combined Academic Board
2. Shared services
3. Campus planning
4. Joint Centres of Excellence
5. Branding the strategic partnership
6. International marketing (of Wellington)
7. A single structure of Advisory Committees
8. Students
9. Joint Council operations and statute
Over the last three years senior management and Council have invested extensive effort in shaping the
partnership. The progress that has been made during this period is outlined below.
1. A Fully Functioning Combined Academic Board
The Combined Academic Board has put in place the building blocks for shared academic delivery and
increased access to tertiary education for students across the region.
An integrated portfolio of programmes and qualifications has been established.
In December 2013, the Council approved a shared quality management system named Taikura, which
embodies the goals of our academic process.
The Taikura Quality Management System. Taikura means ‘heart of the tree’ and it represents a new
approach to quality management. It is a common set of policies and practices designed to facilitate a
smooth transition for students in the Wellington region, particularly between the two institutions.
Page 5Taikura sets out four overarching policies:
1. Te Tiriti o Waitangi is embodied in institutional life and relationships.
2. The learning environment has learning as the core institutional purpose, informing all
principles and practices.
3. Evaluation and improvement is central to institutional planning and operation.
4. Quality management regulates all institutional practices.
2. Shared Services Deliver Cost and Delivery Benefits
In the first year of
W2 Shared Services is a jointly owned limited liability company
operation our joint W2
guided by a Joint Venture Agreement between WelTec and Shared Services company
Whitireia. delivered $737,000 of
The purpose of W2 is to deliver shared services across the two actual savings in activities.
organisations with the aim of ensuring that consistently high-level In addition to this, there
internal services are available to staff and students at both was $80,000 of added
institutions, reducing duplication and enabling resulting cost value savings.
savings to be reinvested for the benefit of students.
At this stage the scope of the shared services framework covers ICT and Procurement.
The Council has confirmed a three-year high-level strategy through to 2016. In 2016 the aim is to look at
expanding the scope of shared services.
Consideration will be given to other efficiencies that may be gained by combining resources in facilities
management, marketing and student recruitment, libraries and records management.
Three major business areas have been identified as priority for collaboration in 2014. These are
timetabling, student management system and business intelligence. Project teams have been set up for
each of these initiatives.
3. Campus Planning
Ten Year Campus Development Plan. The Council approved an integrated Ten Year Campus
Development Plan in October 2013.
Campus Consolidation. There have been a number of initiatives in support of the general principle of
consolidation of campuses.
In Auckland the Computer Power Plus (CPP) campus has been successfully relocated to a newly
fitted out area within Whitireia’s campus at 450 Queen Street. This has resulted in improved
services and facilities for CPP staff and students together with approximately $100k per annum in
lease savings.
Scoping of requirements has commenced for the relocation of other existing WelTec provisions in
Auckland within or adjacent to the site occupied by the Whitireia campus.
In Wellington, the development agreement to build a combined Centre for Creative Technologies
and Arts was signed on 8 September 2014. This will lead to a high profile consolidated Centre.
Page 64. Joint Centres of Excellence
A key driver of the partnership has been to co-locate complementary higher level programmes in areas
of existing programme strength to create joint Centres of Excellence that will receive national and
international recognition.
Over the last couple of years conceptual operating models were completed for the joint Centres of
Excellence for the Creative Technologies and Arts, and in Health and Social Services.
Creative Technologies and Arts. In June 2014, WelTec and Whitireia jointly announced the intention to
develop a multidisciplinary tertiary Centre of Excellence for Creative Technologies and Arts in the
Wellington CBD. Consolidating Whitireia and WelTec’s creative technologies and applied and performing
arts programmes in one location will cement Wellington’s
reputation as a centre for the creative industry.
The proposed new Centre
The Centre will also be a venue for various Wellington festivals,
for Creative Technologies
music and cultural events showcasing student talent. and Arts will see 1000
Broad agreement is in place on the programme mix that will be students, performers,
delivered by the Centre. Discussions have begun on how creators and innovators
converging in the Capital to
programme development can be informed by the future co-
learn together in a vibrant
location and issues such as timetabling and cross programme new purpose built facility.
projects will need much more development. The proposed Centre
is planned to be operational for the 2018 academic year.
Health and Social Services. A series of meetings between Health staff at the two institutions has
resulted in an agreement that any Centre of Excellence will be primarily virtual rather than physical.
One of the outputs of the current work stream is the development of a shared Masters in Health
Science. Meetings of staff from both institutions have taken place to begin the process of agreeing on a
format and structure for such a development.
5. Branding and Communication
The joint branding agreement, which incorporates the Choice Protocol logo, has now been incorporated
in print materials and advertising for both institutes.
The 2014 Prospectus was used to launch our new branding to prospective students. Since then a variety
of Choice Protocol collateral has been developed.
An out-of-region coordinated marketing campaign (focused on schools) ran this year. By the end of 2014
the Choice Protocol website will be operational. Significant further development is planned in 2015 that
will enable students regionally and nationally to easily access relevant on-line programme information
for either or both institutions.
Page 76. International Marketing of Wellington
International teams have worked together on collaborative strategies to encourage international
students to study in Wellington.
A variety of joint Wellington focused collateral has been developed and is being used
internationally by both institutions.
Both organisations are working at a strategic level with other Wellington region providers and
agencies to grow overall Wellington numbers.
Over the next three years WelTec and Whitireia aim to engage collectively with overseas
institutions.
7. Developing a Single Structure of Advisory Committees
Whitireia and WelTec have been working towards developing a single Advisory Committee structure.
Both institutions work closely with industry and see great benefits from a single advisory committee
structure.
To this end combined Industry Advisory Group meetings in Business and Information Technology, Health
and Creative Technologies and Performing Arts have been jointly hosted. The intention is not to replace
existing Advisory groups but to provide for high level strategic industry input in these critical areas, two
of which (Health and Arts) are part of our centre of excellence strategy.
8. Students
Both organisations are committed to creating a world class-learning environment responsive to meeting
the needs of students.
Student services staff at WelTec and Whitireia have been sharing expertise and working with
students to establish a workable student representation model.
Steps to share orientation activities have been positive. Work has been underway on a Moodle-
based student consultation system.
9. Joint Council Operations and Statute
At a strategic leadership level the Combined Council has been formally constituted under one statute
and currently meets monthly to oversee both the separate entity and collaborative work programme
progress.
Committee structures for risk and audit, campus planning, and Chief Executive’s performance have been
established. Council approved the Council Governance Policy on 19 February 2014.
Page 8Over the Next Three Years
The Student First project is creating a positive cultural change across the two institutions, and strong
cross-organisation working relationships have been developed. Good progress has been made across
the nine projects. The Combined Council is currently strategising plans for the coming triennium.
In particular, the collaborative work in Wellington City to consolidate the current eight sites to two
major centres will be a focus.
Page 9Part 2: Strategic Intent
2.1 The Performance Story
2.1.1 The Current Environment
Government Vision and Expectations
Education is central to helping New Zealand achieve social, cultural and economic goals. The
Government’s overarching education vision is for a “world-leading education system that equips all
New Zealanders with the knowledge, skills and values to be successful citizens in the 21st century”. The
Tertiary Education Strategy 2014-19 outlines the key outcomes and challenges for the sector along with
the roles the various organisations that make up the tertiary education sector are expected to play in
the achievement of the vision.
The TEC’s key intended impact is for New Zealand to have a world-leading and high-performing tertiary
education system. This overarching impact has three elements:
1. An increased proportion of the population with a tertiary qualification
2. Higher-quality and more relevant research
3. A tertiary system that is more responsive to the needs of employers and learners.
TEOs are expected to contribute to the following six priorities outlined within the Tertiary Education
Strategy during this investment plan period.
1. Delivering skills for industry
2. Getting at risk young people into a career
3. Boosting achievement of Māori and Pasifika
4. Improving adult literacy and numeracy
5. Strengthening research-based institutions
6. Growing international linkages.
In the 20–24 year old age
The Population bracket the population will
The 2013 Census shows that 430,197 people live within the increase in 2016 by 9% and
3% in 2021.
Wellington catchment area defined by TEC. This represents 10%
of the national population. As a result, the WelTec
portfolio is expected to be
Statistics NZ project that the Wellington catchments growth will
accessed by a large cohort
increase by 24% by 2031.
of students that will be
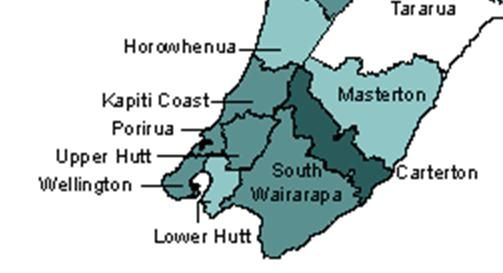
Within this catchment, the Kapiti Coast and Wellington City wanting to access
districts will increase by well over 20% with the other districts qualifications at Level 4
increasing from between 4% and 7%. and above.
The Horowhenua and Wairarapa, whilst previously seen as
outside the Wellington Catchment area defined by the TEC for the
Choice Protocol provision, have populations that would benefit from the WelTec and or Whitireia
learning related opportunities and these possibilities will be activiely explored. The additional
combined population for these two areas is 71,346 as defined in the 2013 Census.
Page 102013 2016
Region
Census Projections
Horowhenua 29,787 30,900
Kapiti 49,104 60,900
Porirua 51,717 55,600
Wellington 190,959 238,700
Lower Hutt 98,238 105,100
Upper Hutt 40,179 41,800
Wairarapa 41,559 40,490
In 2013, 67.8% of Wellington’s population was of a working
age (15-64). This was a slightly higher proportion than that of the overall national population.
Wellington had a slightly lower proportion (19.4%) of young people (0-14) than the country as a
whole and a significantly lower proportion (12.6%) of people over the age of 65.
Youth aged 15-19 years currently make up 7% of the Wellington population. 20-24 year olds make
up 7.7%.
Whilst the population over all is projected to increase the youth population is expected to
decrease in the 15-19 years by 5% in 2016 and 8% in 2021.
The 2013 census showed that 8.6% of NZ’s total Māori population lived within the Wellington
catchment (51,975). Within this 9.7% of Māori populations are 15-19 year olds and 9.3% are 20-
24 year olds.
There are concentrated Pasifika communities living within Wellington, Lower Hutt and Porirua. Of
New Zealand’s total Pasifika people 11.3% live within the Wellington Region (22,647). Within this
6.7% of the Pasifika people are 15-19 year olds and 8.3% are 20-24 year olds.
Employment and Unemployment
Wellington is experiencing
The unemployment rate in the Wellington area has reduced from job growth. As at March
7.1% in March 2013 through to 5.5% in March 2014. (MBIE Quarterly 2014 Wellington had the
Labour Market Report May 2014). second highest
employment rate (69.2%)
A range of business surveys that have taken place over the last 12 behind Canterbury.
months are revealing employer intentions to take on more staff in
Increasing numbers of
the coming months. Ministry of Business, Innovation and
Wellingtonians previously
Employment’s Online Skilled Vacancy index for Wellington, as at outside the work force are
April 2014 was 4.3% higher than it was the year before. looking to enter it with
Wellington having the
As the economy improves, the labour market tightens and
largest and fastest growing
unemployment falls, the difficulty in finding skilled labour can be
labour force participation
expected to intensify. It is important for the region that these skill rate in the country
shortages are addressed. Employer intentions to take on more staff
will come to nothing if these people can’t be found.
(Grow Wellington, Quarterly Economic Monitoring Report May 2014)
Page 11NEET Profile Youth Unemployment
In the Wellington region the young people between 15–24 who are not in education, employment, or
training (NEET) rate is on par with the New Zealand rate of 11.7% in March 2014 (Table 1).
Māori and Pacific NEET rates are higher nationally than for non-Māori, although they improved during
the 2010-14 period. The Wellington NEET rates for Māori remain lower than the New Zealand rate while
the Pacific rate is almost on par at 19.0% (Table 2)
Table 1 - Comparison of NEET Rates by Age Category
New Zealand Wellington Region
Year 15-19 20-24 15-24 15-19 20-24 15-24
2010 10.8% 18.0% 14.3% 8.0% 14.1% 11.3%
2014 8.3% 14.8% 11.7% 10.5% 12.6% 11.7%
Source: Statistics New Zealand 2014 unpublished for March each year.
There has been a
Table 2 - NEET Rates for Māori and Pacific Youth Aged 15-24
significant growth in NEET
New Zealand Wellington Region rates in both the Hutt
Valley and Wellington.
Year Māori Pacific Māori Pacific With adequate resources,
WelTec is well-placed both
2010 25.2% 20.0% 22.2% 17.5%
geographically and
2014 22.0% 18.9% 17.4% 19.0% organizationally to
ameliorate this trend. We
Source: Statistics New Zealand 2014 unpublished for March each year.
have one of the best
success rates for this group
Table 3 - Wellington Region NEET Rates in the country.
Location 2010 2011 2012 2013 2014
Porirua 15.5% 14.8% 16.5% 14.4% 11.9%
Hutt Valley 14.6% 12.0% 14.8% 14.9% 18.2%
Wellington City 6.7% 4.6% 4.1% 5.8% 6.9%
Source: Statistics New Zealand 2014 unpublished – due to low population in Kāpiti it is not
possible to identify a Kāpiti NEET rate.
As Table 3 above illustrates:
The NEET rates for Porirua are improving from its peak in 2012 at 16.5% to 11.9% in 2014.
The Hutt Valley rate has deteriorated from its lowest in 2011 at 12.0% to 18.2% in 2014.
Wellington City has deteriorated over the last year from 5.8% to 6.9%.
Page 12Education and Skills
Wellington’s workforce has the highest education attainment levels and skills in New Zealand.
The 2013 census shows that 47% of Wellingtonians had a bachelor's degree level or higher
qualification compared with the national average of 18%.
The Wellington region ranks third of all regions in the proportion of 18 year olds with a minimum
of level 2 NCEA. The national target is 85% by 2017 and Wellington measured 82% in 2012.
For 25-34 year-olds with a minimum qualification at at least Level 4 New Zealand Qualifications
Framework (NZQF), Wellington ranked first with 61%, well above the national 2017 target of
55%.
Despite its high level of academic achievement 13.6% of the Wellington Catchment population
over the age of 15 still has no formal qualification.
The increasing achievement of Level 2 NCEA by students in the Wellington region suggests that
there is likely to be less demand for Level 1 and 2 qualifications at tertiary education organisations
(TEOs) by new enrolling students in the future.
(2013 Census Statistics NZ)
Economy
Economic activity in Wellington is expanding. As with the rest of the country the Wellington economy is
benefiting from a number of factors, including the Canterbury rebuild, high export prices and migration-
driven population.
Economic growth in Wellington has averaged 2% per
annum over the last 10 years compared to 2.2% per annum
for the national economy. Wellington’s workforce is
Wellington accounted for 13.5% of national GDP in 2013. strongly represented in
Quaternary industries accounted for the largest proportion quarternary industries.
of GDP (47%), which is significantly higher than the national The skill-based education
economy (31.%). The Quaternary sector includes the higher of this economically vital
value-adding knowledge based service industries like group will form a growing
information and communications technology (ICT), film and percentage of our student
science. population.
Professional, Scientific and Technical Services made the
largest contribution to growth in Wellington in the year to
March 2013. The industry grew by 5% over the year and contributed 0.5 percentage points of the
regions total growth of 2.0%.
The next largest contributor was heavy and civil engineering construction followed by
construction services.
The region also specialises in information media and telecommunications and has the highest
concentration of web and digital companies in New Zealand. This number is continuing to increase, with
recent data showing that people living in Wellington are more than three times more likely to work in
ICT than people living elsewhere in NZ. The TIN100 2013 report stated that the region’s ICT companies
Datacom Group, Xero, Intergen and Fronde Systems Group boosted Wellington’s growth in the high-
technology sector to three times faster than any other region.
Page 13(Wellington Chambers of Commerce, Smart Capital Profile, June 2014).
The arts and recreation services sector is another regional strength. This sector generated the fastest
employment growth over the last decade. (Regional Economic Activity Report).
The Gross Domestic Product (GDP) is a measure of the monetary value of all the finished goods and
services produced in a specific time. GDP measures relating to the Wellington region show:
GDP per employee (productivity) in Wellington measured $106,212 in the year to March 2013,
which was 16.2% higher than at the national level and is the second highest GDP per capita
behind Taranaki.
The GDP per capita (2013) was $57,941 for Wellington compared to the national figure of
$47,532.
(Source: Census 2013 Statistics NZ, Grow Wellington Quarterly Economic Monitoring Report May 2014)
Industry Trends
The sectors where the most job growth occurred were in the construction and retail and hospitality
sectors, with respectively 14.5% and 9% more jobs than at the same time last year. Much of the
construction employment is likely to be driven by earthquake strengthening in Wellington as well as
related to the Canterbury rebuild and the state highway roading projects.
Nationwide the strongest growing occupations of the year were construction managers (up 57%) and
ICT sales professionals (up 136%).
(Source: Grow Wellington Economic Update)
The largest employing industries are shown ranked in Table 4 and the industries ranked by number of
jobs created is shown in Table 5.
Table 4 Largest Employing Industries In Wellington (2013)
Rank Industry Numbers Employed % Of Total *
1 Professional, Scientific And Technical Services 35,857 13.5 %
2 Public Administration And Safety 28,433 10.7 %
3 Health Care And Social Assistance 24,945 9.4 %
4 Retail Trade 22,511 8.5 %
5 Education And Training 22,098 8.3 %
6 Construction 18,705 7.1 %
7 Accommodation And Food Services 17,087 6.5 %
8 Manufacturing 14,139 5.3 %
9 Administrative And Support Service 12,578 4,7 %
10 Financial And Insurance Services 10,958 4.1 %
*Total includes 9 more industries not given
Source: Infometrics Annual Economic Profile Wellington Region 2013
All of these are well reflected in WelTec’s areas of teaching and research strength.
Page 14Table 5 Wellington Industries Ranked By Job Creation (2012-2013)
Rank Industry Jobs created Annual growth
1 Professional, Scientific And Technical Services 1,008 2.9 %
2 Public Administration And Safety 727 2.6 %
3 Accommodation And Food Services 419 2.5 %
4 Health Care And Social Assistance 406 1.7 %
5 Financial And Insurance Services 389 3.7 %
6 Agriculture, Forestry And Fishing 244 6.1 %
7 Information Media And Telecommunications 109 1.3 %
8 Electricity, Gas, Water And Waste Services 73 4.3%
9 Construction 70 0.4%
Source: Infometrics Annual Economic Profile Wellington Region 2013
Variations from the National Average
The areas of industry in which the Wellington region The areas of industry where the Wellington region is
significantly exceeds the national distribution of significantly below the national distribution of
employees are: employees are:
Financial & Insurance Services Agriculture, Forestry & Fishing
Professional Scientific & Technical Services Manufacturing
Public Administration & Safety
Information Media & Telecommunications
The combined portfolios of Whitireia and WelTec cater for the significant industry groupings shown in
this employment data as well as contributing to national needs.
Page 15Secondary and Tertiary Education Provision
In the Wellington region there are around 32 secondary schools along with 10 parent units and
composite schools delivering at secondary school levels.
There are a number of tertiary providers in the Wellington region including:
Two Universities – Victoria University of Wellington (VUW) and Massey University. (Otago
University also has a medical campus based in Wellington)
Three Wānanga – one of which, Te Wānanga-Raukawa is based in Otaki while the other two, Te
Wānanga o Aotearoa and Te Wānanga o Awanuiārangi, are national providers.
Three Institutes of Technology/Polytechnics (ITPS) – Wellington Institute of Technology and
Whitireia New Zealand are regional ITPs while the Open Polytechnic of New Zealand is a
national specialist provider of distance education programmes.
WelTec works in a close partnership with Whitireia and has strong and specific (project-based)
collaborations with Victoria University, Massy University, Te Wānanga o Aotearoa and the Open
Polytechnic.
In 2013, through our lead role in the Wellington Trades Academy (WTA), we developed 25 Memoranda
of Understanding (MOUs) with regional secondary schools. We look to increase that number
substantially in 2015, extending the WTA’s reach through a collaborative arrangement with Whitireia in
order to deliver 240 trade academy places allocated to the Wellington region for 2015.
Page 16Page 17
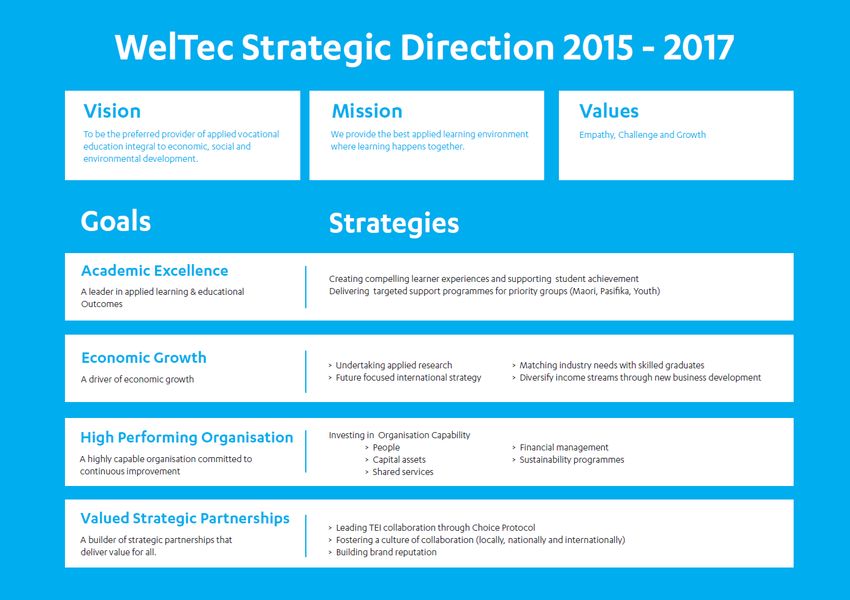
2.1.2 WelTec’s Strategic Direction 2015-2017

Vision
To be the preferred provider of applied vocational education integral to economic, social and
environmental development.
By 2018, learners, industry groups, communities and other key stakeholders will prioritise and invest
in WelTec programmes. Our talented graduates will be highly regarded, in demand and significantly
influencing the quality of life of New Zealanders.
Mission
We provide the best-applied learning environment where learning happens together.
WelTec believes that the best learning environment is a place where learning comes first, and
success for all is expected. We constantly strive to ensure that WelTec is a great place to be, to learn
and to work. We understand that learning happens together, through partnerships, by collaborating
and co-operating.
Values
We subscribe corporately to three core values. Our values set the tone for how we lead and operate
on a daily basis. The values define our culture and are central to our ongoing organisational
development in terms of our people, our processes and plans.

                     EMPATHY                 CHALLENGE                  GROWTH

Goals and Priorities
For the 2015-16 period, we have four directional goals. These focus our effort to achieve our
Vision and Mission.
Our Four Directional Goals
    1.   Be a leader In applied learning demonstrating academic excellence.
    2.   Be a driver of economic growth linking skill development to job creation.
    3.   Be a high performing organisation (continuous improvement and capability development).
    4.   Build strategic partnerships that deliver value.

Goal 1
Be a Leader in Applied Learning Demonstrating Academic Excellence
We value academic excellence, quality improvement, and the application of innovative learning
techniques. Our learners benefit from the delivery of consistently high standards in collaborative
integrated learning. We strive to continuously improve learning models and delivery systems. By
fulfilling our goal in this area we will contribute towards a more highly skilled and knowledgeable
society.

                                                                                               Page 18
Goal 2:
Be a Driver of Economic Growth Linking Skill Development to Job Creation
We will work as partners with business and industry leaders linking skill development to job
creation. Industry constantly review and evaluates programmes within our portfolio to align them
with employment prospects for graduates. We deliver tangible economic value through commercial
applied research and our international activity. We deliver a high return on investment for our
funders and our learners with our focus on providing pathways to higher paid employment and
enhanced socio economic outcomes for students participating in New Zealand (and international
where appropriate) employment markets. We aim to contribute significantly to the growth of both
the regional and national economies.
Goal 3:
Be a High Performing Organisation (Continuous improvement and capability development)
We have a culture of continuous improvement and capability development. We will improve
organisational capability and staff engagement. We manage our infrastructure to maximize
sustainability and create flexible working and learning environments. We engage our people in a
continuous learning culture. Our staff will have the drive, knowledge, skills and resources to deliver
world-class learning experiences. We seek to be exceptional in our processes and support functions
streamlining all interactions with current and future learners providing customer-focused
engagement.
Goal 4:
Build Strategic Partnerships that Deliver Value for All
Our primary partnerships are with the industries that employ our students and graduates.
Through collaboration with our strategic partner Whitireia, and engagement with other tertiary
organisations, we will reduce duplication and increase efficiency in support services and portfolio
delivery. Through our commitment to our Treaty partners we will work alongside iwi to boost
achievement for Māori. We value our relationships with community, regional and national
organisations and seek to engage in partnerships that add joint and tangible benefits to such
organisations and ourselves. Through our stakeholder engagement we will endeavour to meet the
needs and interests of those communities and groups which we mean to support and influence.
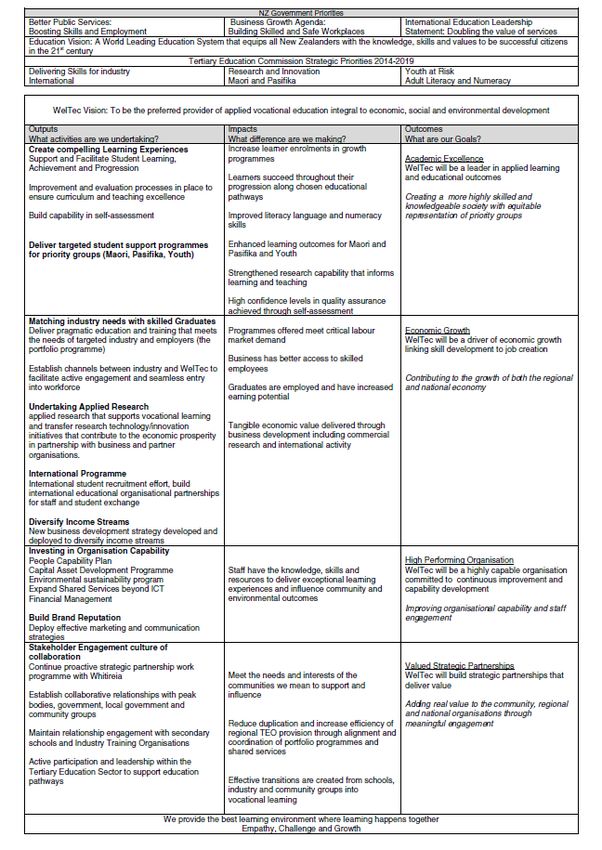
Page 192.1.3 Outcomes Framework Chart
Page 202.1.4 Capital Development Plan
WelTec and Whitireia Integrated Campus Development Strategy
The Council of WelTec and Whitireia have adopted an Integrated Campus Development Strategy as
part of the Strategic Partnership between the two institutions.
Campus Development Goals
WelTec and Whitireia are committed to providing campus environments that:
1. Are vibrant and dynamic
2. Technology-enabled
3. Connected with each other
4. Provide specialist and flexible facilities to support contemporary vocational learning
5. Are accessible to students and the community
6. Support high quality teaching and research
7. Are cost effective to develop, operate and maintain.
Campus Strategy
To provide dynamic, vibrant & contemporary campuses at four main locations:
Wellington City
Porirua
Petone
Auckland
Principles to Support the Campus DevelopmentStrategy
The six principles supporting the campus development strategy are:
1. A joint portfolio wide view underpinning property planning
2. Concentrate investment and activity on core sites
3. Create generic and flexible facilities that support new teaching styles
4. Utilise existing facilities better by changing timetabling strategy and sharing across
Faculties/Schools
5. Joint delivery of some programmes to better utilise existing infrastructure
6. Use Wellington Campus as a flagship for The Choice Protocol.
Ten Year Capital Development Programme
The strategy is being implemented through a Ten Year Capital Development Programme which
outlines the key projects to be undertaken by the institutions either individually or collectively. Both
institutions have utilised Capital Asset Management (CAM) systems to develop the timing and value
of projects included within the approved Ten Year Capital Development Programme. These CAM
systems were independently assessed in 2013 and our assessed performance exceeded the baseline
score in all areas.
Page 21Asset Condition Assessment and Asset Management Improvement
While the Ten Year Capital Development Programme has a high profile, both institutions are
committed to ensuring all asset categories are managed on an equal basis. Over the term of the
2015-2016 Investment Plan, focus will be on improving Asset Condition Assessment processes and
Asset Management Improvement Plans within our CAM. This will allow further refinement of asset
replacement and maintenance planning within our financial projections, particularly for information
technology, software, teaching equipment and teaching material asset categories.
Key Projects
Key projects for both WelTec and Whitireia (greater than $2m) to be completed during the
Investment Plan term over and above business as usual capital replacement requirements are:
Completion of the Regional School of Construction (est. $5.2m)
Completion of the Engineering School re-development in Petone (est. $2.9m).
Whitireia Trades development in Porirua (est. $5.2m)
Establishment of a new Wellington Campus for a 2018 opening (est. $22.5m).
Credit Facilities
Both WelTec and Whitireia have received consent from the Secretary for Education to establish
credit facilities to ensure appropriate liquidity levels are maintained over the next ten years as we
progress with the implementation of the capital programme. Financial covenants and capital asset
management covenants have been agreed to by WelTec in relation to this credit facility. Specifically
WelTec has committed to ensuring Capital Intention Reports are prepared and submitted to the TEC
annually, and that the Ten Year Capital Development business case is updated utilising Treasury’s
Better Business Case template.
Page 222.2 The TES Priorities
2.2.1 TES Priority 1 Delivering Skills For Industry
“An important shift that
Becoming an Engine Room For Industry WelTec is making over the
What We Aspire To Achieve coming years is to build a
system that not only
WelTec will be outstanding at delivering the skilled workers that creates industry-ready
industry needs to move to a higher level of efficiency and graduates but finds them
competitiveness. WelTec is committed to providing an great jobs.
exceptional educational experience centered on delivering high-
quality practical instruction via a relevant curriculum that Our mission is to build
prepares students to graduate with the skills necessary to find more effective links to key
employment in their chosen field. employers in our region
and to ensure the best
Our close partnerships with industry are fundamental to ensure employers select
we are delivering the most relevant programmes to enable skilled our graduates.”
graduates to find jobs
Linda Sissons
WelTec is determined to turn itself into an effective bridge Chief Executive
between learners and targeted industries. We have taken many
important steps along this path and are planning to take many
more.
Our Current Programme
Our Industry Partnership Groups (IPG)
90% of employers are
Each of our internal schools has an IPG made up of representatives
satisfied with the
of industry – typically consisting of large national employers
knowledge and skills of
working alongside mid-tier regional employers.
their WelTec graduates.
We use our IPG relationships to drive the portfolio provisioning of
each of our schools and to ensure what we are delivering is best 88.6% agreed that our
matched to industry needs. students have the skills
their business require.
Business Partnership Team (BPT)
We have recently formed a Business Partnership Team (BPT) 93.3% indicate that their
tasked to build interaction with industry and individual employers. WelTec students have the
Improved outcomes the BPT will deliver include: ability to adapt and learn
Courses and curricula more tightly aligned to market needs new skills rapidly.
Graduates entering the workforce with more job-ready
skills Source: WelTec 2013 Employer
Satisfaction Survey
Faster identification and response to industry training gaps
Working directly with employers on skills development,
especially where this relates to project-based work.
Page 23Wellington Region Infrastructure Projects
We are working collectively with a group of employers (principal contractors and sub-contractors) to
deliver graduates with relevant skills as well as up-skilling the existing workforce.
Information and Communications Technology (ICT) Graduate School
The Government wants to ensure New Zealand has people equipped with the ICT skills required to
keep pace with developments, and is supporting industry-focused education and research that
builds connections between tertiary education providers and high-tech firms. The objectives are to
produce graduates with work-relevant and business-focused skills, provide more direct pathways
from education into employment, and help grow New Zealand’s ICT talent to support firm growth,
innovation and productivity.
WelTec has partnered with Victoria University of Wellington, Whitireia and industry in a proposal to
be the Wellington ICT Graduate School. WelTec’s contribution will include offerings from the Schools
of Business and Information Technology, Engineering Technology and Creative Technologies.
Internships and Other Experience
WelTec has a good track record of working with employers to deliver cadetships, internships and
other workplace opportunities to students. Significant resources are being shifted to expand these
kinds of programmes.
Staff Refreshers
We ensure academic teaching staff are kept up to date with changing workplace realities, including
technological changes. As our teaching staff largely comes from industry and/or still work in
industry, the freshness of knowledge is regularly reinforced.
WelTec Jobs Broker
Through our Jobs Broker Service (JBS) we match graduates with jobs. This service will receive
increasing funding as we significantly strengthen, deepen and broaden our connections with
individual employers and industry organisations.
Supporting the Government’s Business Growth Agenda
The Business Growth Agenda is an ambitious programme of work supporting New Zealand
businesses to grow, in order to create jobs and improve New Zealanders’ standard of living. WelTec’s
planned provison in the coming period strongly supports the Building Skilled and Safe Workplaces
programme of work, in particular by delivering vocational education and training that lifts skills that
are in demand by employers. Our advisory networks provide quality industry and business inputs
Page 24into our programme of study portfolio, ensuring our students have the opportunity to participate in
learning pathways that foster real world skill development.
WelTec plans to continue to provide and further develop a range of work-focused programmes in
the areas of:
Health and Social Services
Hospitality
Construction
Engineering
Creative Technologies and
Foundation Studies - including developments that will enhance the ability of students to gain
NCEA Level 2 with a Vocational Pathway endorsement.
WelTec was an inaugural participant in the Ministry of Business, Innovation and Employment (MBIE)
Māori and Pasifika Trades Training initiative enabling more Māori and Pasifika learners, aged 18-34,
to obtain meaningful trades apprenticeships and qualifications. We will continue to play a key role in
this scheme (and any similar schemes that may become available) where the end goal is that all
participants gain skilled and sustainable employment.
Supporting Corrections and Access to Quality Education for Prisoners
The Department of Corrections and WelTec are working together to provide access to quality
education for prisoners that supports the achievement of Better Public Service (BPS) targets,
especially BPS Target 8 which aims to achieve a 25% reduction in re-offending by 2017.
Corrections wish to work with WelTec to maintain (ideally grow) current provision. Discussions are
continuing with TEC to ensure Corrections, as a key customer, has its needs met by WelTec
provision.
While WelTec currently has been delivering on-site at Rimutaka Prison, Corrections have also
approached us regarding possible delivery at other Corrections facilities.
National Engineering Education Plan
The National Engineering Education Plan has identified a shortfall in the number of students
enrolling in engineering courses – particularly for ITPs and at the level of technicians and
technologists.
In July 2014, the Government launched a new Engineering initiative - Education to Employment
(E2E) to promote engineering as a career to students, with bridging courses, work placements, and
scholarships, particularly to grow enrolments at institutes of technology for people wanting to
become engineering technologists and technicians. The TEC is co-ordinating representatives from
engineering professional bodies, industry representatives, education and training providers to work
together to address the issue. WelTec will actively participate in this intiative.
Page 25Science Technology Engineering and Mathmatics: STEM
Along with Victoria University of Wellington (VUW), WelTec plans to continue to offer Maths Boot
Camps and Foundation Studies courses to prepare students for diploma and degree level
engineering qualification study.
Our Plan Going Forward
Our plans include tendering with partners VUW and Whitireia for the ICT Graduate School; and
continuing to grow our international and national reputation as providers of skilled graduates for the
film animation and interactive media industries. We plan to:
1. Provide a better bridge between industry and graduates. Further development of our
Industry Partnership Groups, Jobs Broker Service and other activity in order to best match
programme offerings with industry need.
2. Develop more partnerships with business. Focus on increasing partnerships, bringing
industry (and individual employers) even more centrally into student learning and work
experience opportunities.
3. Improve course alignment. Work with key employers (and employer groups) to tailor
offerings that best suit employer and industry needs and drive wider economic benefits for
all.
4. Support Government priorities. Further development of our areas of strength that directly
relate to the government’s key focus areas.
5. Build student work-readiness. Better prepare students for industry and improve the fit of
graduates with industry.
How We Will Check We Are On Track
Track employment rates of our graduates. We will use existing information but also need to
develop more sophisticated tracking of graduates’ employment outcomes.
Employer Surveys. We will continue to survey employers to ensure that WelTec graduates
are meeting their needs and expectations in terms of both soft and technical skills.
Industry Partnership Groups. We will at least annually review the impact and effectiveness
of our Industry Partnership Groups to ensure that they are fit for purpose.
Reported Outcomes
Refer to Part 4 and the Performance Measures relating to:
Employer satisfaction
Graduate destinations
Economic impact
Key stakeholder satisfaction
Page 262.2.2 TES Priority 2 Getting At Risk Young People Into A Career
What We Aspire To Achieve
WelTec, in collaboration with stakeholders, will seek to “Delivering to at-risk
reduce the number of young people in our community not youth is at the heart of
involved in education or employment. Our aim will be that much of what we do.
our under 25 year old cohort gain credentials during their
With a significant
time with WelTec that will result in them gaining secondary transition to
employment or going on to further study. Currently: tertiary programme, and
60% of our students are under 25 much resource focused
13% under 18 on youth learner
25% between 18 and 20 provision, we have a
significant investment in
22% between 21 and 24.
the future of youth and
Over the 2006–2013 period WelTec has consistently had one at-risk youth,”
of the highest proportions of students under 25 years of age
Alan Cadwallader
in the ITP sector1 and occupies one of the top league Academic Director
positions in Youth Guarantee provision.
Our Current Programme
Secondary School Level
Wellington Trades Academy (WTA). At secondary level we provide an alternative education
pathway for youth through our WTA offerings.
In addition to our fulltime Trades Academy, we also have invested this year in a pilot Trades
Academy programme agreement with Wainuiomata High School in collaboration with Tamaiti
Whangai. Students in this programme are attending three days at their school and two days at
WelTec.
The WTA will move to a fully part-time model of delivery in 2016. In 2015 the Academy will offer 90
full-time places in Petone and 150 part time places where students will attand the Academy 2 days
per week. Part time offerings will be available in Petone, Wellington City and Porirua.
Alongside our Trades Academy offering our secondary to tertiary transition offerings include:
STAR
Information sessions (Pathways to Your Future)
Taster day programmes eg Chef for a Day
Foundation Level 1 and 2 programmes
Summer maths
Foundation Engineering offered to provide pathways for students into higher-level
engineering programmes.
1
http://www.educationcounts.govt.nz/statistics/tertiary_education/participation Provider-based-equivalent-full-time-students-EFTS-
12062014.xls
Page 27Hutt Valley Youth Guarantee Network Working Group
We are a member of the Hutt Valley Youth Guarantee Network Working Group – which looks at
ways that providers, youth support networks, secondary schools and industry in the Hutt Valley can
work together to support youth to be engaged in education, training and work.
Not in Education, Employment and Training (NEET)
We work closely with youth specialists and NEET facilitators. We will continue to do so in the future.
Māori, Pasifika and Youth Mentors
We have an excellent team of Māori, Pasifika and youth mentors. Our Mentors support students
with their transition to tertiary study.
We focus on how youth learners can progress locally and nationally and how the student pastoral
care systems and tutor professional development best supports this learning.
Our Learning Resource Services provides student mentors and an Ability Resource service for
students with a disability.
Our Learning Commons Tutors also offer a wide range of educational support to help students.
Other Initiatives
Career Quiz. We have developed an online career quiz which students can use to do a self-
assessment which can link back to WelTec’s website and provide links to useful web tools.
Tertiary Career Benchmark Advisory. WelTec is implementing the tertiary career
benchmarks as part of our self-assessment for each programme area, with particular focus
on student outcomes. In order to facilitate this, we have formed a Tertiary Career
Benchmark Advisory.
Our Plans Going Forward
Our key developments during this plan period include:
Attract more school leavers. Working with Whitireia to attract more school leavers from the
wider southern North Island catchment.
Build Secondary Schools Engagement. Development of a comprehensive secondary schools
engagement strategy that is multi-tiered to suit all end users.
Improve Access to Quality Information. Improve the quality of information and career
advice offered to younger students entering WelTec programmes to enable them to make
confident and informed choices.
Better Targeted Programmes. Structuring programme offerings in order to enable us to
deliver a sharper range of service to a wider group of youth learners.
Better Pathways. Aligning our offerings with the Vocational Pathways, enabling us to better
connect study choices with career offerings.
Page 28You can also read