2017 Minnesota Statewide Health Assessment - This document is made available electronically by the Minnesota Legislative Reference Library as part ...
←
→
Page content transcription
If your browser does not render page correctly, please read the page content below
This document is made available electronically by the Minnesota Legislative Reference Library
as part of an ongoing digital archiving project. http://www.leg.state.mn.us/lrl/lrl.asp

                                             2017 Minnesota
                                             Statewide Health
                                             Assessment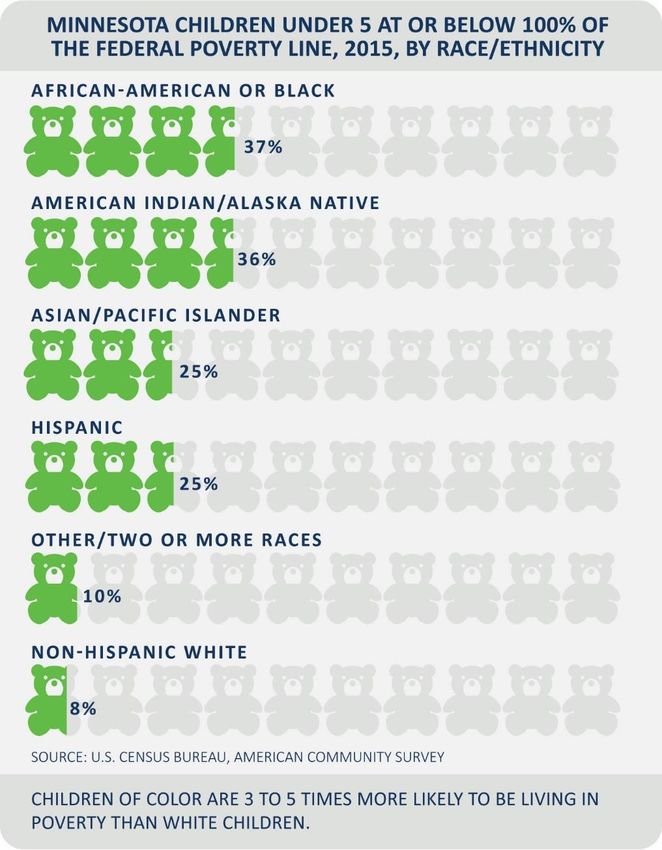

2017 Minnesota Statewide Health Assessment
The 2017 Minnesota Statewide Health Assessment was produced in collaboration by the Minnesota Department of
Health and the Healthy Minnesota Partner ship. This report was supported by funds made available from the
Centers for Disease Control and Prevention, Office for State, Tribal, Local, and Territorial Support, under Federal
Award Identification Number (FAIN) NB01OT009130. The content in this report is that of the authors, and does not
necessarily represent the official position of or endorsement by the Centers for Disease Control and Prevention.

Suggested citation: Minnesota Department of Health. (2017). 2017 Minnesota Statewide Health Assessment.
Produced in collaboration with the Healthy Minnesota Partnership. St. Paul, MN.

Minnesota Department of Health
Center for Public Health Practice
PO Box 64975,
St. Paul, MN 55164-0975
(phone) 651-201-3880
http://www.health.state.mn.us/statewidehealthassessment/

Upon request, this material will be made available in an alternative format such as large print, Braille or audio recording.
Printed on recycled paper.
2 0 1 7   M I N N E S O T A   S T A T E W I D E     H E A L T H   A S S E S S M E N T

Foreword to the 2017 Minnesota Statewide Health Assessment
                         Minnesota is a wonderful state with strikingly beautiful lakes, rivers, forests, and
                         grasslands; vibrant urban, suburban, and rural communities; numerous
                         passionate and committed civic-minded people; many world-famous
                         institutions; and a robust economy. Overall, Minnesota is a great place to live,
                         work, play, pray, and raise a family.

Minnesota is also grappling with unprecedented change precipitated by events and policies at local,
national, and global levels. Shifting weather patterns, political polarization, tragedies in our
communities, changing demographics, and exploding social media bring us massive amounts of
information on a 24-7 cycle, and challenge us to step up and meet the future as never before.

  This 2017 Minnesota Statewide Health Assessment is a frank look at the challenges to health in
  Minnesota. It is a joint effort of the Healthy Minnesota Partnership and the Minnesota
  Department of Health. I am grateful to the many individuals and organizations who have
  brought this document into being.

When we consider the averages, Minnesota compares quite well overall for health, economic
opportunity, civic engagement, and more. In areas where we don’t do so well, we see some positive
trends in the last five years—teen pregnancies are down in every population, for example, and high
school graduation rates are up. But we also see some major challenges. Deaths from opioid overdoses
and other diseases of despair are rising fast, and inequities—in everything from infant mortality and
educational achievement, to employment, rates of home ownership and incarceration—stubbornly
persist. It’s these inequities that challenge the description of Minnesota as doing so very well: it’s doing
well for some, but not for everyone.

As commissioner of health, I cannot be content with averages that mask the real health of many people
in both urban and rural Minnesota—especially people with disabilities, American Indians, African-
Americans, Hmong, Somalis, people with Latino heritage, the LGBTQ community, elders, women, and
children.
2 0 1 7   M I N N E S O T A     S T A T E W I D E    H E A L T H   A S S E S S M E N T

The 2017 Minnesota Statewide Health Assessment is a critical step in examining Minnesota’s inequities
by race and ethnicity, gender, age, sexual orientation, geography, and disability, so that we can work
together for change. Together our strengths can equip us to meet the challenges of today and
tomorrow head on—provided we make room at the table for all.

Some tragic and traumatic events in Minnesota over the last few years have underscored the importance of
confronting racism and all forms of hate in Minnesota. Acts of violence, exclusion, and discrimination, as well as
unjust social and economic structures, do not represent the values that guide the work of either the Healthy
Minnesota Partnership or the Minnesota Department of Health. I trust that they also do not reflect the vision and
values of the vast majority of Minnesotans. Our growing racial and ethnic diversity is deepening our knowledge
and broadening our vision of how to live in a way that helps all of us thrive.

Minnesota is a headwater state—a place where things begin and flow outward—not just for the Mississippi River
but also for public health. The 2017 Minnesota Statewide Health Assessment is a headwater document, a source
for ideas and actions that can spring into being and stimulate change. This assessment allows us to look directly at
our challenges and decide our response. I hope we all use these findings to channel our shared passion and
commitment toward making sure Minnesota lives up to its image as a great place to call home—for everyone.

Edward P. Ehlinger, M.D., M.S.P.H.
Commissioner
Minnesota Department of Health
T H I S   P A G E   L E F T   I N T E N T I O N A L L Y   B L A N K

.
2 0 1 7   M I N N E S O T A   S T A T E W I D E            H E A L T H         A S S E S S M E N T

                              CONTENTS
                               INTRODUCTION ............................................................. 1
                               What is health? ............................................................................. 1
                               What creates health? .................................................................... 1
                               What is health equity? .................................................................. 1
                               Structural racism and health equity .............................................. 2
                               Looking beyond averages .............................................................. 3
                               “Our” health .................................................................................. 4
                               Childhood as a “critical moment” for lifetime health .................... 4
                               The challenges of a statewide health assessment .......................... 5
                               Across time ................................................................................... 7
                               PEOPLE ......................................................................... 8
                               Different geographies: one Minnesota .......................................... 9
                               Minnesota’s children ..................................................................... 9
                               The aging of Minnesota ............................................................... 11
                               Race and ethnicity in Minnesota ................................................. 11
                               The LGBTQ population in Minnesota ........................................... 14
                               Persons in Minnesota with disabilities ........................................ 14
                               OPPORTUNITY ............................................................. 16
                               Opportunity and our health ......................................................... 16
                               Education .................................................................................... 16
                               Income ........................................................................................ 19
                               Employment and benefits............................................................ 23
                               Housing ....................................................................................... 29
                               Transportation ............................................................................ 30
                               NATURE ...................................................................... 31
                               Nature and our health ................................................................. 31
                               Climate ........................................................................................ 31
                               Air quality ................................................................................... 32
                               Water .......................................................................................... 35
                               Outdoor recreation ..................................................................... 36
                               Food ............................................................................................ 37
                               BELONGING ................................................................. 39
                               Belonging and our health ............................................................ 39
                               Racism and infant mortality ........................................................ 39
                               Early life experience .................................................................... 40
                               Incarceration ............................................................................... 44
                               Homelessness .............................................................................. 45
                               Isolation ...................................................................................... 46
                               Sexuality ..................................................................................... 47
                               Physical and sexual violence ........................................................ 48
                               Belonging in school ..................................................................... 49
                               Deaths of despair and disconnection ........................................... 50
                               The health care system ............................................................... 53
                               WHAT COMES NEXT? .................................................... 55
                               Starting with Minnesota’s strengths ............................................ 55
                               Moving to a state of well-being ................................................... 57
                               THE HEALTHY MINNESOTA PARTNERSHIP ....................... 58
                               Membership ................................................................................ 59
                               MDH Staff to Partnership ............................................................ 59
                               END NOTES ................................................................. 60
I N T R O D U C T I O N

Introduction
What is health?
The World Health Organization calls health, “a state of
complete physical, mental and social well-being and not
merely the absence of disease or infirmity.”1 Everything in
our lives — our families, homes, neighborhoods, jobs,
schools, the land, water, and air — must support our health.
Health is a resource for our everyday lives.2 If we are healthy, we can engage with our family and friends, attend
school, go to work, play, and be active participants in society by volunteering, voting, and more. Each of us is
part of multiple communities, and our health results largely from our interactions with the people and the
places that surround us, including both the man-made and the natural world.3 Because health comes from our
interactions, health is something we shape together, and each person’s health is affected by every other
person’s health.

What creates health?
For many years, public health has been concerned with individual behavior change as the means of improving
health. We are familiar with the advice to eat right and exercise. We are convinced that if we are overweight, if
our blood pressure is high, or if we have trouble sleeping that the fault is our own. But research does not
support this view. Without discounting the role of the individual, studies show that the circumstances of our
lives — in particular where we live — play the largest role in our health. Where we live determines our options
and influences our choices no matter how well-intentioned or motivated we may be to “make healthy choices.”4

Decades of study on the social determinants of health show that the policies and processes that shape the daily
circumstances of our lives are what really create health. Our individual behaviors are overshadowed by a much
larger set of economic and social forces put into action by policy decisions at every level of government.

The perspective that health is dependent on the individual continues to dominate in U.S. society, and prevents
us from making the kinds of changes that would generate good health: policies that assure all children thrive,
equitable educational and job opportunities, shared power and decision-making, access to health care,
affordable housing, multiple transportation options, and unpolluted environments.

What is health equity?
Health equity is a state of affairs where everyone has what they need to be healthy and no one is prevented
from being as healthy as they can be by unjust or unfair barriers. We can only achieve health equity when all
children get a loving and healthy start; when we can all get a good education and good jobs; when we can all

                                                    1
I N T R O D U C T I O N

take part in the decisions that shape our communities; and when we all have good living conditions. When some
of our populations are not as healthy as they could be, it is typically because of inequities in these conditions.
Inequities in health outcomes can only be eliminated when each of us has the opportunity to realize our health
potential — the highest level of health possible for us — without limits imposed by structural inequities.

To achieve health equity, we need to tell a story about health that goes beyond the individual and is based in
our growing understanding of what really creates health. A collective narrative stresses joint action and
acknowledges the role that policy decisions play in shaping the material circumstances of our lives. We
understand that we all share the responsibility of creating healthy communities where everyone can thrive,
instead of each of us being solely responsible for our health.

Structural racism and health equity
Race is a social construct that divides people based on visible, physical characteristics such as skin color, eye
color and shape, and hair color and texture. The notion of race, rather than nationality, developed only a few
hundred years ago.i Race gave rise to racism, and dividing human groups into distinct races served to rationalize
the oppression of large populations by characterizing some people as less than fully human. Slavery, genocide,
displacement, and other acts of oppression toward entire populations, were justified by governments and
others in power based on race.5
We can define racism as believing one’s own race is superior to others, seeing the “other” as a threat, and
treating people differently according to certain easily identifiable physical characteristics.ii Some racism is
individual and overt, in the form of prejudicial comments or discriminatory actions. Some racism is individual
but implicit, as when a person’s attitudes influence their behaviors, but they are not aware of their bias. Some
racism is institutional, in the form of policies, practices and procedures that work better for white people than
for people of color or American Indians. Institutional racism, unlike individual racism, can be unintentional or
inadvertent. Some racism is structural, based on historical and current institutional racism across all institutions,
creating a whole system that negatively impacts populations of color and American Indians.
Structural racism works through policies and processes, which then perpetuate racial inequities. iii Structural
racism sets the stage for some groups to do better than others across generations. For example, federal lending
policies after World War II that allowed discrimination on the basis of race, and kept African-Americans from

iThe genetic variation within one population group is actually much wider than the variation between different groups supposedly
characterized by “race.” For more information, see: Adelman, L. (Executive Producer). (2003). Race: The power of an Illusion
[Television series]. California Newsreel.
ii
 To categorize is human. But when some people chose to categorize other people according to a few superficial physical
characteristics (such as skin color, hair and eye color, hair texture, and/or facial features), and then decide that those
characteristics make people more or less valuable: that is racism. Historically, in the U.S. those with lighter colored skin, eyes and
hair receive preferential treatment while those with brown and black skin, eyes, and hair experience more exclusion and
discrimination. Discrimination leads to poor health, and thus is a serious public health concern.
iii
  The Minnesota Department of Health describes structural racism as “the normalization of historical, cultural, institutional and
interpersonal dynamics that routinely advantage white people while producing cumulative and chronic adverse outcomes for
people of color and American Indians.” For more information, see:
Minnesota Department of Health. (2014). Advancing health equity in Minnesota: report to the legislature at
http://www.health.state.mn.us/divs/chs/healthequity/ahe_leg_report_020414.pdf.

                                                              2
I N T R O D U C T I O N

obtaining mortgages. During this same period, many white Americans bought homes and built wealth, and later
passed it on to their children. Today, the rate of homeownership for white people in Minnesota is three times
the rate for African-Americans (76 percent vs. 22 percent). The homeownership disparity creates new disparities
when, for example, programs or policies are designed to benefit homeowners but not renters. Because the
original disparity was based on race, the new structures also have a disproportionate negative impact on people
of color. That’s structural racism.
Racism, whether hidden, overt, individual or structural, continues to be a powerful force in American society,
and we cannot ignore its impact on health. This statewide health assessment emphasizes race and racism,
because these issues are so challenging and pervasive, and because racism compounds other forms of
discrimination. Yet, racism is not the only form of discrimination that we experience. Those of us who are seen
as different — having physical or mental disabilities, being female, being old, immigrant, lesbian, gay, bisexual,
transgender, having been in jail or prison, having mental illness, having lower incomes or social class — also may
have the experience of not being seen, heard or consulted, being subjected to derogatory comments, and
having our needs ignored. Race often compounds these challenges. Research shows that the constant stress
associated with discrimination can generate changes in our bodies that lead to more chronic disease, a higher
rate of infant mortality, and earlier death.

Looking beyond averages
With the guidance of the Healthy Minnesota Partnership,iv the Minnesota Department of Health (MDH) takes
stock of the health of all people in Minnesota every five years through a statewide health assessment.v The 2017
Minnesota Statewide Health Assessment tells the story of our health today and how it has been shaped over
time by opportunities, belonging, and interactions with nature. In each section of this assessment we link data
on social, economic and environmental conditions with rates of disease or individual health behaviors to
strengthen our understanding of what creates health and health equity. The assessment sets the stage for
Healthy Minnesota 2025, a statewide health improvement framework, which will guide our collective efforts to
assure that we achieve the Partnership’s vision:

                   All people in Minnesota enjoy healthy lives and healthy communities.

The work of the Partnership helps to expand the way policymakers and others understand and act for our
health, and is similar to the MDH vision statement:

                 The MDH vision is for health equity in Minnesota, where all communities
                     are thriving and all people have what they need to be healthy.

iv
 The Healthy Minnesota Partnership is a collection of diverse leaders from across Minnesota brought together by the
commissioner of health. For membership, see page 61.
vThe statewide health assessment is required for accreditation of MDH by the national Public Health Accreditation Board. The
assessment, which is to be produced at least every five years, provides information and a framework for planning and action for
anyone in the state, including MDH and the Healthy Minnesota Partnership. This group guides the development of the statewide
health assessment in accordance with accreditation standards.

                                                           3
I N T R O D U C T I O N
Both statements stress that all people and all communities in Minnesota should have the opportunity to be
healthy, but this is not true in Minnesota today. If we are able-bodied, gender-conforming, Judeo-Christian, and
of European descent, we likely enjoy advantages that help us to be healthy — good schools, access to jobs and
recreation, stable housing. Others of us struggle to meet our basic needs, and face daily obstacles to our
opportunity to be healthy, particularly those of us who are of American Indian, African, Hispanic/Latino, and
Asian descent, who have different religious beliefs and practices, sexual orientations or gender identities, or
who are disabled.
This assessment intends to help make clear the association between the conditions of our lives and our health,
and to reveal the sources of health inequities experienced by many people in Minnesota.
The 2017 Minnesota Statewide Health Assessment has four sections, reflecting what we need to be healthy:
▪ People: Looks at who we are, where we’ve come from, and how our real and perceived differences play a
role in shaping our health.
▪ Opportunity: Our health is related to our opportunities for education, employment, income, housing and
transportation. Data exposes the persistent inequities in social and economic opportunity that continue to
oppress many people in Minnesota and result in generations of poor health.
▪ Nature: Our health is shaped by our connection to and interactions with the natural environment –
including the impact our actions have on the air water and soil – and the places we live, learn, work, and
play.
▪ Belonging: Inclusion in the community and our connections with each other enhance or weaken our
health, from early childhood and continuing through our later years.
“Our” health
In this assessment, we prefer to use the words “we” and “our” to describe our populations and our health rather
than “them.” This construction emphasizes that we can only be healthy if we are all healthy together.
We are healthy together when the conditions in our communities support everyone’s health. Many of those
conditions are created by policy decisions, such as zoning, transportation, and more. Identifying the conditions
in our communities and understanding how they shape our health is critical for achieving our vision of a healthy
Minnesota.
Childhood as a “critical moment” for lifetime health
Early childhood is a critical time to maximize the opportunity for a healthy future. Early nutrition, the material
environment, and interactions with nature and with the people around us are all potent influences on our life-
long health. Parents who receive support to provide safe, stable, and nurturing environments can help their
children grow into strong, successful adults. Homes full of affection and free of the stress caused by poverty and
other negative conditions help us develop good mental, social, and physical health. Traumatic childhood
experiences increase our risk for a host of negative health behaviors and health outcomes throughout the
lifespan.
The impact of opportunity, nature, and belonging on children is highlighted in each section of this assessment.
4I N T R O D U C T I O N
The challenges of a statewide health assessment
Conducting a statewide assessment of health presents a number of challenges and raises certain tensions,
such as:
THIS ASSESSMENT CAN ONLY SAY A LITTLE, ABOUT A LOT OF THINGS
This statewide health assessment provides snapshots of many data points, to draw an overall picture of health
and the conditions that create it. Many topics are here that others have studied and written about in great
detail; thorough references are available in the end notes.
Only limited statewide data are available for some populations, such as the LGBTQ (lesbian, gay, bisexual,
transgender, and queer/questioning) community, specific ethnic and cultural groups such as Somali and Hmong
populations, and people with disabilities. This makes it challenging to make population-level comparisons and
provide a complete picture of the health and health inequities experienced by these populations.
DATA CATEGORIZES US
Each individual is unique, each population is unique, each community is unique, and each has value. However,
quantitative research methods require creating categories for analysis, and grouping people, populations, and
communities in such a way that hide some of our real and important differences while allowing comparisons
(see “diversity within diversity,” below).
In addition, many issues in this assessment could fit in more than one section, because many issues overlap and
have multiple dimensions. In order to increase readability, therefore, certain editorial choices were made.
A statewide assessment can only start the conversation about health in the community. The work of advancing
health equity requires engaging with people and communities to more fully understand all our unique
circumstances and to shape action for change.
RACE AND CLASS IMPACT HEALTH IN DISTINCT WAYS
In order to reveal structural racism and keep the conversation going about race and health in Minnesota, this
assessment provides information by race/ethnicity as often as possible. In some places, data is also presented by
income. While income is sometimes used to signify social class, income and class are not exactly the same. Social
class or “socio-economic status” (SES) includes additional factors like occupation and education.
Race, income, and social class are related, because the effect of racism has relegated American Indian, African-
American, Hispanic/Latino, and other populations of color to a lower socio-economic status.vi It can be tempting
to assume that talking about poverty alone is sufficient in considering the effects of race/ethnicity on health, but
to do so would ignore the separate effect of racism on health, which is significant itself.
viKrieger and Bassett state: “The facts of being black derive from the joint social relations of race and class: racism
disproportionately concentrates blacks into the lower strata of the working class and further causes blacks in all class strata to be
racially oppressed.” For more information, see: Krieger, N. and Bassett, M. (1986). "The health of black folk: Disease, class, and
ideology in science." Monthly review, 38, 74-85.
5I N T R O D U C T I O N
In some parts of Minnesota, the populations of American Indians and persons of African, Hispanic/Latino, or
Asian descent are quite small (2 percent or less). In these regions, it is essential to consider the role of social
class in shaping health inequities through generations of white families.
THERE IS DEEP DIVERSITY WITHIN DIVERSITY
Although much of the data here are presented by race/ethnicity to reflect the diversity of the state’s
populations, the differences within each population group can be as great as the differences between different
population groups.vii While public health has made progress in differentiating, for example, African-born people
from U.S.-born African-Americans, and identifying significant Asian groups like the Hmong, in general the data
available for a statewide health assessment do not permit the analysis of all possible differences within every
population. Data throughout the assessment should be understood as providing clues to the health of different
populations, but not the whole story.
TRAUMA AND RESILIENCE ARE PART OF CHANGE AND HOPE
The story of health is one of both trauma and resilience. When looking at disparities by race and ethnicity, it is
very easy to feel that everything about Minnesota’s communities of color and American Indian populations must
be cause for concern. Yet, painting a picture of despair is inaccurate and unhelpful, because it perpetuates
deficit-based models and narratives. It does not take into account a community’s strengths. Minnesota’s
communities of color and American Indian populations have endured generations of trauma, as well as recent
traumas. It is important to remember that with trauma comes both vulnerabilities and resiliency. Vulnerabilities
(or risks) include health, socioeconomic, and educational disparities. While community assets like the
preservation of language and culture; strong and close-knit cultural communities; and adaptability and
determination in the face of adversity are resiliency factors. Efforts to advance health equity must take into
account vulnerabilities stemming from trauma, while supporting the resilience that exists within communities to
create culturally-grounded solutions.
THINKING ABOUT INDIVIDUALS CAN OVERSHADOW THE ROLE OF SYSTEM
Most of what we know today about health comes from data collected on individuals: individual rates of disease
or injury, and individual behaviors like smoking and exercise. When we emphasize personal choice as the key
strategy for improving health, we attribute health problems to the individual alone, rather than seeing each
person in a set of surroundings. However, our growing understanding about what creates health pushes us to
locate the source of health problems in the systems and structures that shape individual behavior and health
across our communities, for good and for ill.
The tension persists because so much of what we know about health comes from our analyses of individuals,
and because the individual and his/her ability to make choices is still important. The challenge that confronts us
is to move from a focus on individuals to an analysis of communities and to get much better at addressing the
policies and systems (economic, educational, social, and more) that create or hinder health.
vii
The category of Asian or Asian Pacific Islander (API), for example, encompasses over 40 different countries with very different
languages and cultures. For more information, see: Council on Asian Pacific Minnesotans: About Us
https://mn.gov/capm/council/about-us/.
6I N T R O D U C T I O N
Across time
This assessment embraces the multiple perspectives of past, present, and future. It includes references to past
actions and historical trauma. By highlighting current inequities, the stage is set for a different tomorrow.
▪ We must learn about and understand the past to confront the issues of today. If we will not or cannot see
the impact of historical policies on health, we cannot understand health inequities or make good decisions
for the future. The past also gives us examples of hope and progress.
▪ We must act in the present. Historical reflection and understanding should lead to concrete steps for
change today. We can always do something now.
▪ We must engage in the work of advancing health equity with hope for the future. It is easy to become
overwhelmed by the severity of health inequities. With growing partnerships and the wisdom of many we
can build our collective efforts toward meaningful change.
This statewide health assessment provides a grounding for people and organizations in Minnesota to develop
plans for improving health (see “What comes next?” at the end of this document).
7P E O P L E
People
In 2015, 5,485,238 people lived in Minnesota.6 Nearly 73 percent (4 million) live in urban areas, about 11
percent (over 600,000) live in or near large towns, roughly 7 percent (nearly 390,000) live in or near small towns,
and about 8 percent (more than 434,000) live in more remote rural areas.viii
Our population is projected to grow. According to the Minnesota State Demographic Center:7
▪ Minnesota's total
population is estimated to
exceed 6 million by 2032,
and grow to nearly 6.8
million by 2070.
▪ In the coming two decades
(2015-2035), the
population under age 18
will grow modestly (by just
32,000). Meanwhile, the
population age 65 and
older will grow much more
rapidly, adding more than
half a million people
(510,000+) over that same
period. By 2035 – for the
first time in our state's
history – we will have
more adults over age 65
than children.
▪ The percent of
Minnesota's population
comprised of people of
color (those self-
identifying as one or more
races other than white,
and/or Latino) is projected
to grow from 14 percent in
2005 to 25 percent by
2035.
viii
Large towns are defined as having 10,000 to 49,999 residents and small towns as having 2,500 to 9,999 residents. For a
discussion of these terms, see: Minnesota State Demographic Center: A greater understanding of “Greater Minnesota” (and
“metro” areas) https://mn.gov/admin/demography/news/ada-to-zumbrota-blog/?id=36-245952.
8P E O P L E
Different geographies: one Minnesota
Where we grow up, where we live, work, and play all deeply influence our identities, values, opportunities, and
ultimately our health. Minnesota has communities of every size, all valuable and all “Minnesotan.” When
assessing challenges or developing solutions, we often approach the state as being simply either urban or rural,
which can quickly turn into “us” versus “them.”
But we are not urban or rural; we are urban and rural, and much more besides. Counties in the Twin Cities
metropolitan areas include farmland and large open areas. Cities and towns in greater Minnesota share many of
the same challenges as Minneapolis and St. Paul. No matter where we live now, many of us have roots or deep
and lasting relationships with people and places across the state. Illness and health are not constrained by
geographic boundaries and categories; inequities in opportunity and health exist across our state.
While communities across Minnesota are unique, we have many concerns in common. For example:
▪ Our young children face a growing rate of poverty
▪ Aging populations challenge our capacity to adapt to the growing needs of our elderly, while still attending
to the needs of our young people
▪ Increasing racial and ethnic diversity in every Minnesota region requires us to confront discrimination and
assert our values of equity and opportunity for all
▪ Increasing numbers of families struggle to make ends meet, highlighting the importance of assuring
opportunities for education and good jobs with benefits
▪ Scarcity of affordable housing limits the ability of our young families and new immigrants to establish
themselves and provide a healthy living environment for their children
▪ Population changes challenge our ability to maintain our infrastructure (roads, bridges, water quality,
sewers, schools and more) and protect the health and well-being of all residents
▪ Growing pressures on our transportation systems mean we must assess our capacity to provide equitable
access to jobs and increase economic opportunity across the state
As Minnesota’s population grows and changes, we need to harness the strengths of our commitment to and
shared vision for a Minnesota where everyone can thrive.
Minnesota’s children
In 2014, almost 24 percent (1.3 million) of the state’s population was under 18. Over half of our state’s children
(55 percent) live in the seven-county Twin Cities metropolitan area, and the remaining 45 percent live in the
other 80 counties.
Children and youth with special health needs are those who have (or who are at increased risk for) a chronic
physical, developmental, behavioral, or emotional condition. Children with a disability face a lifetime of physical
and social challenges, including discrimination. The challenges of parenting a special needs child can stress a
family, increasing financial burdens and difficulties accessing adequate physical and mental health care and
social support.
9P E O P L E
Almost one in five Minnesota families with children has at least one child with a special health need (estimates
of children with special health needs in Minnesota range from 160,000 to 200,000).8
Some of the demographic changes taking place highlight the importance of attending to children’s health and
opportunities.
Minnesota’s children are far more diverse than previous generations, and many have parents who are
immigrants.
▪ From 1990 to 2012, the
number of Hispanic
children in Minnesota
grew from almost 2
percent of all children
(20,858) to over 8 percent
(103,308).
▪ The number of black
children with a foreign-
born parent grew from less
than 0.5 percent (1,966) to
over 3 percent (39,188).9
▪ About 14 percent
(165,400) of all children in
Minnesota lived in poverty
in 2015;10 African-
American and American
Indian children are the
most likely to be poor in
Minnesota.11
It is critical to address these challenges facing our children so every child
has the opportunity to grow up healthy.
10P E O P L E
The aging of Minnesota
The Minnesota State Demographer expects the total number of persons age 65 and over to double between
2010 and 2030, until more than one in five of us will be an older adult.12
Aging presents new challenges to health, including increasing levels of disability. For example, older adults are at
increased risk of injuries from falls, over half of which occur at home.13 Aging also presents new opportunities —
to volunteer in the community, to try a different career, or to take on a new role in the family. For example, 42
percent of Minnesota adults age 65 to 74 volunteer.14
▪ About one-third (32 percent) of people in the urban areas of Minnesota are age 50 or above; this rate rises
for large towns (38 percent), small towns (41 percent), and rural areas (44 percent).
▪ More than 1 in 20 residents (6 percent) in rural and small town areas are presently over 80 years old, and
the state demographer anticipates the rate will continue to rise.15
Securing adequate income can be challenging as adults move out of the workforce and depend on other sources
of income, such as Social Security.
▪ Older adults in Minnesota experience significant racial disparities in income: the median income for white
adults over age 65 in Minnesota is $40,054; the median income for black adults of the same age is
$18,417.16
The aging of Minnesota is an opportunity to rethink workplaces, redesign living spaces, and create communities
that support and celebrate people of all different ages and abilities.
Race and ethnicity in Minnesota
Minnesota is rapidly becoming more racially and ethnically diverse.ix Census data from 2000-2014 shows that
the rate of growth among populations of color (74 percent) far outpaced that of the state’s white population (2
percent). Asian, black, Hispanic/Latino and multiracial populations will continue to grow more rapidly than the
state’s white non-Hispanic population in the coming decades. The state demographer estimates that the
number of people of color in Minnesota will increase by over 500,000 between now and 2035.17
This change is taking place statewide, but looks different depending on location.
▪ In large urban areas, 79 percent of residents are white non-Hispanic; in most small towns and rural areas,
more than 90 percent are.
▪ About three-fourths of all residents in rural, small town, or large town areas were born in Minnesota,
compared to two-thirds of urban residents.
▪ Most Minnesotan immigrants (89 percent) live in urban communities.18
ixix
Data categorization varies throughout this assessment because different data sources use different terminology. One report
might use African-American, another black, and another African-American/African Born. The Minnesota Student Survey asked
ninth-graders about their identification as lesbian, gay, or bisexual (LGB), but not transgender or questioning, while 11th-graders
were asked about all those categories (LGBTQ). Some data sources refer to “white, non-Hispanic” and others only to white. Some
data is only available for the five major census racial groups (American Indian, Asian, black, Hispanic, and white). Other data
sources include data by birthplace and ethnicity (e.g., Hmong, Somali, black/foreign-born, black/U.S.-born, Southeast Asian, etc.).
While this can be confusing, this assessment does not make any assumptions about what was intended and uses the original
source terminology.
11P E O P L E
Race and ethnicity are powerful indicators of the opportunity people have
to be healthy. Data shows that Minnesotans of American Indian, African-
American, Hispanic, Asian, and African descent experience poorer
outcomes in education and economic status, and consequently health,
relative to Minnesotans who are white. Understanding racism and inequity
are key to understanding how different factors create or limit health. This
is an urgent issue, because of our rapidly changing population. If we do
not improve opportunities for our fastest growing population groups,
Minnesota’s overall population health and economic well-being will
decline.19
AMERICAN INDIANSx
Anishinaabe (Chippewa, Ojibwe) and Dakota tribes in Minnesota have a
unique relationship with local, state, and federal entities, because by
treaty with the U.S. government they are sovereign nations. Seven
Anishinaabe tribes, four Dakota (Sioux) communities, and their ancestors
have called this area home for thousands of years: long before European
settlements and the establishment of the State of Minnesota. The lands
set apart for the Anishinaabe and Dakota reservations were established by
treaties in the late 19th century.20
American Indians comprise almost 2 percent of the total population in
Minnesota, including approximately 65,000 who identify as American
Indian only, and about 36,000 who are American Indian and one other
race. Most American Indians in Minnesota live on the federal-designated
reservation lands, in the areas surrounding the reservations, and in
counties in greater Minnesota. About 12,000 live in Hennepin County, and
about 9,000 live in Ramsey County.21
Historical trauma and threats to health
Historical trauma refers to the collective emotional and psychological
injury from this cataclysmic history over the life span, across generations,
and continuing today. Encounters between the original inhabitants of
Minnesota and European settlers were often violent and cruel, and
included military action, displacement, forcibly separating children and
parents, even genocide. This history still affects and seriously threatens
the health of American Indians in Minnesota today, including:
xThe term “Indian” was given to the indigenous people of North America by the European explorers when they first encountered
the New World, mistakenly thinking they had reached the Indies. Individuals have different preferences for the term used to
describe indigenous people in the United States, including American Indian, Native American, or by the names they call
themselves in their own languages. This publication follows the convention of using “American Indian” as that is the term used in
some state laws and in the U.S. Census for indigenous people to identify themselves.
12P E O P L E
▪ American Indian people in Minnesota are more likely to live in poverty22
▪ American Indian youth are less likely to graduate from high school in four years23
▪ American Indians are four times as likely to die of diabetes than white Minnesotans, and twice as likely to
die of unintentional injury24
▪ Young American Indians are more likely to attempt suicide25
▪ American Indian people in Minnesota have lung cancer at a rate twice as high as the rate for black
Minnesotans and three times the rate for Asian and white people in Minnesota.26
It is important to recognize that the trauma of various historical events also affects other race/ethnic minority
groups and other populations. In the midst of these challenges, American Indian culture and values are sources
of strength and resilience for families and tribes as they work to change the systems and structures that
continue to oppress their communities.
IMMIGRATION
Over 80 percent of people in Minnesota have roots in northern Europe. French fur traders arrived in Minnesota
in the 17th century and were among the first Europeans to call Minnesota “home”; other settlers followed.
Today, Minnesota’s immigrant population includes people from all over the globe, including Africa, Asia, and
Central and South America. The largest populations of immigrants to Minnesota today come from Mexico,
China, Korea, and India.27
Refugees are people who have been forced to leave their home countries, often because of war, disaster, or
oppression. Refugee challenges are unique, including the trauma and upheaval of the refugee experience and
challenging conditions in refugee camps. Today, the largest populations of refugees to Minnesota come from
Somalia, Liberia, Laos, Thailand, Vietnam, and Ethiopia. Minnesota is home to the second-largest population of
Hmongxi in the U.S. (more than 66,000, including first, second, and third generations).28
▪ After English, the most common languages spoken in Minnesota homes are Spanish (194,121 speakers) and
Hmong (58,833 speakers).29,30
AFRICAN-AMERICAN MIGRATION
From 1916 to the 1980s, millions of African-Americans migrated from southern states in the U.S. to northern
cities, dramatically transforming the demographics and social structures of major U.S. cities, including Detroit,
Chicago, Cleveland, and New York. During this period, the population of African-Americans in Minnesota also
grew by nearly 100,000 people.
xi Hmong people are an ethnic group originally from the mountainous regions of China, Vietnam, Laos, and Thailand.
13P E O P L E
▪ About 4 percent of people in Minnesota (197,552) are U.S.-born African-Americans.31
African-Americans moved from the south to the north to escape state and local laws enforcing racial segregation
(known as Jim Crow laws), but migrants nonetheless encountered racism and policies of exclusion in the north,
including in Minnesota.32
For example, lending institutions practiced “redlining,” which limited or denied financial services to specific
neighborhoods, usually because residents were poor or people of color.xii, 33 This practice was legal, and
practiced in major cities—including Minneapolis—during the 1930s to 1970s. While the Fair Housing Act of 1968
outlawed redlining, it continues to affect rates of homeownership for African-Americans in Minnesota today.34 35
Nevertheless, mortgage lending discrimination continues in different forms. Financial institutions continue to be
subject to lawsuits for discriminatory practices.36
The LGBTQ population in Minnesota
Population-based data on persons who identify as lesbian, gay, bisexual, transgender, and questioning (LGBTQ)
is becoming more available. While the U.S. Census and American Community Survey do not ask sexual
orientation or gender identity, the national Behavioral Risk Factor Surveillance System (BRFSS) and the National
Health Interview Survey now include questions about both. The Minnesota Student Survey added questions of
sexual orientation, gender identity, and gender expression to surveys for high school students in 2016.
▪ A 2012 Gallup poll found that 2.9 percent of Minnesota’s population overall identify as LGBT.37 Tracking
during 2012-2014 by Gallup found that 3.6 percent of adults in the Minneapolis-St. Paul metropolitan area
identify as LGBT, lower than many other major metropolitan areas.38
▪ In the Minnesota Student Survey, 1 percent of ninth and 11th grade students identify as gay or lesbian.
However, 2 to 8 percent identify as bisexual, and another 3 to 6 percent identify as not sure (questioning).
In each grade, a range of 2 to 4 percent of students identify as transgender, genderqueer, gender fluid, or
unsure of their gender identity.39
Data from the Minnesota Student Survey, the Behavioral Risk Factor Surveillance System, and surveys conducted
by the Rainbow Health Initiative shows significant concerns for LGBTQ youth and adults in Minnesota. The
LGBTQ community disproportionately experiences exclusion, poverty, homelessness, and barriers to health care.
These experiences can be compounded by race/ethnicity, advancing age, and language barriers.40,41
Persons in Minnesota with disabilities
The definition of “disability” varies between researchers, policymakers, and the public.xiii Some favor a more
narrow definition, which includes only disabilities we can see: for example, bodily impairments, activity
limitations, or restrictions on participation that relate to a health condition.42 Others prefer to expand the
xii
Redlining was so named, because banks and others used color-coded maps to indicate neighborhoods considered of greater
(red) or lesser (green) financial risk. People who lived in “red” areas could not get mortgages, and could not buy homes.
xiii
For example, U.S. Census Bureau defines disability narrowly: a serious difficulty in several different areas, including hearing,
vision, remembering/concentrating/making decisions, walking or climbing stairs, bathing or dressing, and difficulty doing errands
alone. BRFSS uses seven questions to define disability, and estimates 25 percent of the population has some form of physical or
mental difficulty. The Minnesota State Council on Disability indicates that nearly one in five people in Minnesota has a disability.
14P E O P L E
definition to encompass disabilities that may be invisible, such as chronic pain or some types of mental illness.
Because there is not a consensus on the definition of disability, the reported rates of people with disabilities in
Minnesota vary widely.
▪ 11 percent to 25 percent of the state’s population are living with one or more disabilities. Among those
with any disability, 44 percent report two or more disabilities.43
Issues of race/ethnicity, age, language, gender, poverty, and low social status compound the impact of having a
disability. For example, different racial and ethnic groups experience significant disparities in their rate of
disability.
▪ Approximately 9 percent of Minnesotans age 18 to 64 have a disability. Within this group, the highest rates
of disability are found among American Indians and African-Americans.44
The likelihood of developing a disability increases with age, and as the state’s population ages the number and
percentage of people living with a disability is expected to rise.xiv
Mental illness (depending on diagnosis and severity) can also be considered a disability, especially if a person’s
environment is not set up to support successful management of their illness or if it limits their opportunities to
participate in the community.
Some of the greatest challenges for people with disabilities arise because physical environments and social
settings are not structured to support full participation.45 People with disabilities live daily with challenges that
include a lack of adequate accessible transportation, limited housing, unequal access to programs and facilities,
barriers to education and employment, and reduced income. In fact, people with disabilities are nearly three
times more likely to live in poverty than those without a disability.46 These inequities affect health outcomes, as
with other populations that experience inequities in opportunity, belonging, and interactions with nature.
xivThe Minnesota and North Dakota chapter of the Alzheimer’s Association estimates there are currently 92,000 people in
Minnesota with Alzheimer’s Dementia. They anticipate this number to grow to 120,000: a 30 percent change. For more
information, see: Alzheimer’s Association: 2017 Alzheimer’s Disease Facts and Figures (PDF)
http://www.alz.org/documents_custom/2017-facts-and-figures.pdf.
15O P P O R T U N I T Y
Opportunity
The American dream, as it is traditionally understood, describes a place where all of us have the opportunity to
make a life for ourselves, and to improve our lives and our children’s lives.xv Opportunity means having the
chance to experience success at every stage of life, from early childhood through old age. The conditions that
constrain or expand our available choices shape our opportunities. These conditions include what schools we
can go to, what jobs are open to us, and even what kind of food is available to us.
Our opportunities are interconnected. For example, employment drives income. Housing depends on income
and employment. Employment depends on our opportunities for training and education and our social
connections. Our ability to manage demands of family and care for our health is influenced by whether our jobs
offer benefits like health insurance and paid leave.
Opportunity and our health
The opportunities envisioned in the American dream — to earn a living, to own property, to determine the
course of one’s own life — are also important for health. Research is very clear that whether we get a good
education, have a permanent home, find work with good pay and health insurance, or have safe places to play
improves or reduces our chances to be healthy. Research is also clear, as this assessment shows, that whole
populations in Minnesota do not have these key opportunities to shape a healthy life.
The conditions that shape opportunity — income, in particular — have important and lasting impacts on our
children’s health. Children need good nutrition, stable housing, and positive life experiences to grow healthy and
strong. Living in families and communities that face constant economic stress can cause changes to young brains
and bodies that show up as health problems later in life.
Education
Education is one of the clearest and strongest predictors of lifelong health. When we have more education we
are more likely to live longer, healthier lives. Success in school leads to higher earnings, and this improves our
living conditions. Education allows us to find better-paying jobs, with healthier working conditions and benefits
including health insurance and paid leave. Our children are more likely to be healthy, too.47
White and Asian students in Minnesota graduate high school on time at a rate one-third higher than American
Indian, black, and Hispanic students.48 The high rate for Asians, however, masks major disparities within that
group. For adults 25 and older, Southeast Asians, including Hmong, Cambodian, Laotian, and Vietnamese, are
less likely than American Indian, African-American or Latino adults to have a high school degree.49
xvThe American Dream originated in 1931, in James Truslow Adams’ The Epic of America. He states it is “that dream of a land in
which life should be better and richer and fuller for everyone, with opportunity for each according to ability or achievement.” For
more information, see: Library of Congress: The American Dream
http://www.loc.gov/teachers/classroommaterials/lessons/american-dream/students/thedream.html.
16O P P O R T U N I T Y
People with disabilities also face educational barriers and have lower levels of education than the rest of the
population.
▪ People with a disability are less likely to have graduated high school or to have attended or graduated
college or tech school.50
Education is a source of personal and community power. When we succeed in school, we are better able to
shape circumstances to benefit our lives and the lives of those around us.
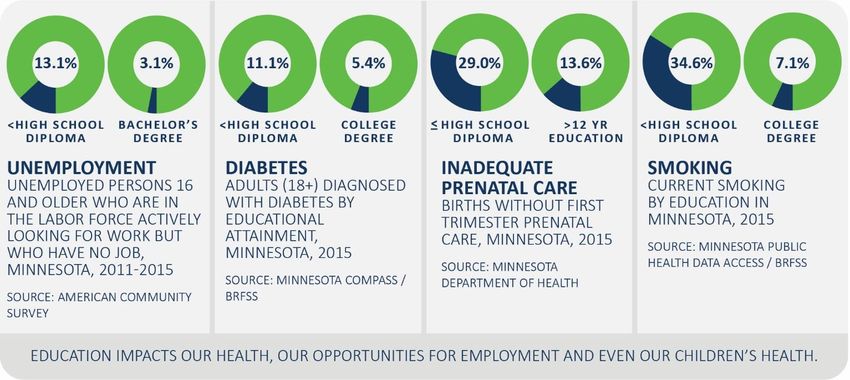
▪ Minnesotans with more education are much more likely to be employed,51 are less likely to be diagnosed
with diabetes,52 are more likely to receive prenatal care,53 and are less likely to smoke.54
A person’s education and whether they smoke reflect their parent’s education and income, and their own
experiences in early childhood.xvi Communities with high levels of education are better able to create the kinds
of social and physical environments that support physical, mental, and social well-being.
xvi
According to Yale University, “Educational disparities in adult smoking are anchored to experiences from early in life. School
policies, peers, and expectations about the future measured at ages 13 to 15 predict smoking at ages 26 to 29. The families in
which children grow up and children’s non-cognitive skills may matter far more than realized in explaining the robust association
between education and smoking in adulthood. Marlani writes, ‘Overall, educational inequalities in adult smoking are better
understood as a bundling of advantageous statuses that develops in childhood, rather than the effect of education producing
better health.’” For more information, see: Dodson, H. (2014, May 13). Yale study shows links between education and smoking
[blog post] https://scitechdaily.com/yale-study-shows-links-smoking-education/. For the study abstract, see: Maralani, V. (2014).
Understanding the links between education and smoking. Social Science Research, 48, 20-34
https://doi.org/10.1016/j.ssresearch.2014.05.007.
17You can also read