2017 RESULTS APRIL 2018 - Central Asia Metals
←
→
Page content transcription
If your browser does not render page correctly, please read the page content below
2 0 1 7 R E S U LT S
P R E S E NTAT I O N

  APRIL 2018
1
                                                                                             CENTRA L A SIA META LS PLC
                                                                                            BUILDING A BIGGER BUSINESS

                                                                                            DISCLAIMER
The information contained in this confidential document (“Presentation”) has been prepared by Central Asia Metals plc (the “Company”). It has not been fully verified and is subject to material updating, revision and further
amendment. This Presentation has not been approved by an authorised person in accordance with Section 21 of the Financial Services and Markets Act 2000 and therefore it is being delivered for information purposes only. Any
person who receives this Presentation should not rely or act upon it. This Presentation is not to be disclosed to any other person or used for any purpose.

While the information contained herein has been prepared in good faith, neither the Company nor any of its shareholders, directors, officers, agents, employees or advisers give, have given or have authority to give, any
representations or warranties (express or implied) as to, or in relation to, the accuracy, reliability or completeness of the information in this Presentation, or any revision thereof, or of any other written or oral information
made or to be made available to any interested party or its advisers (all such information being referred to as “Information”) and liability therefore is expressly disclaimed. Accordingly, neither the Company nor any of its
shareholders, directors, officers, agents, employees or advisers take any responsibility for, or will accept any liability whether direct or indirect, express or implied, contractual, tortious, statutory or otherwise, in respect of,
the accuracy or completeness of the Information or for any of the opinions contained herein or for any errors, omissions or misstatements or for any loss, howsoever arising, from the use of this Presentation.

This Presentation may contain forward-looking statements that involve substantial risks and uncertainties, and actual results and developments may differ materially from those expressed or implied by these statements. These
forward-looking statements are statements regarding the Company's intentions, beliefs or current expectations concerning, among other things, the Company's results of operations, financial condition, prospects, growth,
strategies and the industry in which the Company operates. By their nature, forward-looking statements involve risks and uncertainties because they relate to events and depend on circumstances that may or may not occur in
the future. These forward-looking statements speak only as of the date of this Presentation and the Company does not undertake any obligation to publicly release any revisions to these forward-looking statements to reflect
events or circumstances after the date of this Presentation.

Neither the issue of this Presentation nor any part of its contents is to be taken as any form of commitment on the part of the Company to proceed with any transaction and the right is reserved to terminate any discussions or
negotiations with any prospective investors. In no circumstances will the Company be responsible for any costs, losses or expenses incurred in connection with any appraisal or investigation of the Company. In furnishing this
Presentation, the Company does not undertake or agree to any obligation to provide the recipient with access to any additional information or to update this Presentation or to correct any inaccuracies in, or omissions from, this
Presentation which may become apparent.

This Presentation should not be considered as the giving of investment advice by the Company or any of its shareholders, directors, officers, agents, employees or advisers. In particular, this Presentation does not constitute an
offer or invitation to subscribe for or purchase any securities and neither this Presentation nor anything contained herein shall form the basis of any contract or commitment whatsoever. Each party to whom this Presentation is
made available must make its own independent assessment of the Company after making such investigations and taking such advice as may be deemed necessary. In particular, any estimates or projections or opinions contained
herein necessarily involve significant elements of subjective judgment, analysis and assumptions and each recipient should satisfy itself in relation to such matters.

The Company's principal activity is the exploration and mining of precious and base metals in Kazakhstan and Macedonia. You should be aware of the risks associated with this type of investment and that in emerging markets
such as Kazakhstan and Macedonia, the risks are far greater than in more developed markets (including significant legal, economic and political risks) and that the Company could potentially lose the benefit of its assets in
Kazakhstan and Macedonia. You acknowledge the high number of expenses and difficulties frequently encountered by companies in the early stages of development, particularly companies operating in emerging markets and you
should be aware that this may lead to the loss of your entire investment.

Neither this Presentation nor any copy of it may be (a) taken or transmitted into Australia, Canada, Japan, the Republic of Ireland, the Republic of South Africa or the United States of America (each a “Restricted Territory”),
their territories or possessions; (b) distributed to any U.S. person (as defined in Regulation S under the United States Securities Act of 1933 (as amended)) or (c) distributed to any individual outside a Restricted Territory who is a
resident thereof in any such case for the purpose of offer for sale or solicitation or invitation to buy or subscribe any securities or in the context where its distribution may be construed as such offer, solicitation or invitation, in
any such case except in compliance with any applicable exemption. The distribution of this document in or to persons subject to other jurisdictions may be restricted by law and persons into whose possession this document
comes should inform themselves about, and observe, any such restrictions. Any failure to comply with these restrictions may constitute a violation of the laws of the relevant jurisdiction.

April 2018
2
                                                         CENTRA L A SIA META LS PLC
                                                        BUILDING A BIGGER BUSINESS

                          2017 PERFORMANCE AND UPDATE

▪ Total 2017 dividend 16.5p (2016: 15.5p), includes proposed final
  dividend 10p (2016: 10p)                                                  2017 Cu production         2017 revenue
▪ Lynx Resources acquisition, CAML 100% owner Sasa mine, Macedonia          14,103t                    $106.5m
▪ Record Kounrad copper production 14,103t (2016: 14,020t)
                                                                            2016: 14,020t              2016: $69.3m
▪ CAML attributable Sasa production (2 months)
  ‒ Zinc 3,625t
  ‒ Lead 4,951t                                                             2017 Sasa Zn production    2017 adjusted EBITDA
▪ Group gross revenue $106.5m (2016: $69.3m)                                21,585t                    $66.4m*
  ‒ Kounrad $86.5m                                                                                     *Unadjusted EBITDA $53.8m, adjusted EBITDA excludes
                                                                                                       Lynx Resources acquisition costs of $12.6m
  ‒ Sasa $20.0m                                                             CAML attributable 3,625t   2016: $39.9m
▪ Adjusted EBITDA $66.4m (2016: $39.9m), margin 62% (2016: 58%)
▪ Net debt 31 December 2017 $138.9m (2016: net cash $40.3m)                 2017 Sasa Pb production    2017 dividend
▪ Shuak 2018 exploration programme to commence Q2                           29,881t                    16.5p*
                                                                                                       *includes proposed 10p final dividend
▪ Q1 2018 production
                                                                            CAML attributable 4,951t   2016: 15.5p
  ‒ Copper 3,070t
  ‒ Zinc 5,518t
  ‒ Lead 7,020t
▪ 2018 production guidance
  ‒ Copper 13,000-14,000t
  ‒ Zinc 21,000-23,000t
  ‒ Lead 28,000-30,000t
3
                                                                                                       CENTRA L A SIA META LS PLC
                                                                                                      BUILDING A BIGGER BUSINESS

                                                      SHARE PRICE AND SHAREHOLDERS
             350                                                                                                12,000                                             350

             300                                                                                                                                                   300
                                                                                                                10,000

             250                                                                                                                                                   250
                                                                                                                8,000

                                                                                                                         LME Copper ($/t)

                                                                                                                                                 Share price (p)
                                                                                                                                                                   200
Share price (p)

             200
                                                                                                                6,000
             150                                                                                                                                                   150

                                                                                                                4,000
             100                                                                                                                                                   100

                                                                                                                2,000                                              50
                  50

                                                                                                                                                                    0
                  0                                                                                              0
                                                                                                                                                                    Sep 10   May 11   Jan 12 Sep 12   May 13 Jan 14 Sep 14 May 15 Jan 16 Sep 16             May 17   Jan 18
                  Sep 10Mar 11Sep 11Mar 12Sep 12Mar 13Sep 13Mar 14Sep 14Mar 15Sep 15Mar 16Sep 16Mar 17Sep 17Mar 18
                                                          Copper ($/t)        CAML                                                                                                         CAML            FTSE AIM All Share / Basic Resources (Rebased)

           Share price (CAML:AIM)                                                                        £3.25*                                 Shareholders                                                             No. shares                    % holding
           Total no. voting shares                                                                   175,986,619                                FIL Investment International                                                      16,051,321                              9.1

           Treasury shares                                                                                 511,647                              Orion Co-Investment III                                                           15,278,528                              8.7

                                                                                                                                                Hargreave Hale                                                                    14,501,409                              8.2
           Issued shares                                                                             176,498,266
                                                                                                                                                Blackrock Investment Management                                                   12,781,258                              7.3
           Market capitalisation                                                                             £572m
                                                                                                                                                JO Hambro Capital Management                                                      11,458,374                              6.5
           Free float                                                                                            87%
                                                                                                                                                Majedie Asset Management                                                          10,956,711                              6.2
           Average daily volume                                                                                0.6m                             Commonwealth American Partners                                                      5,351,000                             3.0
           *as closed on 10 April 2018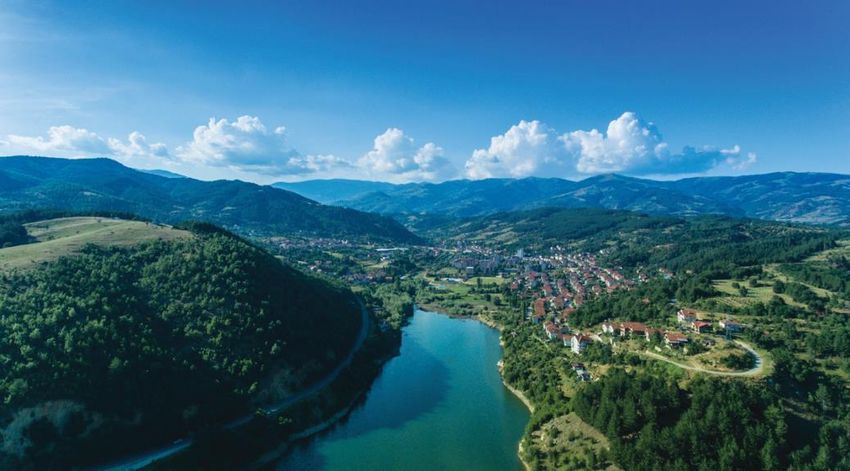
4
   CENTRA L A SIA META LS PLC
   BUILDING A BIGGER BUSINESS

FINANCIAL REVIEW
5
                                                             CENTRA L A SIA META LS PLC
                                                            BUILDING A BIGGER BUSINESS

                                        2017 MARKET CONDITIONS

Copper
                                                                                          8,200
▪ Price increased by 30% YoY to $7,157/t
▪ 2018 copper price to be supported by production disruptions related to
  scheduled labour negotiations on mines in Chile and Peru                                7,200
▪ 2018 broker consensus price $6,767/t

Zinc                                                                                      6,200
▪ Price increased by 29% YoY to $3,309/t
▪ 2018 market deficit expected to be 200,000t - 561,000t
▪ 2018 broker consensus price $3,307/t                                                    5,200

                                                                                  Price
Lead
▪ Price increased by 26% to $2,495/t                                                      4,200
▪ 2018 market deficit expected to be 110,000t
▪ 2018 broker consensus price $2,488/t
                                                                                          3,200
Currencies
▪ Kazakh Tenge (KZT) to US Dollar average 326, strengthened due to stronger oil
  price                                                                                   2,200

▪ Macedonian Denar (MKD) pegged to Euro
▪ US economy strong, US Dollar strong against all major currencies                        1,200

Inflation
▪ Kazakhstan, 7.1% (2018 target 5-7%)
▪ Macedonia, 1.4% (2018 target 2%)                                                                Copper ($/t)   Zinc ($/t)   Lead ($/t)
▪ Potential inflationary pressures on cost base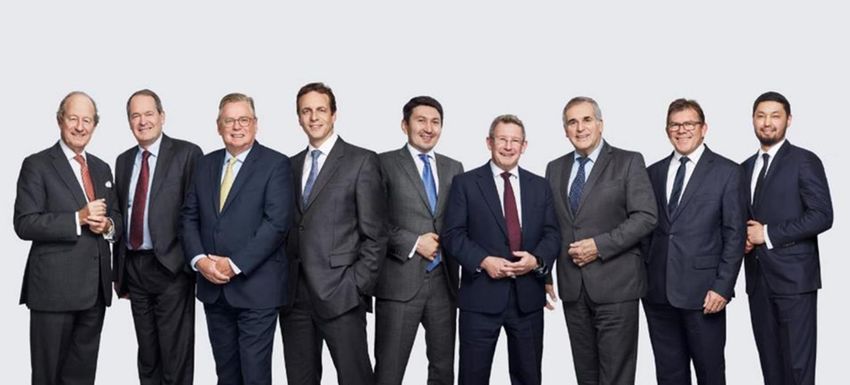
6
                                   CENTRA L A SIA META LS PLC
                                  BUILDING A BIGGER BUSINESS

                      LYNX RESOURCES ACQUISITION

     $402.5m acquisition                                                                        Consideration
                                                                                                          $m

                                                                   Headline consideration                 402.5
             $12.0m
                                  New debt (Traxys), LIBOR
    $50.0m              $120.0m   +4.75%, 5 years                  Adjustments to reflect IFRS purchase
                                                                   consideration:
                                  Sasa debt (SocGen / Investec),
                                  LIBOR +5%, 5+ years              Amount received from
                                                                                                           (3.3)
                                                                   sellers in April 2018
                                  Equity placing at 230p
                                                                   Interest paid                            3.0
                                  Equity consideration shares at   Fair value accounting for
                                  241.5p
                                                                   equity consideration                    (1.1)
                                  Deferred consideration,          shares
$153.5m
                                  monthly repayments for 6
                         $67.0m
                                  months from Q4 2018              Purchase consideration
                                                                                                          401.1
                                                                   fair value (IFRS)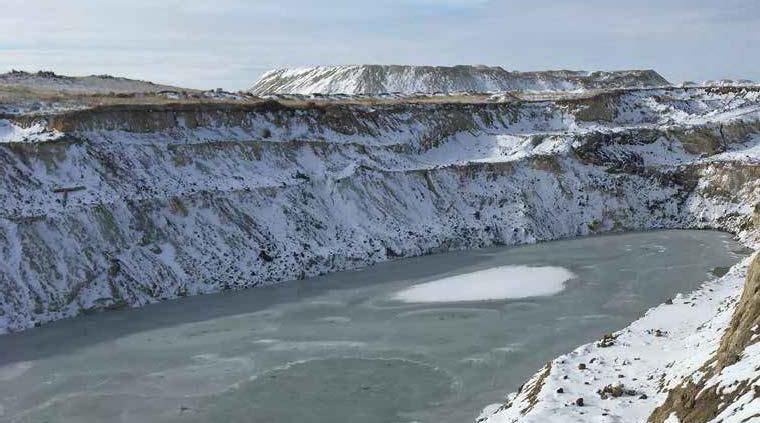
7
                                             CENTRA L A SIA META LS PLC
                                            BUILDING A BIGGER BUSINESS

                             2017 INCOME STATEMENT

Increased revenue and EBITDA reflecting                                               2017    2016    % change
acquisition of Lynx Resources
▪ Results of Lynx Resources consolidated for 2 months        Gross revenue, $m        106.5    69.3      +54%
  from 1 November 2017
                                                             Profit before tax, $m     49.7    33.5      +48%
▪ Kounrad contributed $86.4m gross revenue and $63.6m
  EBITDA
  ‒ Increased Kounrad revenue and EBITDA due to 22%
    increase in copper price and 2% increase in sales        EBITDA, $m                53.8    39.9      +35%
    volumes
                                                             Adjusted EBITDA, $m      66.4    39.9       +66%
▪ Acquired business contributed $20.0m gross revenue
  and $14.5m EBITDA                                          Adjusted EBITDA margin    62%     58%        +4%
▪ CAML adjusted EBITDA excludes acquisition costs of
  $12.6m
▪ Kounrad and Sasa low cost operations                       EPS, cents               29.02   24.26      +20%

▪ Sasa off-take agreement signed with Traxys from 1
  January 2018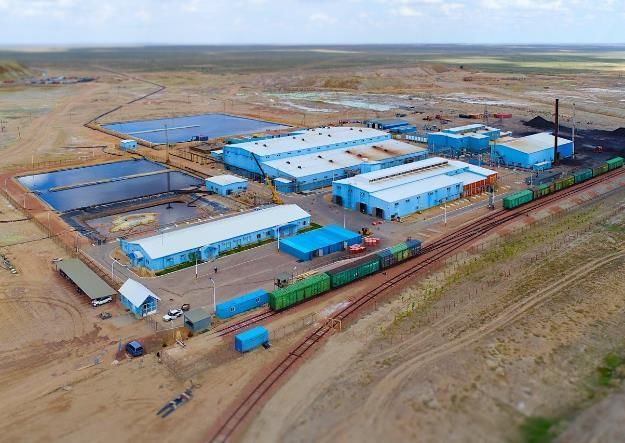
8
                                                                     CENTRA L A SIA META LS PLC
                                                                    BUILDING A BIGGER BUSINESS

                                                 2017 BALANCE SHEET

Net debt $138.9m                                                                                                  2017, $m   2016, $m
▪ Lynx Resources net assets acquired of $312.5m                                      PPE                             461.0       50.3
  including PPE of $402.6m and borrowings of $70.3m
                                                                                     Intangible assets                70.3       40.8
▪ Other liabilities include $12.0m Lynx acquisition
  deferred cash consideration
                                                                                     Cash                             43.0       40.3
▪ New debt facility $120.0m
                                                                                     Restricted cash                   2.8        0.1
▪ $191.8m increase in equity from share issues
                                                                                     Other assets                     27.8        7.0
     70

     60                                                                              Total assets                    604.9      138.5
     50
                                                                                     Borrowings                      181.9          -
     40
$m

     30                                                                              Other liabilities                50.3        6.4
     20
                                                                                     Deferred tax & provisions        35.7       10.6
     10

     0                                                                               Equity & reserves               337.0      121.5
          2018E                2019E             2020E               2021E

             Debt repayments      Accelerated payments   Interest                    Total equity & liabilities      604.9      138.5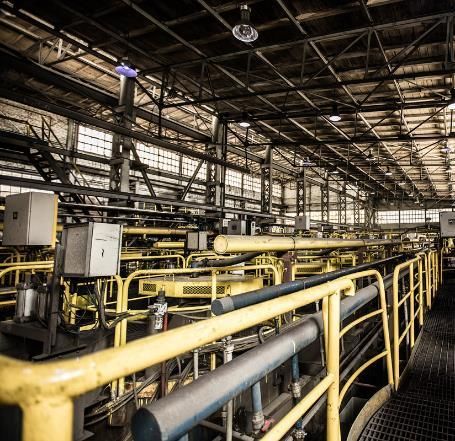
$m

                 -
                     50
                                             100
                                                     150
                                                              200
                                                                    250
                                                                          300
Cash at 1 Jan

                     40.3
     17

    Share
 proceeds &
gain on hedge

                                                           146.0
    (net)

  Borrowings
     less
                                                                           109.5

repayments &
   interest

Acquisition of
 Lynx (net of
    cash
                                                                            (268.0)

  acquired)

     Cash
   generated
                                            60.4
     from
                                                                                                                                     9

   operations

  Income tax
     paid
                                            (12.3)
                                                                                                        CENTRA L A SIA META LS PLC
                                                                                                       BUILDING A BIGGER BUSINESS

       Capex
                                                                                      2017 CASH FLOW

                                    (6.1)

    Dividends
                                (23.1)

        Other
                        (1.0)

   Cash at 31
                       45.8

    Dec 17
10
CENTRA L A SIA META LS PLC
BUILDING A BIGGER BUSINESS
GROUP CAPEX CASH FLOW IPO -2017
16 270
220
14
170
12
120
10 70
20
$m
$m
8
-30
6 -80
-130
4
-180
2 -230
-280
0 2010 2011 2012 2013 2014 2015 2016 2017
2017 2018E 2019E 2020E
Cash flow from operating activities Cash flow from investing activities
Kounrad Sasa Sasa Tailings Cash flow from financing activities Net cash at end of year11
CENTRA L A SIA META LS PLC
BUILDING A BIGGER BUSINESS
CAML SUMMARY FINANCIAL PERFORMANCE
Total 2017 2016 2015 2014 2013 2012
(68 months) (Sasa 2 months) (8 months)
Kounrad production, Cu tonnes 68,425 14,103 14,020 12,071 11,136 10,509 6,586
Sasa payable production, Cu eq. tonnes 3,333 3,333 - - - - -
Group total, Cu eq. payable tonnes 71,758 17,436 14,020 12,071 11,136 10,509 6,586
Average Cu sale price, $/t 6,390 6,107 4,994 5,336 6,794 7,114 7,935
C1 cash cost, Cu eq. $/lb 0.62 0.76* 0.43 0.60 0.62 0.66 0.63
Group revenue, $m 446.8 106.5 69.3 67.3 76.6 76.0 51.1
Group adjusted EBITDA, $m 268.4 66.4 39.9 34.9 47.3 48.1 31.8
Group adjusted EBITDA margin 60% 62% 58% 52% 62% 63% 62%
Dividend/share buy-back, $m 129.1 33.6 21.6 20.3 21.8 15.6 16.2
*calculated on a 12 month 2017 basis for Sasa12
CENTRA L A SIA META LS PLC
BUILDING A BIGGER BUSINESS
2017 CAML C1 CASH COST
CAML copper equivalent C1 cash cost $0.76/lb 2017 2016 %
$/lb $/lb change
▪ Following acquisition of Sasa mine, CAML reports C1 cash
Kounrad copper C1
cost on a copper equivalent basis 0.52 0.45 +16%
cash cost
▪ Sasa and Kounrad copper eq. fully inclusive cash cost
Sasa zinc equiv. C1
0.44 0.45 -2%
$1.43/lb* cash cost
Kounrad copper C1 cash cost $0.52/lb Sasa & Kounrad
copper eq. C1 cash 0.76 - -
▪ Remains firmly in lowest quartile of industry cash cost curve cost*
*calculated based on 12 month Sasa 2017 zinc and lead paid production of 21,161 copper
equivalent tonnes (based upon 2017 average commodity price achieved) added to 2017
▪ Increase due to production from Western Dumps Kounrad copper production of 14,103 tonnes
▪ Average C1 cash cost over life of project $0.58/lb
Sasa zinc equivalent C1 cash cost $0.44/lb
▪ Lower end of the second quartile of the zinc industry cost
curve13
CENTRA L A SIA META LS PLC
BUILDING A BIGGER BUSINESS
2017 KOUNRAD COPPER C1 CASH COST $0.52/LB
Processing 2017 $/lb 2016 $/lb
Reagents 0.07 0.05
Power 0.06 0.05
Payroll 0.11 0.09
Local G&A, $ 0.06
Materials 0.05 0.05
Consulting & other 0.08 0.04
Processing total 0.37 0.28
Realisation, $ 0.09 400
350
Kounrad and Sasa Cu Eq $0.76/lb
300
Processing, $ 0.37 Kounrad $0.52/lb
copper C1 cash cost c/lb
250
200
150
100
50
0
-50 25% 50% 75% 100%
-100
Source: Wood Mackenzie14
CENTRA L A SIA META LS PLC
BUILDING A BIGGER BUSINESS
2017 SASA ZINC EQ. C1 CASH COST $0.44/LB
Unit costs, Run of Mine (RoM) 2017 2016
Mining, $000 14,413 13,331
Processing, $000 7,499 8,201
Local G&A, $000 5,019 4,822
Total operating costs, $000 26,931 26,354
Processing, $0.08 RoM, t 792,068 782,823
Unit cost, $/t 34.0 33.7
Mining, $0.15
140
120
Sasa $0.44/lb
100
Realisation, $0.16
zinc C1 cash cost c/lb
80
Local G&A, $0.05
60
40
20
0
25% 50% 75% 100%
-20
Source: Wood Mackenzie15
CENTRA L A SIA META LS PLC
BUILDING A BIGGER BUSINESS
DELIVERING SHAREHOLDER VALUE
140
2017 dividend 16.5p 2018 dividend policy
$129m
“CAML will return to shareholders a target
120
100
80 range of between 30% and 50% of free
cash flow, defined as net cash generated
$m
60
40
from operating activities less capital
expenditure”
20
0
2012 2013 2014 2015 2016 2017
Cumulative shareholder returns
TSR CAGR since IPO
320
$153.5m equity placing Central Asia Metals 24.9%
Share price (p/share)
300 for Sasa acquisition Antofagasta (0.9%)
OZ Minerals (1.1%)
280 FTSE 350 Mining (1.4%)
Trevali (2.4%)
260
Atalaya (4.6%)
240 Hudbay Minerals (6.6%)
KAZ Minerals (7.0%)
220 Capstone Mining (13.7%)
Rambler M&M (18.6%)
200
Weatherly (21.0%)
01/2017 04/2017 07/2017 10/2017
Source: Peel Hunt16
CENTRA L A SIA META LS PLC
BUILDING A BIGGER BUSINESS
OPERATIONAL OVERVIEW, KOUNRAD17
CENTRA L A SIA META LS PLC
BUILDING A BIGGER BUSINESS
KOUNRAD, OVERVIEW
Eastern Dumps
▪ Commenced leaching Q2 2012
▪ Average dump height 20m, average leach time 8 months
▪ Average copper recovery 45-50%
▪ 2017 production from Eastern Dumps c.60%
▪ Leached 62,860t from Eastern Dumps
‒ 16,366t recoverable remaining
Western Dumps
▪ Commenced leaching of ILA (part of dumps 16 and 22), Q2 2017
▪ Average dump height 40m, average leach time 20 months
▪ Average copper recovery 35-42%
▪ Leaching in line with expectations
▪ Leached 5,566t from Western Dumps
‒ 31,306t recoverable remaining in ILA,
‒ 169,000t recoverable remaining in total Western Dumps18
CENTRA L A SIA META LS PLC
BUILDING A BIGGER BUSINESS
KOUNRAD, PRODUCTION UPDATE AND OUTLOOK
2017 copper production and sales 4.5 80
Cumulative copper production (kt)
4.0 70
Quarterly copper production (kt)
▪ 2017 copper production 14,103t 3.5
60
3.0
▪ Total copper production to end 2017, 68,426t 2.5
50
40
2.0
▪ Western Dumps leaching commenced Q2 2017, 1.5
30
5,566t copper recovered in 2017 1.0
20
▪ 2017 copper cathode sales 14,181t 0.5 10
0.0 -
2012 2013 2014 2015 2016 2017 2018
Outlook
▪ Q1 2018 copper production 3,070t
▪ FY 2018 production guidance 13,000t to 14,000t
▪ 65% 2018 copper production to come from Western
Dumps
▪ Increasing percentage of Western Dumps copper
production from 2019 onwards19
CENTRA L A SIA META LS PLC
BUILDING A BIGGER BUSINESS
KOUNRAD, 2017 OPERATIONAL OVERVIEW
Stable operations 2012 2013 2014 2015 2016 2017
▪ LTI free hours exceed 2m as of Q4 2017
LTI 0 0 1 2 0 0
▪ Production in line with guidance
Cu production, t 6,586 10,510 11,136 12,071 14,020 14,103
▪ $77m capital invested, Kounrad now fully developed
Ave. PLS, m3/hr 383 532 771 784 888 921
▪ Successful commissioning of
PLS grade, gpl 3.9 3.0 2.2 2.3 2.4 2.5
‒ Lake Balkhash water pipeline
‒ Western Dumps leaching infrastructure Plant availability, % 96.9 99.3 98.7 99.1 98.6 99.5
▪ 8 months of Western Dumps leaching, copper Irrigation area, ha 15.29 17.19 28.06 33.05 35.90 39.20
recovery in line with forecast leach curve
Employees 211 224 254 276 300 343
▪ Western Dumps contributed c.40% of annual 2017
production Cathode purity, % 99.997 99.998 99.998 99.998 99.998 99.998
‒ 2018 increase to c.65%
▪ 99.5% record plant availability, reflects positively
on site management20
CENTRA L A SIA META LS PLC
BUILDING A BIGGER BUSINESS
KOUNRAD, SCALE OF LEACHING OPERATIONS
120.0
0.167% Cu
15,000
▪ Average copper grade under leach declining, copper
100.0
13,500
recovered increased YoY
12,000
Total material under leach, Mt
80.0
10,500
▪ Lower grades under leach compensated by increase
Leached copper, t
9,000
in material under leach of c.60%
60.0 0.078% Cu 7,500
40.0
6,000
▪ Western Dump leach blocks constitute 25% of the
4,500
overall material under leach
3,000
20.0
1,500
▪ Leach application rate of 2.5-3 l/hr/m2 is optimal
0.0 0
2012 2013 2014 2015 2016 2017
Total material under leach - east Total material under leach - west
Leached copper Average Cu grade under leach
Year Ave area under Total installed Total material Average grade Annual Cu, t
leach, ha drippers, km under leach, Mt under leach, %
2012 15.29 685 9.64 0.167 6,586
2013 17.19 1,300 24.98 0.123 10,510
2014 28.06 1,891 37.94 0.113 11,136
2015 33.05 2,865 58.95 0.094 12,071
2016 35.90 3,900 69.25 0.082 14,020
2017 39.20 4,676 110.99 0.078 14,10321
CENTRA L A SIA META LS PLC
BUILDING A BIGGER BUSINESS
KOUNRAD, EASTERN DUMPS
Leached Cu, Recoverable Cu,
Dump In-situ Cu, tonnes
tonnes tonnes
9-10 23,450 11,840 119
7
6 14,610 7,357 120
6 7 43,060 21,158 805
5
5 60,774 23,122 4,832
2 25,210 0 10,490
2
Total 167,104 63,477 16,366
9-10 ▪ Dumps 9-10, 6 and 7 will continue to be leached to
depletion
‒ Possible ILS circuit from 2019
▪ Focus for 2018
‒ Continuation of Dump 5 leaching
2018 fresh leach pads 2018 ILS pads
Winter leaching pads Future fresh pads ‒ Side slope and roadway irrigation22
CENTRA L A SIA META LS PLC
BUILDING A BIGGER BUSINESS
KOUNRAD, WESTERN DUMPS ILA
▪ Successful commencement of In-situ Leached
Recoverable
Dump Cu, Cu,
Cu, tonnes
leaching operation, including first tonnes tonnes
winter 16 54,418 2,311 20,545
▪ Continue leaching ILA and gradual 16 22 33,372 3,255 10,762
transition from East to West during
2018 Total 87,790 5,566 31,306
▪ 8 months of operation, balance of
Forecast / actual copper recovery
PLS-raffinate volumes indicate 45
consistent solution return 40
22 35
▪ Recovery is in line with the 30
Cu recovery %
projected leaching curve as of the 25
end of 2017 20
15 Actual recovery ( Irrigated 7 blocks )
▪ Designs prepared for an intermediate 10 Forecast leach curve
5
leach solution (ILS) system, likely
0
from 2019 2018 fresh leach pads 2018 ILS pads 0 100 200 300 400 500 600 700
Winter leaching pads Future fresh pads Leach days
▪ No extra acid consumption observed23
CENTRA L A SIA META LS PLC
BUILDING A BIGGER BUSINESS
OPERATIONAL OVERVIEW, SASA24
CENTRA L A SIA META LS PLC
BUILDING A BIGGER BUSINESS
SASA, PRODUCTION UPDATE AND OUTLOOK
2017 production update and sales 2017 CAML
Units 2017 2016
attributable
▪ Underground ore production 792,068t
Ore mined t 134,063 792,068 782,823
▪ Zinc production 21,585t
Plant feed t 132,012 793,332 779,231
▪ Lead production 29,881t Lead grade % 3.98 3.98 3.95
▪ CAML attributable 2017 payable sales Zinc grade % 3.21 3.18 3.41
‒ Zinc 2,906t Lead concentrate t (dry) 6,784 40,757 39,507
‒ Lead 4,559t - Recovery % 94.2 94.6 94.1
- Grade % 73.0 73.3 73.3
2018 outlook
- Contained lead t 4,951 29,881 28,955
▪ Q1 2018 zinc production 5,518t
Zinc concentrate t (dry) 7,394 43,676 45,548
▪ Q1 2018 lead production 7,020t - Recovery % 85.7 85.5 84.6
▪ 2018 zinc production guidance 21,000t to 23,000t - Grade % 49.0 49.4 49.4
▪ 2018 lead production guidance 28,000t to 30,000t - Contained zinc t 3,625 21,585 22,51525
CENTRA L A SIA META LS PLC
BUILDING A BIGGER BUSINESS
SASA PRODUCTION STATISTICS
2017 ore mined 2017 plant availability
80,000 100
80
Plant availability (%)
60,000
Ore mined (t)
60
40,000
40
20,000
20
0 0
2017 combined grade Production, 2010-2017
8.00 70 900
800
60
zinc plus lead grade (%)
6.00 700
Metal production (kt)
Plant throughput (kt)
50
600
31
40 31 500
4.00 28 30 30 29 30
28
30 400
300
2.00 20
200
27 24
10 23 22 23 23 23 22
100
0.00
- -
2010 2011 2012 2013 2014 2015 2016 2017
Zn production Pb production Throughput26
CENTRA L A SIA META LS PLC
BUILDING A BIGGER BUSINESS
SASA FOR THE FUTURE
Mine and processing plant activities
▪ Infrastructure to access stoping block between 910 and 830
levels completed
‒ Extraction of ore from this area, 2018-2023
▪ Decline access to 750 level commenced in 2017
▪ Infrastructure to access stoping block between 830 and 750
levels will continue in 2018
▪ Mining fleet upgraded in 2017, new Atlas Copco and Sandvik
equipment
▪ Current exploration objective is to replace resources and
maintain approximately 20 year life of mine
Tailings
▪ Construction of TSF4 commenced in Q2 2017
‒ Completion H2 2018
‒ Designed to contain 6.5+Mt tailings
‒ Sufficient for operations 2018-2026+
‒ Cost estimate $10.9m27
CENTRA L A SIA META LS PLC
BUILDING A BIGGER BUSINESS
CORPORATE SOCIAL RESPONSIBILITY28
CENTRA L A SIA META LS PLC
BUILDING A BIGGER BUSINESS
KOUNRAD, OUR CSR APPROACH
Health and safety Environmental Social
▪ No LTI in 2017, total LTI free man ▪ Government environmental checks ▪ Strong focus on training staff
hours now 2 million (last LTI, July successfully undertaken in 2017
▪ c.$1.5m social funding since 2012
2015)
▪ Bedrock drilling programmes
▪ 99% of workforce recruited locally
▪ Government health and safety undertaken
inspections successfully undertaken ▪ CAML community focus on health,
in 2017 ▪ Long term monitoring hole drilling education and charities in Kounrad
programme underway in 2017 and Balkhash29
CENTRA L A SIA META LS PLC
BUILDING A BIGGER BUSINESS
SASA, OUR CSR APPROACH
Health and safety Environmental Social
▪ Total LTI free man hours to end 2017, ▪ Amendment of the IPPC permit ▪ More proactive approach to community
1.8 million relations taken in 2017
▪ Commissioning of biodiversity study for
▪ Continued implementation of the Safety Sasa catchment area ▪ Creation of Community Relations
Department and employment of Community
Improvement Plan
▪ Commencement of water management Relations Liaison Officer
▪ 2,525 Planned Task Observations study for Sasa catchment area
▪ Commissioning of stakeholder engagement
undertaken & 518 High Potential Hazard plan and socio-economic study
Investigations in 2017 ▪ Development and implementation of air
quality management plan ▪ $0.3m in 2017 Sasa social donations30
CENTRA L A SIA META LS PLC
BUILDING A BIGGER BUSINESS
SHUAK31
CENTRA L A SIA META LS PLC
BUILDING A BIGGER BUSINESS
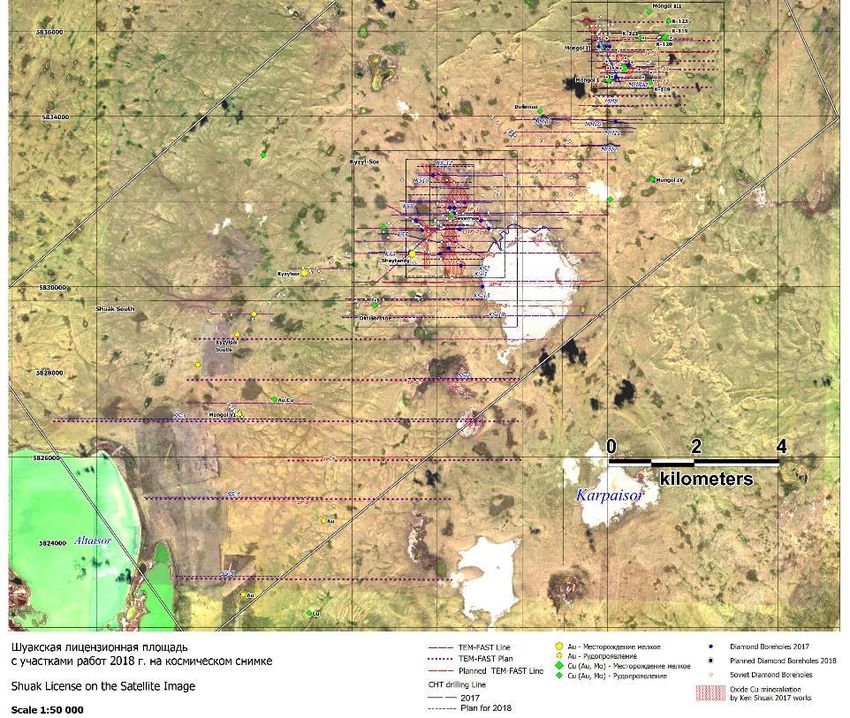
SHUAK, OVERVIEW
$1.5m 2017 exploration
programme complete
▪ CHT drilling programme,
17,530m
▪ Diamond drilling programme,
5,242m
▪ All diamond drilling lab results
and CHT results received
▪ New areas of oxide
mineralisation identified at
Kyzyl-Sor
▪ Encouraging intercepts of
sulphide mineralisation at
Mongol V and Mongol I-II, gold
and molybdenum also identified
▪ 2018 exploration programme to
commence in Q232
CENTRA L A SIA META LS PLC
BUILDING A BIGGER BUSINESS
SHUAK, OXIDE SHUAK, SULPHIDE
Prospect Drill hole From (m) Intercept (m) Cu (%) Prospect Drill hole From (m) Intercept (m) Cu (%)
Mongol V MN1 3.0 47.0 0.29 Mongol V MN2 78.3 27.4 0.58
Mongol V MN2 0.5 49.2 0.24 Mongol V MN3 55.0 23.0 0.94
Mongol V MN5 0.4 18.6 0.24 Mongol V MN4 81.0 32.3 0.72
Mongol V MN14 6.0 24.7 0.28 Mongol V MN5 71.0 30.3 0.31
Mongol V MN15 0.6 20.1 0.23 Mongol V MN6 38.2 22.7 0.98
Mongol North MN9 4.9 13.1 0.15 Mongol V MN14 60.0 35.4 0.59
Mongol North MN13 14.6 33.4 0.26 Mongol V MN15 64.9 24.1 0.57
Mongol I-II MM2 0.2 13.9 0.39 Mongol V MN15 238.0 17.0 0.67
Mongol I-II MM2 25.8 15.9 0.36 Mongol V MN15 328.5 12.7 0.60
Mongol I-II MM4 0.5 58.3 0.44 Mongol North MN9 37.0 18.0 0.59
Mongol I-II MM9 21.3 54.7 0.22 Mongol North MN9 95.4 21.2 0.55
Kyzyl-Sor KS1 2.2 45.1 0.28 Mongol I-II MM1 21.7 97.3 0.20
Kyzyl-Sor KS2 31.1 10.5 0.22 Mongol I-II MM2 44.1 22.5 1.74
Kyzyl-Sor KS4 0.4 37.8 0.28 Mongol I-II MM2 74.5 9.5 1.21
Kyzyl-Sor KS6 5.0 59.0 0.13
Kyzyl-Sor KS12 3.1 41.0 0.51
Kyzyl-Sor KS13 5.5 50.8 0.26
Kyzyl-Sor KS15 9.3 32.7 0.2033
CENTRA L A SIA META LS PLC
BUILDING A BIGGER BUSINESS
OUTLOOK
▪ Two low cost, low capex operations
in prospective jurisdictions, plus
exploration potential in Shuak
▪ Exposure to three base metals with
attractive fundamentals – copper,
zinc and lead
▪ Attractive cash flow based dividend
policy
▪ Sasa integration on track, cautiously
looking for new opportunities
▪ Senior management changes
‒ Nigel Robinson, CEO
‒ Gavin Ferrar, CFO
▪ Q1 2018 production demonstrates
both operations on track to meet
2018 guidance
‒ Copper 13,000-14,000t
‒ Zinc 21,000-23,000t
‒ Lead 28,000-30,000t34
CENTRA L A SIA META LS PLC
BUILDING A BIGGER BUSINESS
INVESTOR RELATIONS CONTACT
Louise Wrathall
11 Albemarle Street
London
W1S 4HH
louise.wrathall@centralasiametals.com
Tel: +44 (0) 20 7898 9001
www.centralasiametals.com35 CENTRA L A SIA META LS PLC BUILDING A BIGGER BUSINESS APPENDIX
36
CENTRA L A SIA META LS PLC
BUILDING A BIGGER BUSINESS
CENTRAL ASIA METALS OPERATIONS
SHUAK (80%)
KAZAKHSTAN
197km2 exploration licence, northern
Population, 18.0 million
Kazakhstan
GDP per capita, $8,585
Potential for copper oxide and
sulphide resources
Extensively explored in Soviet times
22,000m+ drilling undertaken in 2017
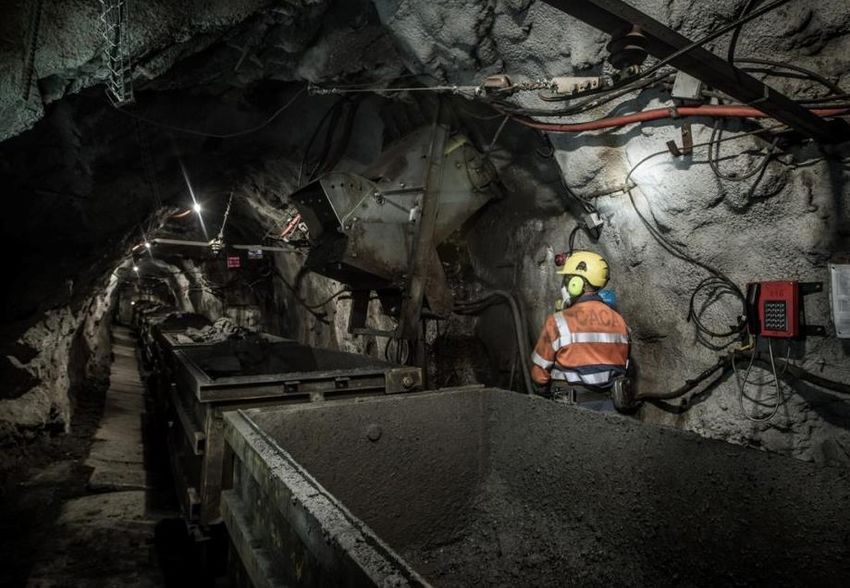
SASA (100%)
Underground zinc and lead mine,
northeast Macedonia
Production commenced in 1960’s
KOUNRAD (100%)
Produces 21,000-23,000t zinc and
28,000-30,000t lead in In-situ dump leach and SX-EW
concentrate annually processing facility, central
Kazakhstan
Life of mine to 2038+
In production for 6 years
2017 production, 21,585t zinc and
29,881t lead Produces 13,000-14,000t copper One
of the lowest cost copper producers
globally
Life of operation to 2030+
2017 production, 14,103t copper
MACEDONIA
Population, 2.1 million
GDP per capita, $5,91637
CENTRA L A SIA META LS PLC
BUILDING A BIGGER BUSINESS
CAML COMPANY TIMELINE
2017, commenced
successful leaching of
Western Dumps
$129m paid to
shareholders in
2015, completed $13m Stage dividends
1 Expansion to increase
annual copper production to
current 13,000-14,000t
6 Nov 2017, $402.5m
April 2012, Kounrad SX-EW plant 2017 acquisition of Lynx
Resources (Sasa)
commissioned, copper production
from Eastern Dumps commenced 2015 2017, completed $13m
Stage 2 Expansion to
extend site infrastructure
to enable leaching of
Western Dumps
2012
2012, instigated
dividend policy
2010
2010, AIM IPO raised
$60m at 96p38
CENTRA L A SIA META LS PLC
BUILDING A BIGGER BUSINESS
BOARD OF DIRECTORS39
CENTRA L A SIA META LS PLC
BUILDING A BIGGER BUSINESS
DIRECTOR BIOGRAPHIES
NICK CLARKE, CHAIRMAN. Nick has over 40 years of mining experience, including 16 DAVID SWAN, NON-EXECUTIVE DIRECTOR. David is a chartered accountant with
years spent within senior management positions in production and technical extensive experience across the natural resources sector. He is also CFO of Scotgold
services in South Africa, Ghana and Saudi Arabia. Nick served as the managing Resources, a non-executive director of Sunrise Resources and Oriel Resources. He
director of Oriel Resources until its acquisition by OAO Mechel for $1.5 billion in joined CAML in June 2014.
2008. In addition, Nick was managing director at Wardell Armstrong International,
where he managed numerous multidisciplinary consulting projects in the resource ROBERT CATHERY, NON-EXECUTIVE DIRECTOR. Robert became a member of the
sector. He is a graduate of Camborne School of Mines and a Chartered Engineer. London Stock Exchange in 1967 and was managing director and Head of Oil and Gas
Nick is also a non-executive director of Wolf Minerals. In 2013, Nick was named CEO at Canaccord Europe. During his career in the City he was a director of Vickers da
of the year at the Mining Journal outstanding achievements awards. He joined the Costa and Schroders Securities and Head of Corporate Sales at SG Securities
Company in 2009 as Chief Executive Officer prior to the Company's initial public (London). He is a co-founder of Salamander Energy and has previously served as a
offering on AIM in 2010 which raised US$60 million. He assumed the role of non-executive director of that company. He has also served as non-executive
Chairman in June 2016. independent director of SOCO International. He is a founder shareholder of CAML.
NIGEL HURST-BROWN, DEPUTY CHAIRMAN. Nigel is currently chief executive of KENGES RAKISHEV, NON-EXECUTIVE DIRECTOR. Kenges is a prominent business
Hotchkis and Wiley. Previously he was chairman of Lloyds Investment Managers leader in Kazakhstan. He serves as chairman of the board of directors for a number
between 1986 and 1990 before becoming a director of Mercury Asset Management of large companies including SAT & Company (KASE: SATC), a diversified industrial
and later a managing director of Merrill Lynch Investment Managers. He is also a holding company and NASDAQ listed Net Element International. He joined the
director of Borders & Southern Petroleum and a Fellow of The Institute of Company in December 2013.
Chartered Accountants in England and Wales.
NURLAN ZHAKUPOV, NON-EXECUTIVE DIRECTOR. Nurlan is a Kazakh national. He has
NIGEL ROBINSON, CHIEF EXECUTIVE OFFICER. Nigel is a member of the Institute of extensive experience in capital markets and has held positions at UBS and RBS. He
Chartered Accountants in England & Wales and was formerly a Royal Naval Officer is currently Advisor to the CEO of JSC Kazatomprom and a Non-Executive Director of
in the Fleet Air Arm. Upon leaving the Royal Navy, he qualified with KPMG where he SPK Astana, a Kazakh regional development institution. He has previously held a
stayed for a further three years before leaving to work in commerce. He worked for number of positions in the Kazakhstan’s resource sector for Tau-Ken Samruk (the
six years in management with British Airways plc before leaving in 2002. Following a national mining company), Chambishi Metals and ENRC. He holds Bachelor and
period consulting to smaller enterprises in the private sector, he joined CAML in Master’s Degrees in Economics from the Moscow State Institute for International
November 2007 as Group Financial Controller. In April 2009, he was appointed Chief Relations (MGIMO). Nurlan joined the Company in October 2011.
Financial Officer of the Group and, since then, has been instrumental in growing
the business. He became CEO in April 2018. ROGER DAVEY, NON-EXECUTIVE DIRECTOR. Roger, a Chartered Mining Engineer, has
over 45 years of experience in the international mining industry. He is also a non-
GAVIN FERRAR, CHIEF FINANCIAL OFFICER. Gavin holds post-graduate degrees in executive director of a number of other companies in the mining sector quoted on
geology and finance and has been involved in the mining sector for 21 years. His AIM, namely Atalaya Mining, Orosur Mining and Condor Gold. Until 2010, he was
career in industry began at Anglo American in the New Mining Business Division. He Senior Mining Engineer at N M Rothschild in the Mining and Metals Project Finance
spent 10 years in the investment banking sector focusing on equity and debt Team. Previously, he held senior management and director level roles in mining
financing for junior and major mining clients of Barclays Capital and Investec. He companies in South America and Africa as well as the UK, covering the financing,
joined the Company in June 2014 as business development director and became development and operation of underground and surface mining operations.
CFO in April 2018.40
CENTRA L A SIA META LS PLC
BUILDING A BIGGER BUSINESS
SENIOR MANAGEMENT BIOGRAPHIES
HOWARD NICHOLSON, TECHNICAL DIRECTOR. Howard is a OLEG TELNOI, GENERAL DIRECTOR, KOUNRAD COPPER COMPANY.
metallurgist with 35 years of experience in project development and Oleg joined CAML in 2007 with over ten years of experience in
mine operations management. Formerly the COO of European finance management in the mining industry in Central Asia. He is a
Minerals Corporation, he contributed to the development of qualified engineer and received a MBA in 1997.
Varvarinskoye, a copper-gold mine in Kazakhstan, and prior to this
had held senior management positions with Ashanti Goldfields, SAKEN ASHIRBEKOVA, GENERAL DIRECTOR, KEN SHUAK. Saken joined
Lonrho, and Anglo American. CAML in 2010 in order to oversee the development of the
commercial SX-EW plant at Kounrad. She was General Director of
NICK SHIRLEY, CSR DIRECTOR. Nick has over 20 years of experience JSC Varvarinskoye, a wholly-owned subsidiary of European Minerals
in the fields of environmental sciences, social responsibility and Corporation, having worked for that company in Kazakhstan since
hydrogeology gained predominately in the international overseas 1996. She is a graduate of the Moscow Institute of Steel and Alloys
mining industry in Central Asia, the Former Soviet Union and West with a degree and a PhD in metallurgy, and is a Kazakh national.
Africa. He has formerly worked for the Environment Agency in the
United Kingdom, Avocet Mining, Newmont-BHP’s joint venture NEIL STEVENSON, GENERAL DIRECTOR, SASA. Neil has a Bachelor of
Society De la Mine de Fer de Guinea, and Orsu Metals as well as Engineering degree from the University of Queensland and speaks
operating his own consultancy practice. both English and Russian. He has 30 years' experience in both
underground and open pit mining operations, of which 12 years have
PAVEL SEMENCHENKO, GENERAL DIRECTOR, SARY KAZNA. With over been spent in Eastern Europe and Kazakhstan. Neil is currently
17 years’ experience of managing businesses in Kazakhstan and a General Director of the Sasa mine in Macedonia. Prior to this role,
proven track record in the resources industry, Pavel has excellent he was General Director of ZCMC Armenia between 2014 and 2016,
management skills and an in-depth knowledge of the country’s and was Director of Sustainable Development from 2016 to 2017,
business environment. during which time he implemented IFC standards for CSR (corporate
social responsibility).41
CENTRA L A SIA META LS PLC
BUILDING A BIGGER BUSINESS
CORPORATE STRUCTURE42
CENTRA L A SIA META LS PLC
BUILDING A BIGGER BUSINESS
KOUNRAD RESOURCE AND TECHNOLOGY
Category Quantity, Mt Grade (%) Contained
copper, kt
Eastern Dumps
Indicated 89.7 0.10 85.8
Inferred 79.6 0.10 81.7
Total 169.3 0.10 167.5
Western Dumps
Indicated 296.4 0.10 282.4
Inferred 181.5 0.09 164.3
Total 477.9 446.7
Total East
647.1 614.2
and West
Prepared by Wardell Armstrong in June 2017
c. 68,000t copper has been extracted from dumps43
CENTRA L A SIA META LS PLC
BUILDING A BIGGER BUSINESS
KOUNRAD, PLS AND GROUNDWATER MODEL44
CENTRA L A SIA META LS PLC
BUILDING A BIGGER BUSINESS
SASA, RESERVES AND RESOURCES
▪ Sasa is a zinc / lead skarn deposit Category
Quantity
Grade Contained
(mt)
▪ Ore body dips at approximately 35°, with 2-3 parallel Mt Pb (%) Zn (%) Ag (g/t) Pb (kt) Zn (kt) Ag (koz)
lenses, 1km strike, vertical distance of approximately
700m (accessible by adits into the mountain) Svinja Reka, Reserves
▪ Mining method: sub-level caving, sub levels at 7m Probable 10.9 3.9 3.1 18.4 421 337 6,447
intervals
Total 10.9 3.9 3.1 18.4 421 337 6,447
▪ Uses single boom jumbos and diesel loaders, and either
trucks (30% ore) or ore passes, rail and shaft to surface Svinja Reka, Resources
(70% ore)
Indicated 13.3 4.6 3.7 22 611 490 9,403
▪ Primary ore body, Svinja Reka, with reserves of 10.9mt
Inferred 2.7 3.2 2.1 16.6 84 56 1,426
▪ Capital development to all main mine levels already
Total 16 4.3 3.4 21.1 695 546 10,829
completed, multiple access via two adits and shaft
Golema Reka, Resources
▪ Growth potential from significant inferred mineral
resources and other brownfield exploration targets Inferred 7.4 3.7 1.5 18.6 273 112 4,424
▪ Plan to further explore along strike and at depth, and Total 7.4 3.7 1.5 18.6 273 112 4,424
to implement modern exploration techniques
Prepared by SRK in July 201745
CENTRA L A SIA META LS PLC
BUILDING A BIGGER BUSINESS
SASA PROCESSING
LEAD
CONDITIONER
LEAD ROUGHER AND
SCAVENGERS LEAD THICKENER
PRIMARY/
SECONDARY
CRUSHING
ORE FROM LEAD FILTER
MINE
TO BALL MILL
LEAD
LEAD CLEANERS
CONCENTRATE
TO BALL MILL
ROD MILL
ZINC
CONDITIONER ZINC THICKENER
ZINC ROUGHER AND
SCAVENGERS ZINC FILTER
CLASSIFIER
ZINC
CONCENTRATE
BALL MILL ZINC CLEANERS
ZINC REGRIND
TAILINGS FACILITY46
CENTRA L A SIA META LS PLC
BUILDING A BIGGER BUSINESS
COPPER
Uses
▪ Copper is used in building construction, power generation and transmission, electronic product manufacturing, and the production
of industrial machinery and transportation vehicles
Commentary
▪ Demand for copper is expected to remain strong due to expectations of US infrastructure upgrades and China’s “One belt, one
road” initiatives
▪ Global copper consumption is expected to grow from 22.98Mt in 2017 to 24.39Mt in 2020, which equates to an average growth rate
of 2.0%. This will be supported by another few years of supportive industrial activity
▪ Concerns over copper concentrate supply disruptions appear to be easing, with new labour contracts agreed in Q1 2018 in some
high profile negotiations. The bulk of the contribution to tonnage growth for 2018 will be dominated by two key players, Grasberg
and Escondida
▪ Overall this year the copper market is expected to be in surplus of 76kt and stocks at 75 days of consumption
▪ Announcement of US import tariffs and a stronger dollar negatively impacted copper price in March 2018, however
▪ As refined consumption growth outpaces production, we expect a modest metal deficit of 71kt and surplus of 51kt in 2019 and
2020, respectively. Over this period, we anticipate that prices will trend higher to reach an annual average of $7,475/t ($3.39/lb)
by 2020
▪ Robust long-term demand is expected to outstrip global supply47
CENTRA L A SIA META LS PLC
BUILDING A BIGGER BUSINESS
ZINC
Uses
▪ Galvanizing is the predominant first use for zinc, accounting for c.60% of global zinc usage in all forms
▪ Other common first uses are die-casting and producing brass
▪ End-use market dominated by construction then transport
▪ China dominates global zinc consumption, 48%
Commentary
▪ In 2017 and 2018 low concentrate stocks have constrained refined production in China. These constraints together with global
demand growth of 2.0% p.a. are depleting stocks of refined zinc which are forecast to fall and to approach critically low levels
(equivalent to less than 40 days of global consumption) around the middle of 2018
▪ Such low stocks will provide fundamental support to higher prices. The price is forecast to climb from current levels of c$3,200 to
a cyclical peak of $4,300/t in 2019, averaging $2,400 in 2023 and 2024
▪ The most significant medium-term risk to the zinc consumption forecast is a major economic downturn and risk of substitution
▪ Positive near to medium term outlook for global economy and zinc demand, which is expected to grow from 14.7Mt in 2018 to
15.6Mt in 2021
▪ Higher prices motivated miners to increase production. Global zinc production is expected to grow from 13.6Mt in 2018 to 15.9Mt
in 202148
CENTRA L A SIA META LS PLC
BUILDING A BIGGER BUSINESS
LEAD
Uses
▪ The battery sector is the single largest consumer of lead, accounting for 85.5% of lead demand and can be sub-divided into
automotive and industrial batteries
▪ The second largest current end use for lead after batteries is in the chemical industry in the form of lead-based pigments and other
compounds, accounting for approximately 8% of lead consumption
Commentary
▪ Low stock levels of both concentrate and refined metals expected to persist during 2018 and 2019, which is expected to support
strong prices
▪ Lead market is expected to remain in deficit in 2018
▪ Combination of high prices and low TCs incentive miners to boost production
▪ Lead demand from the battery replacement and automotive sectors should be healthy in 2018 as a result of adverse weather
conditions in China and USA
▪ For the foreseeable future both hybrid cars and electric vehicles will continue to require lead-acid auxiliary batteries for onboard
systems which is a positive sign for lead demand
▪ Global lead consumption is forecast to grow by only 1.1% in 2018 to 12.7Mt. For the period 2018-2021 global growth is forecast to
grow at an average annual rate of 1.6% pa to reach 13.4Mt of demand in 2021
▪ During 2018-2021 total lead consumption is expected to increase by 825kt to total 13.4Mt in 2021You can also read