STATUS OF OFFSHORE WIND ENERGY DEVELOPMENT IN GERMANY - 1st Half 2018
←
→
Page content transcription
If your browser does not render page correctly, please read the page content below
1st Half
 2018

     STATUS OF OFFSHORE WIND ENERGY
         DEVELOPMENT IN GERMANY

                              On behalf of:

   Deutsche WindGuard GmbH - Oldenburger Straße 65 - 26316 Varel - Germany
          +49 (0)4451/95150 - info@windguard.de - www.windguard.com
1st Half STATUS OF OFFSHORE WIND ENERGY
2018 DEVELOPMENT IN GERMANY
STATUS OF OFFSHORE WIND ENERGY DEVELOPMENT IN GERMANY
The development of offshore wind energy is examined every six months on behalf of the industry
organizations. The development status for the first half of 2018 is the primary focus of this fact sheet.
The current and future development is closely tied to the political framework. Hence, in addition to the
status of offshore wind turbine (OWT) installations, grid connections and tender results are also
examined.
OFFSHORE WIND TURBINE GENERATORS AND FOUNDATIONS
In the first six months of 2018, 62 OWTs with an installed capacity of 430 MW were erected. None
fed into the grid by the end of June. Since there were no additional OWTs without a grid connection
from the previous year, the number Table 1: Offshore Wind Energy Development, as of 2018-06-30
of OWTs corresponds to the entire Status of the Offshore Wind Energy Capacity Number of
quantity of turbines prepared to Development [MW] OWT
1st Half 2018
feed into the grid. Out of all 75 Installed OWTs (no feed-in) 429.5 62
Addition
foundations that were built, 50 had
not been equipped with an OWT Foundations w/o OWTs 50
over the course of the first half of
2018. Those in addition to OWTs (feeding in) 5,387.4 1,169
(2018-06-30)
Cumulative
foundation structures installed in the
Installed OWTs (no feed-in) 429.5 62
previous year, which have not yet
been equipped with OWTs, sum up Foundations w/o OWTs 139
to a total of 139 foundations
ready for the construction of further OWTs. In the first six months of 2018, no OWT started feeding into
the grid. By June 30th, 2018, the cumulative capacity of all 1,169 OWTs feeding into the German
3,000 6,000 grid remained
Cumulative Capcity [MW] constant at
2,750 5,500
Annual Capcity Addition [MW] 5,387 MW compared
2,500 5,000
Annual Capacity Modification [MW] to the capacity at the
Capacity (Addition, Modification and
2,250 4,500 end of 2017. The
Annual Dismantling [MW]
Cumulative Capacity [MW]
2,000 4,000 development during
the first half of 2018,
Dismantling) [MW]
1,750 3,500
as well as the
1,500 3,000
cumulative status at
1,250 2,500
the end of June is
1,000 2,000 shown in Table 1. The
750 1,500 development of the
500 1,000 portfolio over time is
depicted in Figure 1.
250 500
0 0
2008 2009 2010 2011 2012 2013 2014 2015 2016 2017 1st half
-250 2018 -500
Figure 1: Development of Offshore Wind Energy in Germany (Capacity of OWTs
Feeding into the Grid), as of 2018-06-30
The data was obtained through a survey with industry representatives, as well as
additional research (e.g. BNetzA, BSH, ONEP, press releases etc.). 1
The figures contain partly rounded values. There may be slight deviations in their
addition..1st Half STATUS OF OFFSHORE WIND ENERGY
2018 DEVELOPMENT IN GERMANY
TURBINE CONFIGURATION
When compared to 2017, the average turbine Table 2: Average Turbine Configuration of OWTs
(feeding in), as of 2018-06-30
configuration of OWTs feeding into the grid
Average Turbine Configuration of Cumulative
remained unchanged. The average nominal OWT (feeding in) (2018-06-30))
capacity of all OWTs feeding into the German Average Nameplate Capacity (incl.
4,609 kW
grid by June 30th, 2018 was 4,609 kW. The upgrades)
average rotor diameter was 126 meters and the Average Rotor Diameter 126 m
hub height was 92 meters. The average specific
Average Hub Height 92 m
area power across all OWTs feeding into the
grid by the end of June amounted to Average Specific Power 369 W/m²
369 W/m².
TYPES OF FOUNDATIONS
The two types of foundations installed during the examined time period were monopiles (89%) and
suction bucket jackets (11%). The number of individual foundation types installed each year is depicted
in Figure 2. By the end of June, 72% 350
Monopile Jacket Tripod Tripile Suction Bucket Jacket
Number of Foundation
of all installed foundations are 300
monopiles, 12% are jackets, 9% are 250
tripods and 6% are tripiles. Suction 200
bucket jackets are being used for 150
100
the first time in a relevant number in
50
a German project in 2018 and 0
make up 1% of all installed 2012 2013 2014 2015 2016 2017 1st Half 18
foundations. Year of Installation of Foundation
Figure 2: Foundation Types over Time, as of 2018-06-30
WATER DEPTH AND DISTANCE TO SHORE
OWTs built in the first half of 2018 were located in a median water depth of 32 meters. The turbines
are at an average distance of 57 km from shore. When compared to current
140 portfolio projects, the water
Existing Projects
depths and distances from shore
120
Projects Under of three projects under
Distance to Shore [km]
100 Constructuion construction are situated mid-
Projects with FID
range. A further project under
80
construction, as well as the two
60 projects with investment decisions,
40 are those furthest from shore at a
water depth of about 40 meters.
20 Depicted in Figure 3 are the
Bubble area ≘ Installed capacity
0 projects arranged according to
0 10 20 30 40 50 status, installed capacity, water
Water Depth [m]
depth and distance from shore.
Figure 3: Water Depth and Distance to Shore, as of 2018-06-30
The data was obtained through a survey with industry representatives, as well as
additional research (e.g. BNetzA, BSH, ONEP, press releases etc.). 2
The figures contain partly rounded values. There may be slight deviations in their
addition..1st Half STATUS OF OFFSHORE WIND ENERGY
2018 DEVELOPMENT IN GERMANY
DISTRIBUTION ACROSS THE NORTH AND BALTIC SEA
Table 3 shows the distribution of commissioning and installation activities across the North and Baltic
Sea for the first half of 2018, as well as cumulative numbers. Foundation and turbine installation
activities in the first of half of June are concentrated around the North Sea region. 50 foundations and
62 turbines were newly erected, partially including the foundation, partially on existing foundations.
One particular offshore wind farm is currently under construction in the Baltic Sea,
but its turbines are not slated to Table 3: Distribution Across the North and Baltic Sea, as of 2018-06-30
be installed until sometime during Regional Distribution North Sea Baltic Sea
the second half of 2018. With Capacity Number Capacity Number
[MW] of OWTs [MW] of OWTs
that, at the end of June there
1st Half 2018
were 79 foundations in the North Installed OWTs (no feed-in) 429.50 62 0.00 0
Addition
and 60 in the Baltic Sea ready to
each receive their respective wind Foundations w/o OWTs 50 0
turbine. Additionally, 62 OWTs
located in the North Sea are OWTs (feeding in) 4,695.10 997 692.30 172
(2018-06-30)
ready to start feeding into the
Cumulative
grid. Of the overall capacity fed Installed OWTs (no feed-in) 429.50 62 0.00 0
into the grid up to the end of June
of 2018, 87% came from OWTs Foundations w/o OWTs 79 60
in the North Sea and 13% from
those in the Baltic Sea.
DISTRIBUTION ACROSS THE GERMAN FEDERAL STATES
Installed offshore capacities are associated with those coastal German federal states in which the grid
connection points are located. Projects situated in the territorial waters of a specific federal state fall
under the jurisdiction of that particular state. By the end of June, 2,917 MW or 54% of the installed
capacity was sited in Lower Saxony. 229 MW of that capacity are located in its territorial waters.
1,781 MW of capacity has its grid
48 MW Lower Saxony connection in Schleswig-Holstein, an
2.5 EEZ
equivalent share of 33%. Aside from one
MW
642 MW Lower Saxony nearshore turbine, all relevant projects
Territorial Waters
are located in the exclusive economic
Schleswig-Holstein zone (EEZ, German: Ausschließliche
EEZ
2,688 MW Wirtschaftszone or AWZ). By June 30th,
1,778 MW Schleswig-Holstein
Territorial Waters 2018, Mecklenburg-Vorpommern shows
a connected capacity of 690 MW. One
Mecklenburg-Western
Pomerania 48 MW project is located in its territorial
EEZ waters. The distribution across the
Mecklenburg-Western
229 MW Pomerania German federal states and maritime
Territorial Waters
areas, depicted in Figure 4, has
Figure 4: Distribution of Cumulative Capacity of OWTs feeding remained unchanged compared to 2017.
into the Grid Across German States and Maritime Areas, as of
2018-06-30
The data was obtained through a survey with industry representatives, as well as
additional research (e.g. BNetzA, BSH, ONEP, press releases etc.). 3
The figures contain partly rounded values. There may be slight deviations in their
addition..1st Half STATUS OF OFFSHORE WIND ENERGY
2018 DEVELOPMENT IN GERMANY
TENDERING FOR EXISTING OFFSHORE WIND ENERGY PROJECTS
In the months of April 2017 and April 2018, a total of 3,100 MW of the available offshore grid
connection capacity was awarded in two tendering rounds for each respective month. Participation in
these tendering rounds was only permitted to projects located within territorial waters, as well as the
clusters of Zones 1 and 2 that had either been approved or discussed prior to August 1st, 2016. The
projects with the lowest cost per kWh were awarded the winning bid. In addition to the four projects
approved in 2017, six additional offshore wind projects (OWPs) were awarded a winning
bid in 2018: Borkum Table 4: Awarded Offshore Projects in the North und Baltic Sea [Source: BSH, BNetzA,
Riffgrund West 1, Additional Research], as of 2018-06-30
Gode Wind 4, Project Award Accepted Expected Year of
Developer/Owner
Year Capacity Commissioning
Kaskasi II, Wikinger North Sea
Sued, Baltic Eagle Kaskasi II 2018 innogy 325 MW 2022
and Arcadis Ost 1. Borkum Riffgrund
2017 Ørsted (formerly Dong) 240 MW 2024
West 2
OWPs with winning OWP West 2017 Ørsted (formerly Dong) 240 MW 2024
bids of the tendering Gode Wind 3 2017 Ørsted (formerly Dong) 110 MW 2024
process for existing Borkum Riffgrund
2018 Ørsted (formerly Dong) 420 MW 2024/25
West 1
projects (2017 and Gode Wind 4 2018 Ørsted (formerly Dong) 131.75 MW 2024/25
2018) are shown EnBW He Dreiht 2017 EnBW 900 MW 2025
Baltic Sea
in Table 4. These
Arcadis Ost 1 2018 Parkwind 247.25 MW 2021
projects are Wikinger Süd 2018 Iberdrola 10 MW 2022
scheduled to become Baltic Eagle 2018 Iberdrola 476 MW 2022
operational starting in 2021 and until 2025. The respective commissioning dates as planned by the
individual stakeholders are aligned with the corresponding grid connection availability.
Across the six projects that received
10
Average Weighted Award Price winning bids in April of 2018, the
9 average weighted award price was
Range of Award Prices
8 4.66 € cents/kWh. This was notably
7
higher than the 0.44 € cents/kWh of
Award Price [ct/kWh]
the 2017 tendering round. Both for
6
2017 and 2018, bid values of
5 0 € cents/kWh were submitted. The
4 maximum award value for the 2018
tendering round of 9.83 € cents/kWh
3
was also markedly higher than the
2 6 € cents/kWh of 2017.
1
0
April 2017 April 2018
Tendering Round
Figure 5: Range of Award Prices in the Tendering for Existing
Projects, as of 2018-06-30
The data was obtained through a survey with industry representatives, as well as
additional research (e.g. BNetzA, BSH, ONEP, press releases etc.). 4
The figures contain partly rounded values. There may be slight deviations in their
addition..1st Half STATUS OF OFFSHORE WIND ENERGY
2018 DEVELOPMENT IN GERMANY
DEVELOPMENT TARGET
The status of capacity addition development up to the year 2025 as of June 30th, 2018 is shown in
Figure 6. In addition to the capacity of 5.4 GW already feeding into the grid by the deadline, OWTs
with a capacity of 0.4 GW had been erected and 1.5 GW are under construction. For a further
0.4 GW capacity an investment decision had been made. Pilot turbines with 19 MW that had not
received an investment decision by the June 2018 deadline did however receive a grid connection
confirmation. The maximum possible total capacity of 7.7 GW until 2020 according to the German
Energy Act (German: Energiewirtschaftsgesetz or EnWG) is expected to be reached.
In the two April 2017 and April 2018 tendering rounds for existing projects for offshore wind, projects
with a total capacity of 3.1 GW received winning bids. These are anticipated to be commissioned
between 2021 and 2025. It is assumed that the cumulative capacity of 10.8 GW will be reached by
the year 2025.
OWT (feeding in)
3.1 GW Installed OWT (no feed-in)
Expected
Development by Construction in Progress
2025 5.4 GW
19 MW (10.8 GW)
0.4 GW Final Investment Decision
Expected
Development by
2020 1.5 GW Grid Connection Capacity assigned
(7.7 GW)
0.4 GW
Acceptance of Bid
Figure 6: Development Status of Offshore Capacity with expected Commissioning by 2025, as of 2018-06-30
The data was obtained through a survey with industry representatives, as well as
additional research (e.g. BNetzA, BSH, ONEP, press releases etc.). 5
The figures contain partly rounded values. There may be slight deviations in their
addition..1st Half STATUS OF OFFSHORE WIND ENERGY
2018 DEVELOPMENT IN GERMANY
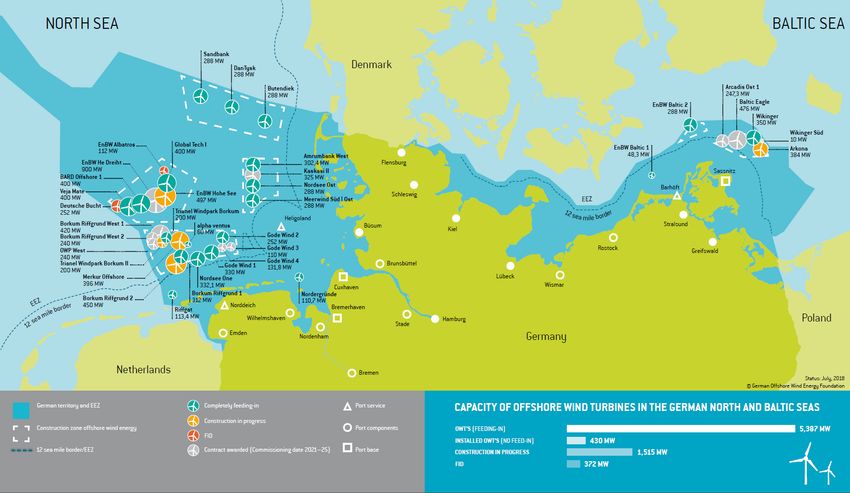
OFFSHORE WIND ENERGY – ACTIVITIES IN THE FIRST HALF OF 2018
By June 30th, 2018, twenty offshore wind energy projects (OWPs) were fully operational in Germany.
In addition to those OWPs in operation, five projects are in the construction phase by the end of June
2018. First offshore wind turbines have already been installed in two of the OWP under construction.
While the construction of the foundations has been completed in the OWP Merkur Offshore, in the
project Borkum Riffgrund 2 the installation of foundations and turbines is being done in parallel. The
two projects EnBW Hohe See and Trianel Windpark Borkum II also received their first foundations in the
first half of 2018. Installation of all foundations in the OWP Arkona was completed in 2017, but
turbine installation had not begun by June 30th, 2018.
The final investment decisions for two additional OWPs, EnBW Albatros and Deutsche Bucht, have been
made and are expected to be implemented by the end of 2019. Furthermore, three additional OWTs,
GICON-SOF and two pilot turbines in the North Sea, have received grid connection confirmations, but
investment decisions are outstanding.
In the two tendering rounds of 2017 and 2018, a total of ten OWPs received approval and thus
secured their respective grid connection capacity. An overview of the status and the geographic
location of the OWPs as described are provided in Figure 7.
Figure 7: Completely Feeding-In OWPs, OWPs under Construction and OWPs with Final Investment Decision and
OWPs with Awarded Bids, as of 2018-06-30
The data was obtained through a survey with industry representatives, as well as
additional research (e.g. BNetzA, BSH, ONEP, press releases etc.). 6
The figures contain partly rounded values. There may be slight deviations in their
addition..1st Half STATUS OF OFFSHORE WIND ENERGY
2018 DEVELOPMENT IN GERMANY
OVERVIEW OF ADDITIONAL GRID CONNECTION CAPACITY
At the end of the first half of 2018, a grid connection capacity of about 5.7 GW was available for
offshore wind projects in the German North and Baltic Sea. Five additional grid connections with
2.6 GW are under construction, so that a capacity of 8.2 GW will be achieved at the close of 2020.
Three additional grid connection systems will be realized by 2025 according to the Offshore Grid
Development Plan (German: Offshore-Netzentwicklungsplan or O-NEP) for some OWPs that received
approval in the first two tendering rounds for existing projects. With that, a capacity of 10.9 GW will
be available by that time, which will not be entirely exhausted by the awarded capacity.
For OWPs that will be realized within the future central system starting 2026, the Area Development
Plan (German: Flächenentwicklungsplan or FEP), which is to be prepared by the Federal Maritime and
Hydrographic Agency (German: Bundesamt für Seeschifffahrt und Hydrographie or BSH), provides the
basis to determine the need for offshore connection links. The FEP is currently available as a preliminary
draft and will be finalized by the end of June 2019. According to the current status, a total grid
connection capacity of about 16.4 GW is anticipated by the end of 2030. Table 5 lists information
about installed and planned grid connections.
Table 5: Installed and Planned Grid Connections (to Converter Station or Bundling Point) in the North and Baltic
Sea [Source: O-NEP 2030, Preliminary Draft FEP, Additional Research], as of 2018-06-30
(Planned) Available
Grid Connection Status Capacity
Comm. Year Capacity
Nordsee
Nearshore Emden Operating 2004 4,5 MW
NOR-2-1 (Alpha Ventus) Operating 2009 62 MW
NOR-6-1 (BorWin1) Operating 2010 400 MW
NOR-0-1 (Riffgat) Operating 2014 113 MW
NOR-2-2 (DolWin1) Operating 2015 800 MW 88 MW
NOR-4-1 (HelWin1) Operating 2015 576 MW
NOR-4-2 (HelWin2) Operating 2015 690 MW 62 MW
Operating 2015
NOR-5-1 (SylWin1) 864 MW
NOR-6-2 (BorWin2) Operating 2015 800 MW 14 MW
NOR-3-1 (DolWin2) Operating 2016 916 MW
NOR-0-2 (Nordergründe) Operating 2017 111 MW
NOR-2-3 (DolWin3) Under Construction 2018 900 MW 50 MW
NOR-8-1 (BorWin3) Under Construction 2019 900 MW
NOR-3-3 (DolWin6) Approval Procedure in Progress 2023 900 MW 658 MW
NOR-1-1 (DolWin5) Approval Procedure in Progress 2024 900 MW
NOR-7-1 (BorWin5) Approval Procedure in Progress 2025 900 MW
NOR-7-2 (BorWin6) Named in the preliminary FEP draft 2027 932 MW 932 MW
NOR-3-2 (DolWin4) Named in the preliminary FEP draft 2028 1,100 MW 1,100 MW
NOR-6-3 (BorWin4) Named in the preliminary FEP draft 2029 1,200 MW 1,200 MW
NOR-9-1 Named in the preliminary FEP draft 2030 1,200 MW 1,200 MW
Ostsee
Nearshore Rostock Operating 2006 2.5 MW
OST-3-1 (Baltic I) Operating 2011 51 MW
OST-3-2 (Baltic II) Operating 2015 288 MW
OST-1-1 (Ostwind 1) Under Construction 2018 250 MW
OST-1-2 (Ostwind 1) Under Construction 2019 250 MW
OST-1-3 (Ostwind 1) Under Construction 2019 250 MW 5 MW
OST-2-1 Named in the preliminary FEP draft 2021 250 MW
OST-2-2 Named in the preliminary FEP draft 2021 250 MW 24 MW
OST-2-3 Named in the preliminary FEP draft 2022 250 MW 3 MW
OST-1-4 Named in the preliminary FEP draft 2026 300 MW 300 MW
The data was obtained through a survey with industry representatives, as well as
additional research (e.g. BNetzA, BSH, ONEP, press releases etc.). 7
The figures contain partly rounded values. There may be slight deviations in their
addition..1st Half STATUS OF OFFSHORE WIND ENERGY
2018 DEVELOPMENT IN GERMANY
PROJECTION OF MONTHLY ELECTRICITY PRODUCTION FROM OFFSHORE WIND ENERGY
Figure 8 shows the preliminary 2018 - Monthly Production 2017 - Monthly Production
2018 - Cumulative Production 2017 - Cumulative Production
projection from transmission grid
2.5 25
operators of electricity produced
Cumulative Production [TWh]
by OWTs. In the first half of 2018,
Monthly Production[TWh]
2.0 20
German OWTs fed just under
9 TWh of electricity into the grid. 1.5 15
According to BDEW, this is
1.0 10
equivalent to about 2.9% of the
gross electricity production during 0.5 5
that time. The energy yield of the
first half of 2018 is hence about 0.0 0
Jan Feb Mar Apr May Jun Jul Aug Sep Oct Nov Dec
16% above that of the previous
year. Figure 8: Electricity Production from Offshore Wind Turbine Generators
in the First Half of 2018 and 2017, [Database: Projection TSOs]
MONTHLY MARKET VALUE FOR ELECTRICITY FROM OFFSHORE WIND ENERGY
The monthly market value is the average
2018 - Market Value 2017 - Market Value
5 weighted electricity market revenue per kWh
for those hours during which electricity was fed
Marktwert [ct/kWh]
4 into the grid from offshore wind energy. As
3
depicted in Figure 9, in the first half of 2018 the
monthly market value increased from
2 2.5 € cents/kWh in January to 3.8 € cents/kWh
in June. The average market value is 1% lower
1
than in the first half of 2017. The level of the
0 weighted monthly market values was 9% less in
Jan Feb Mar Apr May Jun Jul Aug Sep Oct Nov Dec the first half of 2018 than the average value of
Figure 9: Monthly Market Value for OWTs in the First the mean EPEX SPOT SE (European Power
Half of 2018 and 2017 [Source: Netztransparenz] Exchange) hourly contracts.
INVESTMENT VOLUME OF OFFSHORE WIND ENERGY PROJECTS IN GERMANY
Offshore wind energy projects are 5
characterized by large investment
volumes. According to estimations, 4
[billion euros]
Investment
annual investments in the offshore 3
wind energy sector have exceeded
2
€3 billion every year since 2013 (see
Figure 10). Compared to the time the 1
projects were connected to the grid,
0
investments are distributed more 2007 2008 2009 2010 2011 2012 2013 2014 2015 2016 2017
evenly over time since the realization
of these projects always takes several Figure 10: Investment in the Construction of Offshore Wind Turbines
2007 until 2017 [Source: AGEE Stat]
years.
The data was obtained through a survey with industry representatives, as well as
additional research (e.g. BNetzA, BSH, ONEP, press releases etc.). 8
The figures contain partly rounded values. There may be slight deviations in their
addition..1st Half STATUS OF OFFSHORE WIND ENERGY
2018 DEVELOPMENT IN GERMANY
Data Collection, Research and Adaptation:
Deutsche WindGuard GmbH
Silke Lüers
Anna-Kathrin Wallasch
Dr.-Ing. Knud Rehfeldt
Merle Heyken
Translation: Martin Schmidt-Bremer Jr.
www.windguard.de
Deutsche WindGuard GmbH - Oldenburger Straße 65 - 26316 Varel - Germany
+49 (0)4451/95150 - info@windguard.de - www.windguard.comYou can also read


