2018 EDUCATION QUALITY DIALOGUES - MINISTRY OF EDUCATION - Ministry of Education Presentation by
←
→
Page content transcription
If your browser does not render page correctly, please read the page content below
REPUBLIC OF KENYA

        MI N I ST RY OF E D U CAT ION
    STATE DEPARTMENT OF BASIC EDUCATION

2018 EDUCATION QUALITY
       DIALOGUES
             Presentation by:

           Ministry of Education
Introduction
Kenya has made great strides in achieving education for all.
Among them:
Participation in ECDE has increased, from NER of 64.2% in 2012
to 74.9% in 2016.
Primary NER rose from 88% in 2012 to 91.2% in 2016.
Close to 85% of learners who complete Standard 8 make it
to secondary schools.
Secondary NER, although still low, rose from 41.7% in 2012
to 49.5% in 2016.
With Increased access there arises concern on quality of
education.
Need to collect empirical data to inform on learning
outcomes as well as conditions of learning.Introduction –cont.-
To this end , MoE, through KNEC, has regularly
conducted National assessments to monitor learner
achievement.
Four (4) Monitoring Learner Achievement studies:
Early Grade Mathematics Assessment
(EGMA)Baseline Study at Class 2 ( 2016).
National Assessment System for Monitoring Learner
Achievement (NASMLA) at Class 3( 2016)
Southern & Eastern African Consortium for Monitoring
Educational Quality (SACMEQ) IV at Class 6 ( 2013-
2017) .
Monitoring Learner Achievement (MLA) at Form 2
(2014-2017).Purpose of National Assessments Establish pupils competency levels in Literacy and Numeracy; Find out the personal, home-based and school- based factors that influence the learning outcomes of pupils/ students in Literacy and Numeracy; Determine the combination of inputs that are associated with pupil / student achievement in Literacy and Numeracy.
Conceptual Framework

 School Characteristics.
 Type, location, school type, home            Learner Achievement
 work policy, class sizes, head
 teacher qualification, pupil
 discipline, parental involvement,
 etc.

Pupil/ Student Characteristics             Teachers Characteristics
Age, gender, absenteeism, socio economic   Age, gender, qualification,
status (SES), meals, siblings, etc.        workloads ,In-service training,
                                           etc.
Research Methodology Research Design Descriptive Survey The sample of schools was generated using the Sample Design Manager (SAMDEM).
National Assessments
1. Early Grade Mathematics Assessment (EGMA) Baseline Study
Undertaken to establish early grade mathematics competencies among
Class 2 pupils before EGM interventions.
Gathered information on pupil, teacher school and home characteristics.
Actual sample :
300 regular (public and private) schools
21 SNE schools
5,762 Class 2 pupils
325 Head teachers
325 Senior teachers
325 Class 2 Mathematics teachers
71 Curriculum Support Officers
52 Quality Assurance and Standards Officers
20 Primary Teacher Training College lecturersNational Assessments Cont…
2. National Assessment System for Monitoring Learner
Achievement (NASMLA) Class 3
Assessed Class 3 pupils in numeracy (Mathematics)and
literacy (English and Kiswahili).
Assessed pupils’ acquisition of Life Skills and HIV and
AIDS awareness.
Gathered information on pupil, teacher, school and
home characteristics.
Sampled schools: 250
Actual sample :
247 regular (public and private) schools
5,522 Class 3 pupils
247 Head teachers
466 Class 3 teachersNational Assessments Cont…
3. Southern and Eastern Africa Consortium for Monitoring
Educational Quality (SACMEQ) IV
Assessed Class 6 pupils competencies in Mathematics
and Reading (English).
Assessed Class 6 teachers competencies in
Mathematics and Reading (English).
Assessed pupils’ knowledge in Life Skills and HIV and
AIDS.
Gathered information on pupil, school and home
characteristics .
Sampled schools: 230
Actual sample :
5,325 Class 6 pupils
652 teachers
224 schools
224 school headsNational Assessments
4. Monitoring Learner Achievement (MLA) at Form 2
Assessed Form 2 learners competencies in
numeracy (Mathematics) and literacy skills
(English).
Assessed learner’s knowledge in Life Skills and
HIV and AIDS.
Gathered information on pupil, school and
home characteristics. Actual sample :
239 schools
5,872 Students
475 Form 2 teachers
239 PrincipalsKEY FINDINGS
LEARNING OUTCOMES: EGMA Class 2
                                  Performance per Mathematics Operation
            100
                           79.7               79.1
            80
                                                                             68.2
                                                              62.6
                                                                                             57.3
            60
  Percent

                                                                                      42.7
                                                       37.4
            40                                                        31.8
                    20.3               20.9
            20

             0
                    Addition          Subtraction    Multiplication    Division     Number pattern

                  Not achieved 50 % benchmark                   Achieved 50 % benchmark

A considerable percentage of Class 2 pupils did not reach the 50%
benchmark in most mathematical operations especially multiplication,
division and number patterns.
LEARNING OUTCOMES :EGMA Class 2
% of pupil reaching 50% & above benchmark in selected
counties in EGMA Mathematics
99.2
100 95
90.2
80
59.2 57.3
60 55.6 54.7 54.2 54 54
Percent
50.5
45.7
40
20
0
Vihiga
Kitui
Wajir
Bungoma
Trans Nzioa
West Pokot
Turkana
Mombasa
Tharaka Nithi
Meru
Samburu
Kirinyaga
High performing Low performing
Lowest achievement levels observed among pupils from counties in
ASAL areas such as West Pokot, Turkana, Wajir and Samburu.LEARNING OUTCOMES: NASMLA Class 3: Numeracy
% of
Level Description of Competency pupils
Applies single step addition or subtraction operations (e.g. add
numbers without carrying over, subtract without borrowing).
Level 1 Counts in whole numbers. 83.1
Applies a two-step addition or subtraction operation involving
carrying over and borrowing. Applies simple multiplication
operations involving multiples of 10. Recognizes simple fractions.
Level 2 Divides whole numbers. Identifies lines and patterns. 71.1
Translates information presented in a sentence into one
arithmetic operation. Interprets place value of whole numbers up
to thousands. Adds and subtracts simple fractions. Interprets
Level 3 simple common everyday units of measurement such as days,
weeks, litres, metres and shillings. 36.1
Translates information presented in sentences into simple
arithmetic operations. Uses multiple arithmetic operations (in the
Level 4 correct order) on whole numbers.5 4.5
A considerably high percentage of pupils is not attaining high order skills
in Mathematics; 95.5% did not attain Level 4 competencies.LEARNING OUTCOMES : NASMLA Class 3: Literacy
English Kiswahili
Level Competency Description % of % of
learners learners
Pre-reading: Matches words and pictures involving
Level 1 concrete concepts and everyday objects. Arranges words
in alphabetical order. 14.9 10.5
Emergent reading: Spells correctly simple everyday words
Level 2 and recognizes missing letters in such words. Uses familiar
words to complete simple everyday sentences. 60.1 63.1
Basic reading: Uses correct punctuation in simple
Level 3 sentences. Interprets meaning by matching words and
phrases. Identifies the main theme of a picture. 38.1 69.2
Reading for meaning: Links and interprets information
located in various parts of a short passage. Infers meaning
Level 4 from short passages. Understands and Interprets meaning
of a picture and writes short sentences to describe the
theme. 28.6 47.1
Majority of the pupils have not acquired basic skills in literacy; 85.1% and
90.5% did not attain Level 1 competencies in English and Kiswahili
respectively..Mean scores
0
200
600
400
Kirinyaga 608.7
Tharaka Nithi 595.4
High
Embu 583.2
National 500.2
Maths
Mandera 400.1
Bungoma 430.6
Low
Marsabit 431.9
Nairobi 611.6
pupils from counties in ASAL areas.
Taita Taveta 606.7
High
Mombasa 595.6
National 499.5
English Marsabit 411.2
West Pokot 430.6
Low
Turkana 432.4
NASMLA Class 3: Achievement per county
Mombasa 615.4
Taita Taveta 597.6
High
Tharaka Nithi 569
Achievement levels in numeracy and literacy in selected counties
National 500.2
Kiswahili
Marsabit 389
Mandera 397.8
Low
Low achievement in numeracy and literacy skills is observed mainly among
Turkana 424.9LEARNING OUTCOMES : SACMEQ IV: Class 6 Region Reading Mean Mathematics Mean Nairobi 657.9 689.6 Central 600.1 613.1 North Eastern 589.5 676.1 Eastern 585.9 612.6 Nyanza 573.2 614.5 Rift Valley 571.3 603.3 Coast 564.1 608 Western 557.5 573.1 National 577.6 608.1 • Higher national mean realized in Mathematics than in English. • Lowest achievement levels in Reading and Mathematics recorded in Western region with a mean score of 557.5 and 573.1 respectively. • However, regionally Kenya was position 2 and 3 in Numeracy and Literacy respectively.
SACMEQ IV: Teacher performance A notable decline in performance of teachers in Reading except in North Eastern. Nyanza had the highest decline at -64.0 mean score points. Indeed there was a percentage of teachers ( 1.2%) operating at Level
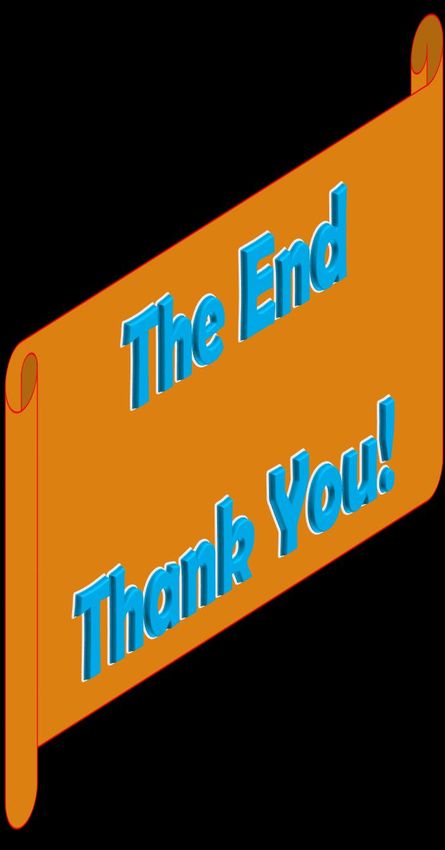
LEARNING OUTCOMES : MLA Form 2
                           Numeracy Achievement Levels in MLA Form 2
   100

          80

               71.1     67.3                                           70
          60                                       81.3      85.4
                                                                                   79.8   79.2
                                 88.8     89.5
Percent

          40

          20
               28.9     32.7                                           30.0
                                                   18.7                            20.2   20.8
                                 11.2     10.5               14.6
           0

                 Achieved minimum competency     Not achieved minimum competency

 Considerably high percentages of Form 2 students have not
 attained minimum competency levels in specific areas in
 Mathematics, most of which are covered from primary level.
LEARNING OUTCOMES : MLA Form 2 Literacy
Literacy Achievement Levels in MLA Form 2
100
23.7 30.7
80 44.1 38.6 37.3
49.6
60
Percent
40 76.3 69.3 62.7
55.9 61.4
50.4
20
0
Listening & Reading Writing Grammar Literary Skills Total
Speaking comprehension
Achieved minimum competency Not achieved minimum competency
Form 2 students continue to demonstrate low acquisition of literacy
skills especially higher order literacy skills such as Writing and Reading
Comprehension.Summary of the findings from the EGMA Class 2, NASMLA
Class 3, SACMEQ IV and MLA Form 2 studies
Achievement of Competencies in Literacy and Numeracy
Low achievement levels in literacy are more prevalent in
ASAL counties.
Low levels of literacy and numeracy skills start at early
grades and persist in secondary level.
Generally, girls perform better in literacy, especially at early
grades; boys perform better in numeracy.
Older pupils achieve less than younger pupils indicating
that overage affects learning outcomes.
Urban and private schools perform better than their rural
and urban counterparts respectively.Achievement of Competencies in Literacy and Numeracy (Cont.) Pupils from high socio economic background perform better than those from low socio economic status. Pupils sharing text books with more than one colleague perform worse than those not sharing. Pupils having regular meals perform better those not having regular meals. Pupils whose parents meet teachers regularly perform better than those whose parents don’t frequently meet teachers.
Pupil / Student Characteristics Pupil overage persists- 40.5 % of Class 3 pupils were overage. Overage more prevalent in ASAL counties. Garissa recorded the highest percentage( 98%). Class repetition in SACMEQ IV rose from 48.2% in 2007 to 53.3% in 2013- mostly in Nyanza (60.3%), Western (57.3%) R/Valley (54.6) and Coast (54.1%). Pressure from Parents and low achievement were cited as main causes of class repetition.
Pupil /Student Characteristics Cont…
Drop out: in MLA, Form 2 more boys than girls dropped
out.
Financial constraints, truancy, low academic
achievement, marriage and pregnancies were cited
as reasons for drop out.
Gender disparity: Near gender parity in Class 3, at Class
6 there are more boys than girls enrolled in schools in
North Eastern Region (ASAL areas).
North Eastern had the lowest percentage of girls
enrolled.
Pupil absenteeism still persists; 52% of pupils and 59.6% of
pupils in EGMA and NASMLA respectively reported to
have been absent during the term.Pupil /Student Characteristics –Cont.-
Sickness was cited as the most common reason
for absenteeism
Highest level of absenteeism was reported in
ASAL counties with Marsabit ( 97.7%) and
Mandera (93.9%) leading in NASMLA Class 3
study.
EGMA Baseline study , Head teacher cited lack
of food as a cause of absenteeism(76.1%)
Pupil/ student discipline – truancy cited as one of
the forms of indiscipline among pupils.
Discipline cited as one of the factors affecting
leaning outcomes.
Level of HIV/AIDS awareness is satisfactory
although there is stigma associated with HIV/Aids
among Class 3 learners.Pupil/Student Characteristics –Cont…
Provision of Regular meals- Considerable
percentage of Pupils do not have regular meals.
Marsabit had the highest percentage( 32.5%)
of Class 3 pupils not taking supper regularly
and also the highest percentage of
absenteeism.
Kwale( 37.5%) and Busia( 35.5%) had the
highest percentages of Class 3 pupils not
taking breakfast regularly.
ICT Skills – Only 31.9 % of Class 3 pupils reported
to have been exposed to computer/laptopsTeacher, H/Teacher & School Characteristics Teacher Absenteeism : in EGMA 36% of teachers reported to be absent without permission. Teacher Discipline : Skipping classes and lateness to class are prevalent among Class 6 and Form 2 teachers. Syllabus coverage : Inadequate teachers (64.7 %), time wastage (57.5 %), frequent absenteeism by pupils (50.9 %) ) and teachers (47.7 %), failure to prepare schemes of work(45.3%),inadequate training(39.4%),low teacher morale (37.9%) and weak administration( 35.2%) affected to a large extent syllabus coverage at Class 3.
Teacher, H/Teacher & School Characteristics Cont…
ICT Skills: Teachers lack requisite ICT skills
There is low integration of ICT in enhancing
learning.
Testing : Significant percentage of teachers (39.7%)
frequently used commercially sourced tests,
compromising quality of learning and assessment.
Professional development: A number of teachers
have never attended in-service courses.
Weak pedagogy: Considerable percentage of
Class 3 teachers are not motivated to mark their
pupils work.
A significant percentage of Class 2 teachers
does not use lesson plans and lesson notes.Teacher, H/Teacher & School Characteristics- Cont.-
Staffing :Overall shortage of class 3 teachers-
27.7%
ASAL counties experiencing more teacher
shortages.
West Pokot(75.0%), Narok( 73.8%),
Mandera( (73.0%),Tiata Taveta (
72.6%),Kajiado(71.0%), Kitui ( 70.1%).
Learners with Special needs and disabilities: Large
percentage of Class 3 teachers (57.7%) had learners
with special needs and disabilities.
Teachers and Head teachers lack requisite skills to
handle learners with special needs and disabilities.
Lack of assistive devises and facilities adapted for
learners with special needs and disabilities.
Desired Pupil toilet ratio not realized.Teacher, H/Teacher & School Characteristics- Cont.-
Some regions do not have Educational Assessment
and Resource Centres to identify and support learners
with special needs.
Performance Appraisal System -Teachers and head
teachers lack adequate training in Performance
Appraisal Systems.
Only 16.8% of Class 3 teachers were familiar with PAS to a
large extent.
Professional development -Majority of head teachers
have not received in-service training in institutional
(school) management.
Lack of adequate instructional materials, the 1:1 pupil
book ratio had not been attained.Teacher, H/Teacher & School Characteristics- Cont.-
Support in Curriculum Implementation
Lack of regular assessments by DQASO
over 70.0 % of Form 2 teachers reported
not to have been assessed on
curriculum implementation within a
period of four years preceding the time
of data collection.
Considerable percentage( 34.2%) of head
teachers did not monitor class attendance by
Class 2 teachers
Inadequate parental involvement in their
children’s learning:
Majority (68%) of Class 2 teachers
reported that parents did not check
their children’s homework.Policy Commitments/Suggestions Need to dialogue on: Improved pedagogy to enhance acquisition of high order skills in numeracy and literacy. Focus on early learning/ECDE to ensure acquisition of requisite competencies before joining Grade 1. Mitigating overage by reinforcing school entry age and class repetition policies. Enhancing instructional supervision so as to ensure that teachers embrace best practices in curriculum delivery. Strengthening of institutional based quality assurance. Continuous capacity building of teachers in their subject areas as well as in ICT and SNE.
Policy Commitments/Suggestions -Cont.- Distribution of teachers across counties. Pupil and Teacher absenteeism. ICT infrastructure- provision, utilization and maintenance. Utilization of, and enhanced accountability for textbooks to ensure the 1:1 policy is adhered to. Child friendly schools. School Feeding Programmes- to be enhanced, more significantly in ASAL areas.
34

     Education Quality Dialogues
You can also read