2018 Investor Conference - November 2018

Page created by Dan Santiago
 
CONTINUE READING
2018 Investor Conference - November 2018
2018 Investor Conference
      November 2018

                           1
2018 Investor Conference - November 2018
Cautionary Statement on Forward-Looking Statements & Non-GAAP Measures
This presentation contains “forward-looking statements” within the meaning of Section 27A of the Securities Act of 1933 and Section 21E of the
Securities Exchange Act of 1934. We intend all forward-looking statements to be covered by the safe harbor provisions of the Private Securities
Litigation Reform Act of 1995. Forward-looking statements generally can be identified by the fact that they do not relate strictly to historical or
current facts and by the use of forward-looking words such as “expect,” “expectation,” “believe,” “anticipate,” “may,” “could,” “intend,” “belief,”
“plan,” “estimate,” “target,” “predict,” “likely,” “will,” “continue,” “should,” “forecast,” “outlook” or similar terminology. These statements are based
on current estimates and assumptions made by us in light of our experience and perception of historical trends, current conditions and expected
future developments, as well as other factors that we believe are appropriate and reasonable under the circumstances, but there can be no
assurance that such estimates and assumptions will prove to be correct.
Forward-looking statements include, without limitation, statements regarding the future business plans, earnings and performance of Yum
China, statements regarding the revitalization of Pizza Hut, anticipated effects of population and macroeconomic trends, the capital structure of
Yum China, the anticipated effects of our digital and delivery capabilities on growth, and beliefs regarding the long-term drivers of Yum China’s
business. Forward-looking statements are not guarantees of performance and are inherently subject to known and unknown risks and
uncertainties that are difficult to predict and could cause our actual results or events to differ materially from those indicated by those
statements. We cannot assure you that any of our expectations, estimates or assumptions will be achieved. The forward-looking statements
included in this presentation are only made as of the date of this presentation, and we disclaim any obligation to publicly update any forward-
looking statement to reflect subsequent events or circumstances, except as required by law. Numerous factors could cause our actual results or
events to differ materially from those expressed or implied by forward-looking statements, including, without limitation: whether we are able to
achieve development goals at the times and in the amounts currently anticipated, if at all, the success of our marketing campaigns and product
innovation, our ability to maintain food safety and quality control systems, our ability to control costs and expenses, including tax costs, as well
as changes in political, economic and regulatory conditions in China. In addition, other risks and uncertainties not presently known to us or that
we currently believe to be immaterial could affect the accuracy of any such forward-looking statements. All forward-looking statements should
be evaluated with the understanding of their inherent uncertainty. You should consult our filings with the Securities and Exchange Commission
(including the information set forth under the captions “Risk Factors” and “Forward-Looking Statements” in our Annual Report on Form 10-K) for
additional detail about factors that could affect our financial and other results. This presentation includes certain non-GAAP financial measures.
Reconciliation of these non-GAAP financial measures to the most directly comparable GAAP measures are included in this presentation where
indicated. You are urged to consider carefully the comparable GAAP measures and reconciliations.
                                                                                                                                                            2
2018 Investor Conference - November 2018
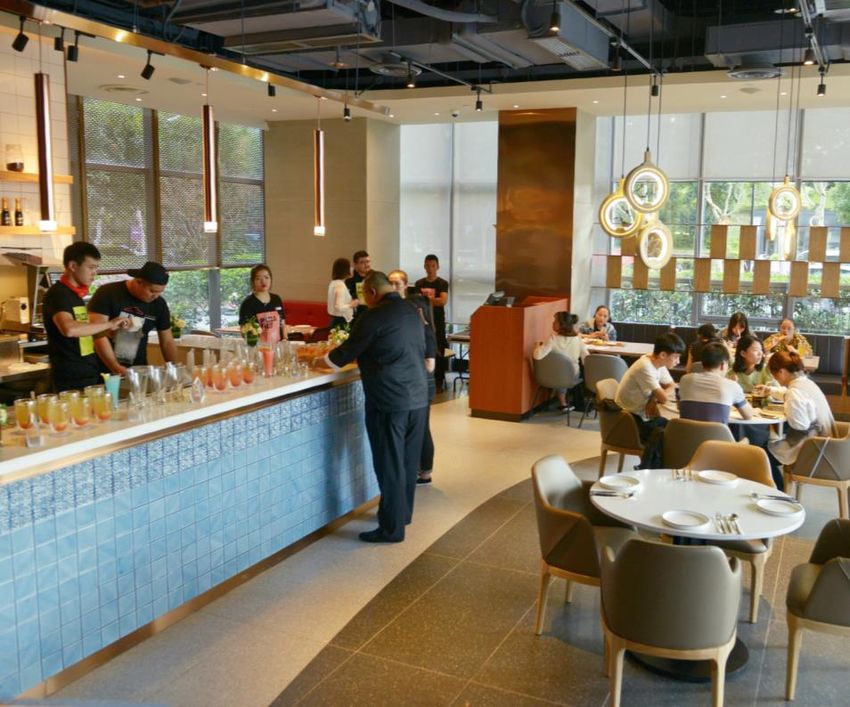
Yum China by the numbers – a powerful business

                                                                                                                             NYSE listed with
                               #1 Western QSR &                                                                            $13.8bn market cap
                              CDR brands in China
                                                                                                                          #397 Fortune 500 2017

                     8,300+ stores in                                                                                          145mn+ members of KFC
                   1,200+ cities in China                                                                                     50mn+ members of Pizza Hut

                         #1 restaurant operator
                                                                                                                    450,000+ employees in China
                    in digital & delivery in China
                                                                                                                              Strong management

Note: Store and member counts as of September 30, 2018; Market cap as of the close of October 31, 2018; Fortune 500 ranking in terms of sales
2018 Investor Conference - November 2018
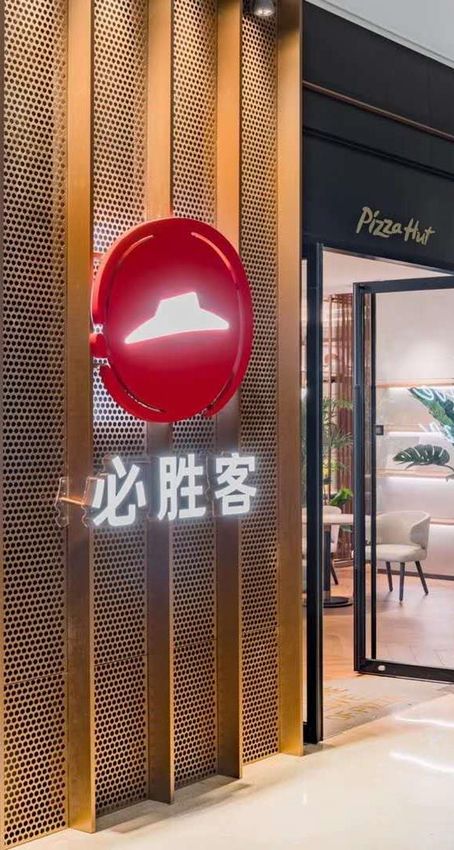
Strong Consumer Sector Underpinning
                                 China’s GDP growth for Next Few Years

                                           China Total Consumption Growth 1

             (RMB trn)

                                                                                                                          49
                                                                                                           44
                                                                                             40                                              Consumption is
                                                                               37
                                                                 33
                                                  30                                                                                         expected to grow at
                                   27
                     24                                                                                                                      ~11% CAGR between
                                                                                                                                             2018 and 2020

                   2013A         2014A         2015A          2016A         2017A         2018E          2019E         2020E

Source: National Bureau of Statistics, Wind.
1 Total consumption refers to total retail sales of consumer goods, including sales of consumable products and revenue from restaurant and food services.          4
2018 Investor Conference - November 2018
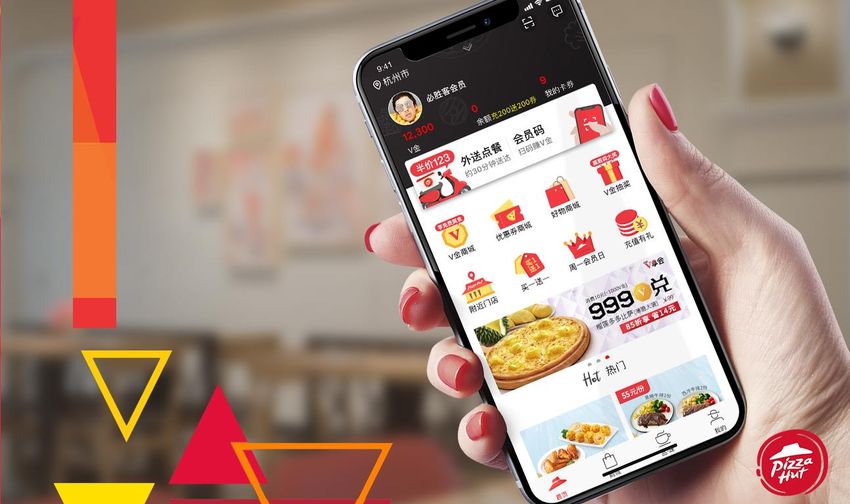
Fast Growing Dining Market Driven by Rapid Shift
                         to Online-based Consumption
                                                                                     Increasing Penetration of China
                      Growing China Dining Market Size
                                                                                       Online Food Delivery Market

      (RMBbn)
                                                                              Market size (RMBbn)

                                                                              Online penetration (%)
                                                                                                                        11.5%
                                                                                                                10.2%
                                                                                                        8.2%
                                                                5,203
                                                        4,800                                                            598
                                                4,403                                            5.2%
                                        4,000                                        3.1%                        489
                         3,603                                          1.4%
            3,200
                                                                                                         360

                                                                                                  208
                                                                                      113
                                                                         46

           2015A         2016A          2017A   2018E   2019E   2020E   2015A        2016A      2017A   2018E   2019E   2020E

Source: iResearch, Alibaba, Analysys.
                                                                                                                                5
2018 Investor Conference - November 2018
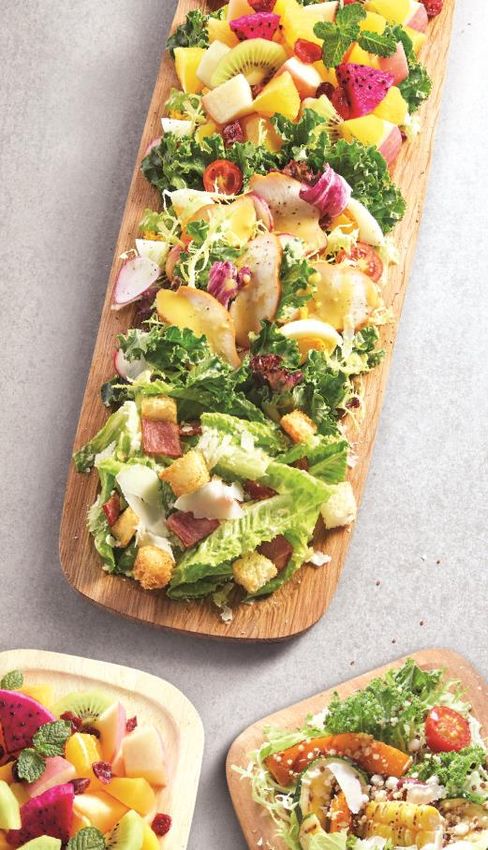
Huge Market Potential for Continued Expansion

           QSR Penetration – China vs Western Mature Markets                              QSR Penetration – Shanghai vs Malaysia 2

       QSR Market as % of Overall Food Service Market 1                                Restaurants per Million Inhabitants

                                                                                                                                    34
                                 44%          44%
                                                                                                              21
                                                            28%       26%      23%

                                Canada        USA          Germany    United   China                      Shanghai              Malaysia
                                                                     Kingdom
      Market Size:

     Total Food Service ($bn)      44           524           45       90       728     KFC + PH        496 restaurants      1,082 restaurants

     QSR Market ($bn)              19           228           13       24       166     Population          24mm                  32mm

Source: Euromonitor; Bain analysis.
1 QSR penetration based on Bain 2016 analysis.
2 Restaurant numbers and population as of 2017 year-end.
                                                                                                                                                 6
2018 Investor Conference - November 2018
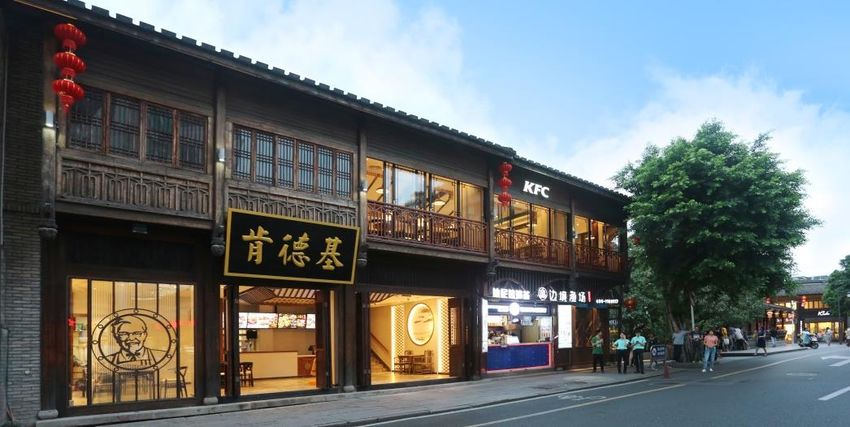
A Powerful Digital Ecosystem
                                                                       Super APP
                                                                                                                       KFC Mobile Pre-order

                           V-gold & merchandise

                                                                                                                                PH Mobile Tableside Order
Book Kingdom     K-Music
                                                              Broad
                                                         Customer Needs
            K -Run                                                                           Throughout
                                                                                              Customer                                        PH Online queuing
                                                                                               Journey

                                                     Various                                                                Member Program
 Dine-in
                                                    Occasions

                                                                                                                   Privilege Membership
           Home/Office Delivery

                                                                                                       My Wallet

                                                                              Free Wi-Fi   E Gifting

                                       KFC High Speed Train Delivery                                                                      ~80 mn app
                                                                                                                                          downloads
                                                                                                                                                                  7
2018 Investor Conference - November 2018
A Digital Pioneer in the Restaurant Industry
2018
 Q3                                   145 million+ KFC members     50 million+ Pizza Hut members

       40%+                               82%             44%              ~75%                       ~60%
           Digital                         Digital         Digital           Digital                    Digital
          Ordering                        Payment       Members Sales     GES Coverage                Media Spend
   (Mobile order + Online delivery)                                       (Guest Experience Survey)

                                                                                                                    8
2018 Investor Conference - November 2018
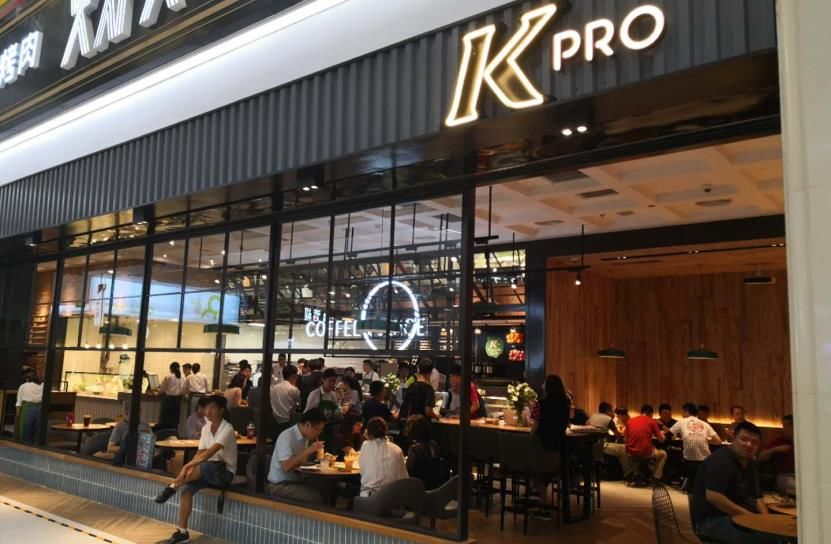
Privilege Subscription Program to
      Build Customer Loyalty and Increase Frequency

     Delivery            Breakfast               Coffee              Co-branded
     Privilege           Privilege              Privilege             Privilege

  ¥18 for 30 days       ¥18 for 30 days       ¥18 for 30 days        ¥38 for 60 days
 Waived delivery fee     Half price on    Medium size coffee @¥10   Privileges at KFC
(max 2 times per day)   selected items          (1 per day)             and iQIYI
                                                                                        9
2018 Investor Conference - November 2018
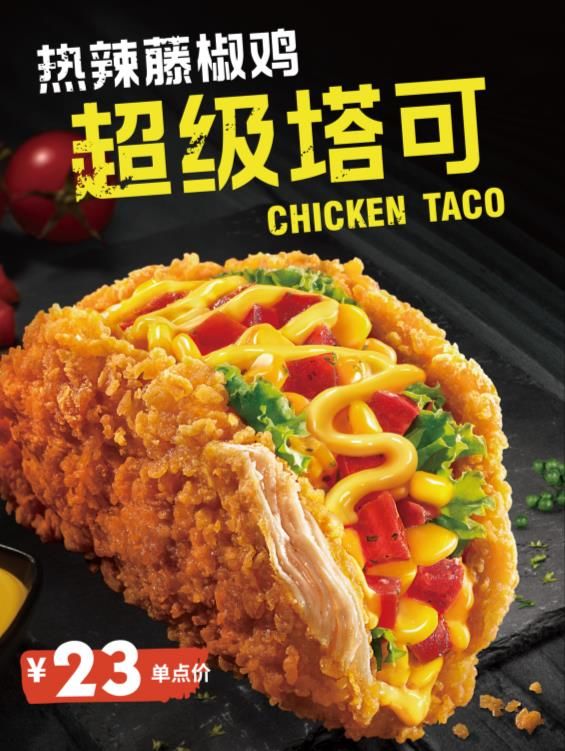
Integrating Physical Store and Digital Capabilities
                 to Enhance Customer Experience

KFC Hangzhou A.I. Town 杭州人工智能小镇店                              10
Product Innovation Differentiates KFC from Peers
  Couple            Chicken            Crazy
  Burger             Taco             Thursday

                                                   11
Build Dayparts and Product Categories to Drive SSSG

    Breakfast           Coffee             Dessert

                                                      12
Expand with Multiple Store Formats and Different Designs

                  Fuzhou (福州市三坊七巷)         Beijing (北京朝阳大悦城 )

                   Shanghai (上海曼克顿 )        Shenyang (沈阳龙之梦)
                                                                13
Refreshed Brand Identity for Pizza Hut

Pizza Hut’s New Identity:   ALWAYS SOMETHING NEW

                                                           14
Revitalization Program Focused on Four Pillars

    I. FIX     II. ENHANCE   III. OPTIMIZE   IV. EXPERIMENT
FUNDAMENTALS       DIGITAL      DELIVERY      NEW MODELS

                                                              15
Rapid Improvement in Digital and Delivery Capabilities
                                                                                               Delivery
                                                                                                  25%     of Company sales

                                                           In-store tableside
                                                            Mobile ordering                      97%      store coverage

                                                                                                  498     cities

Digital
  50mn+                  members

    43%                  members sales

   14mn                  brand app
                         downloads

Note: No. of members, app downloads and cities as of Q3 2018; other results for Q3 2018; All
YoY comparison stated in constant currency basis.
Reinforce Core Competencies and
                 Strengthen Value Perception

  Reinforce the Core                  Innovation on New Flavor         Improve Value Perception

 Thin Series           Air Series

    I. FIX                      II. ENHANCE            III. OPTIMIZE        IV. EXPERIMENT
FUNDAMENTALS                        DIGITAL              DELIVERY            NEW MODELS
                                                                                                  17
Innovative and Craveable Desserts & Drinks

    I. FIX     II. ENHANCE   III. OPTIMIZE   IV. EXPERIMENT
FUNDAMENTALS       DIGITAL     DELIVERY       NEW MODELS      18
Optimizing Portfolio with Remodels
                                and Multiple Store Formats

Nanjing Central Emporium, opened in Sep 2018

           I. FIX                       II. ENHANCE   III. OPTIMIZE   IV. EXPERIMENT
       FUNDAMENTALS                         DIGITAL     DELIVERY       NEW MODELS
                                                                                       19
Exploring New Coffee Concept - COFFii & JOY

                            Joycity, Hangzhou

                                                • New concept in 2018

                                                • 6 new stores as of Sep

                                                • Multiple store formats

IFC, Nanjing                                                            20
Accelerated New Store Openings with Healthy Return

                    New Stores YTD1                                     Store Mix in Tier 3-6                                    New Unit Return2

                       2016       2017      2018                        All Stores        New Stores YTD
                            562
                                                                               64%
                                                                        59%                                                                Tier 1-2   Tier 3-6
                     433
                                                                                                      45%              KFC                  ~2 yrs    ~2 yrs
               347                                 330                                         40%
                                            251
                                      212                                                                              Pizza Hut            ~3 yrs
Strong Cash Position

         Net cash from                                                                                                      Cash and short-
                                                                      Free cash flow
       operating activities                                                                                                term investments
                    Jan-Sep 2018                                              Jan-Sep 2018                                         As of Sep 30 2018

             $1.17 bn              $814 mn                 $1.53 bn
                 mn to leverage our strong cash flow to support business
             Continue
                                      growth and return values to shareholders
Note: Free cash flow is net operating cash flow less capital spending of $359 million; The Company subscribed Meituan Dianping shares for a consideration of $74mn in   22
September 2018
Higher Cash Dividends and
Expansion of Share Repurchase Authorization

            Dividends                             Share Repurchases

       2018 Q3: $38 mn                              2018 Q3: $94 mn
    2018 Jan-Sep: $115 mn                        2018 Jan-Sep: $167 mn
              Quarterly Cash Dividend ($)                   Total Authorization ($ mn)
                                0.12        Increase                             1,400
20%                                         share
increase                                    repurchase                  850
                   0.10
in cash                                     authorization
                                                              550
dividends                                   to $1.4 bn
                  Q1-Q3          Q4                           2017     2018      Total

                                                                                         23
Long-term YUMC Strategy:
Dynamic Brands Built on a Sustainable Platform for Growth

                                      SUSTAINABLE PLATFORM FOR GROWTH
                                          YUMC PORTFOLIO OF BRANDS:

                                        ENABLED BY 3D’s ACROSS BRANDS:

                          DIGITAL                     DATA                    DELIVERY

                                        CROSS FUNCTIONAL CAPABILITIES:
       HR    Finance   Supply Chain       Legal     Operation    IT      PA    Development   Marketing

                                         FOUNDER’s MENTALITY CULTURE

   Potential to grow to 20,000 stores over the long term, 2.5x today’s store base                        24
You can also read