2018 Update The Economic Impact of British Columbia's Dairy, Egg and Poultry Industries - BC Chicken Marketing Board
←
→
Page content transcription
If your browser does not render page correctly, please read the page content below
2018   The Economic Impact of
         British Columbia’s Dairy,
Update   Egg and Poultry Industries
Executive
Summary
British Columbia’s dairy, egg and
poultry farms and processing
industries are some of the most
successful agriculture sectors in
the province, adding almost $3
Billion dollars to BC’s economy,
employing 33,000 people and
contributing $666 million in
taxes. In total, British Columbia’s
supply managed dairy, poultry &
egg farms represent about 40%
of all farm cash receipts in BC.
Contents
Executive Summary
Background .  .  .  .  .  .  .  .  .  .  .  .  .  .  .  .  .  .  .  .  .  .  .  .  .  .  .  .  .  .  .  .  . 1
Methodology – Input/output Model .  .  .  .  .  .  .  .  .  .  .  .  . 3
Farm Level .  .  .  .  .  .  .  .  .  .  .  .  .  .  .  .  .  .  .  .  .  .  .  .  .  .  .  .  .  .  .  .  .  . 6
Dairy Farms  . . . . . . . . . . . . . . . . . . . . . . . . . . . . . . . . . . . 6
Poultry Farms . . . . . . . . . . . . . . . . . . . . . . . . . . . . . . . . . . 7
Hatching Egg  . . . . . . . . . . . . . . . . . . . . . . . . . . . . . . . . . . 7
Broiler Chicken, . . . . . . . . . . . . . . . . . . . . . . . . . . . . . . . . . 8
Turkey  . . . . . . . . . . . . . . . . . . . . . . . . . . . . . . . . . . . . . . . . 9
Table Egg . . . . . . . . . . . . . . . . . . . . . . . . . . . . . . . . . . . . . . 9
Food Processing in BC . . . . . . . . . . . . . . . . . . . . . . . . . 10
Downstream – Processing and Grading  .  .  .  .  .  .  .  . 11
Dairy . . . . . . . . . . . . . . . . . . . . . . . . . . . . . . . . . . . . . . . . . 11
Poultry Processing & Egg Grading . . . . . . . . . . . . . . . 12
Total Dairy, Egg & Poultry Industry .  .  .  .  .  .  .  .  .  .  .  .  . 13
Appendix One
BC Poultry & Egg Economic Impact . . . . . . . . . . . . . . 17
Appendix Two
BC Dairy Industry Economic Impact  . . . . . . . . . . . . . 19
References .  .  .  .  .  .  .  .  .  .  .  .  .  .  .  .  .  .  .  .  .  .  .  .  .  .  .  .  .  .  .  .  . 22
BC
Dairy,
Egg and
Poultry
Industries
The DEPI Report is an economic impact
report on the Supply Managed sectors in
British Columbia. This includes Dairy, Egg,
and Poultry Industries.

The Partnership
BC Dairy Association         BC Egg Marketing Board
3236 Beta Avenue             250 – 32160 South Fraser Way
Burnaby, BC V5G 4K4          Abbotsford, BC V2T 1W5
(604) 294-3775               (604) 556-3348
bcdairy.ca                   bcegg.com

BC Milk Marketing Board      BC Broiler Hatching Egg Commission
200-32160 South Fraser Way   180 – 32160 South Fraser Way
Abbotsford, BC V2T 1W5       Abbotsford, BC V2T 1Wt
(604) 556-3444               bcbhec.com
bcmilk.com
                              BC Turkey Marketing Board
BC Chicken Marketing Board   106 – 19329 Enterprise Way
101 – 32450 Simon Avenue     Surrey, BC V3S 6J8
Abbotsford, BC V2T 4J2       (604) 534-5644
(604) 859-2868               bcturkey.com
bcchicken.ca
Background
  BC Dairy, Egg and Poultry Industries (BCDEPI) is a        At the production level
  partnership formed on behalf of British Columbia’s        • Farmers receive a fair market price to assist
  five supply-managed industries. In BC, cow’s milk,          with business planning, cash flow and capital
  broiler hatching eggs, broiler chicken (chickens raised     investments.
  for meat), turkey, and table eggs (eggs produced for
  consumption), are regulated both provincially and         • Marketing boards enforce standards in areas
  federally under a system of supply management.              such as food safety and animal care using their
                                                              regulatory authority.
  What is supply management?
  Governments often use regulated marketing to help         • Because production is paired as closely as possible
  farmers match supply and demand and ensure                  to market demand production is not wasted.
  farmers receive a fair price. The government of
  British Columbia regulates the production and             At the processing level
  marketing of cow’s milk, broiler hatching eggs,           • Processors are assured volumes of production
  broiler chicken, turkey and eggs using a system             at regulated prices spread throughout the year to
  of supply management. Using import controls,                accommodate consumer demand.
  farm price controls and production controls,
  supply management stabilizes the market of these          At the consumer level
  products for farmers, processors and consumers.           • Consumers receive a steady supply and stable
                                                              prices of Canadian dairy, egg and poultry products.

                                                            • Consumers do not subsidize Canadian dairy, egg
What are the benefits of supply management?                   and poultry farmers through their taxes.
  Supply management benefits, farmers,
                                                            • Consumers can be assured that Canadian
  processors, consumers and local communities.
                                                              dairy, egg and poultry products meet industry
                                                              requirements for animal care and food safety.

                                                        1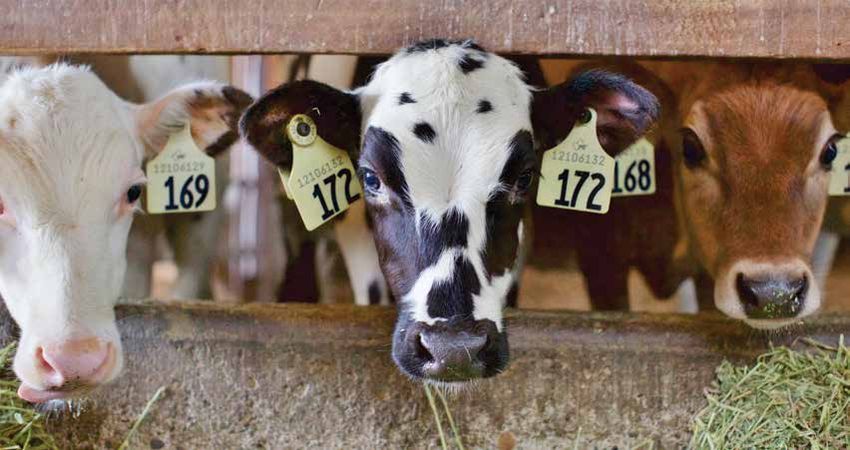
At the community level                                            At the federal level
• Supply management generates jobs and                            • Governments do not have to subsidize Canadian
  spending in local communities because market                      dairy and poultry farmers.
  stability better enables farmers to make
  investments to maximize efficiencies.                           At the international level
                                                                  • Trading partners can continue to trade with
• Similarly, farmers in the supply managed sectors                  Canada because supply management allows for
  in BC are continuously making investments                         imports. Canada imports 6% of the market for
  to maximize efficiencies and minimizing                           dairy products and more than 7.5% for chicken
  environmental impacts.                                            duty free1.

j In comparison, the USA gives 2.75 % access to their market for dairy products and the European Union gives 0.5% access for
poultry. The Canadian dairy industry imports ten times more cheese than it exports to the EU. Dairy Farmers of Canada website.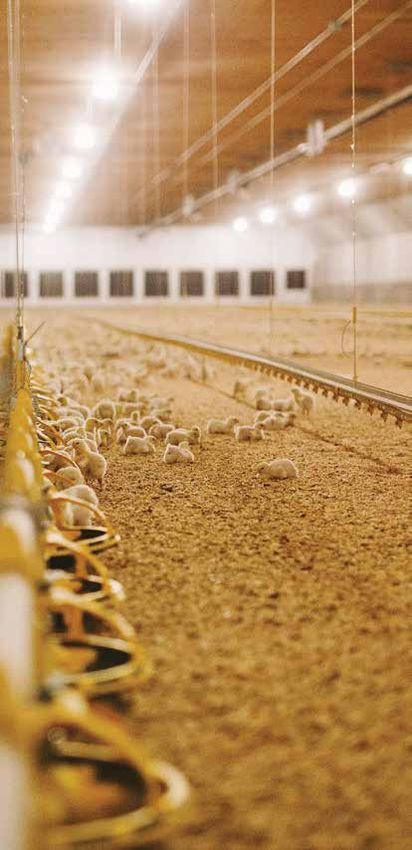
Methodology -
Input/output
Model
Statistics Canada’s “National Accounts Input-
Output Model” is used to demonstrate the
economic impact of the poultry and dairy sectors
on the BC economy. The model estimates the
economic activity generated by a given industry
as well as its suppliers. The model takes the
sales generated by the industry (direct effect)
to calculate the purchases the industry makes
from suppliers (indirect effects) and the wage
expenditures and activities generated by the
direct and indirect players (“induced” impact).

In the case of the BC supply managed farm
sectors, the direct industry represented are
the dairy and poultry farms, while the indirect
industries are those that supply the farms
such as the feed mills, animal health providers,
materials, equipment, and so on.

                                                   3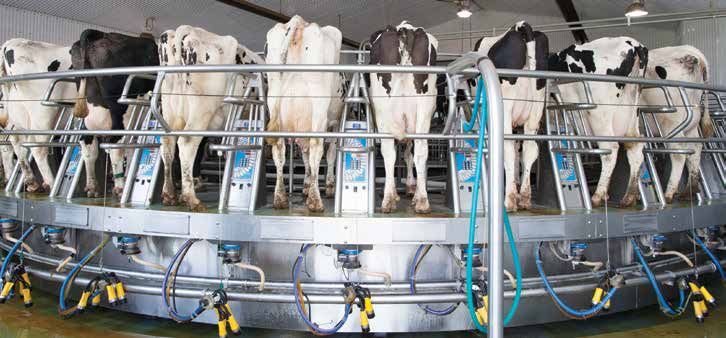
While the sales values are the Statistics Canada
    model inputs, for this report five outputs were
    assessed using 2015 sales data for dairy, poultry
    and egg industries:

      1. Farm Cash Receipts are the revenues received
         at the farm level for milk and dairy products,
         chickens, turkeys and eggs.

      2. GDP is defined as the value added
         contribution due to the economic activity
         generated by the specified industries.

      3. Jobs are the full time equivalent employment
         resulting from the industries.

      4. Taxes are the total federal, provincial and
         municipal taxes generated by the industries.

    In order to generate these output values, the
    Statistics Canada model contains “multipliers”
    for each of these factors. The multipliers are both
    provincial and national in scope and are applied
    to total provincial and national poultry sales. That
    is, the multipliers are applied to total sales for the
    industry to generate gross output, jobs etc. In
    other words, the multipliers generate the various
    components of the “economic impact.”

4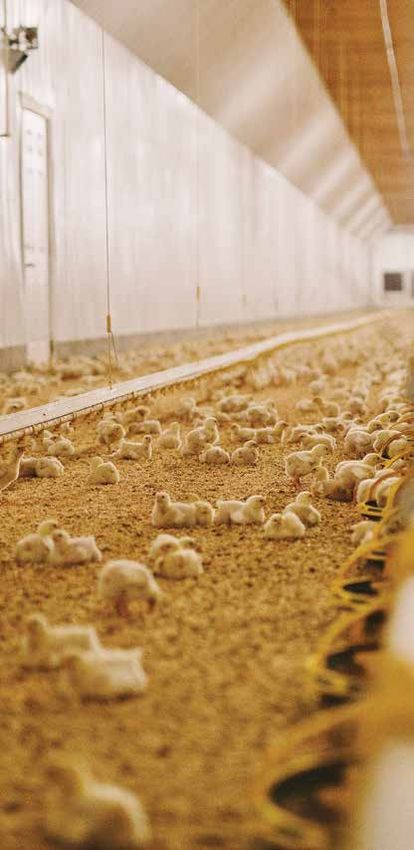
In 2009, 2011 and 2013, BC DEPI (BC’s Dairy, Egg,          egg, chicken, turkey and egg production and
and Poultry Industries) did their own economic             processing income data point for 2015. The basic
report. However, in recent years the national dairy        methodologies were similar and the key output
and poultry organizations began preparing similar          points of jobs, taxes and output were exactly the
economic impact reports. In order to be consistent         same. However, this version uses more specific
in our reporting, BC DEPI have adopted the approach        multipliers for the poultry industries rather than
done nationally for this report. The 2015 BC DEPI          generalized livestock multipliers. Accordingly,
economic impact results were generated through             the specific results are not directly comparable.
Statistics Canada multipliers for production and           Despite these minor differences, both reports clearly
for processing. There were provincial multipliers          demonstrate the critical importance and contribution
applied to each provincial dairy, hatchery, hatching       of the dairy and poultry sectors to the BC economy.

                                                       5
Farm Level Dairy Farms
Using Statistics Canada data from 2010 to 2015,
farm cash receipts on total GDP of dairy production
In 2015 the supply managed farms in BC had in BC increased 18% from 2013 to 2015, or an
combined revenues of $1.14 billion dollars, average of 8% per year. While the general number
representing 40% of all farm sales in British Columbia2. of dairy farms declined slightly, the over-all sector
economic contributions increased significantly.
From 2010 through 2015, the supply managed
Figure 6 Dairy industry value chain
farm revenue grew by 18%, which translates to
increasing job opportunities, provincial revenues
and overall contribution to the economic well-being
of British Columbia.
k Statistics Canada Cansim Table 002-0001
In 2015, there were 494 dairy farms in BC. Dairy farms
are relatively small, typically family run operations in
BC with an average herd size of about 135.
6British Columbia is the third largest dairy producing Poultry Farms
province in Canada, behind Quebec and Ontario. In 2015, there were 582 poultry farms in BC
Milk production on-farm is sent to processing with total farm cash receipts of approximately
facilities to be pasteurized and sold as fluid milk $572 million in 2015, which is about 14% of the
and cream or processed into other products, like Canadian total. Using Statistics Canada data
cheese and yogurt. The main products produced from 2010 to 2015, farm cash receipts of poultry
on a BC dairy farm are fluid milk for consumption products in BC increase from 406 Million in 2010
and industrial milk for processing. But the farm to $572 Million in 2015, an increase of 41%.
cash receipts of dairy products only tell part of the Poultry farms in BC include hatching egg, broiler
economic impact story. Typical dairy farms in BC chicken, turkey and table egg farms.
also sell culled cows for beef, dairy genetics, forage
crops, and custom work services. Eco Resources
have estimated the value of these sales in their BC Poultry Farms - 2015
calculation of the economic impact of dairy in BC.
Total All Sectors
According to Dairy Farmers of Canada research, Farm Cash Receipts $ 572 Million
for 2015, BC dairy farms contributed $678 million GDP $ 87 Million
to the Canada’s GDP, $104 million to taxes, and a
Jobs (Persons) 6,042
total 7,391 jobs to the BC economy.
Taxes $ 39 Million
BC Dairy Farms - 2015 Source: Statistics Canada and
Kevin Grier Consulting calculations
Total All Sectors
*Farm Cash Receipts $ 564 Million
**GDP $ 678 Million
Hatching Egg
Hatching egg farms, also known as “broiler
**Jobs (Persons) 7,391
breeder” are part of the supply chain for the broiler
**Taxes $ 104 Million chicken industry. These farms house hens and
roosters. The hens produce fertilized eggs that are
*Source: Statistics Canada. Farm Cash Receipts by Province
**Source: ÉcoRessources (2016) sent to a hatchery. When the eggs are hatched, the
chicks are shipped to broiler chicken farms.
7In 2015, there were 53 registered hatching egg Broiler Chicken
farms in BC, a decrease of 10% since 2010. Farm Broiler chickens are chickens raised for meat
gate sales were $42.8 million, which is about 15% purposes. In 2015, there were 332 registered broiler
of the Canadian total for hatching egg sales. chicken farms in BC, an increase of 2% since 2010.
The farm gate sales were $359 million representing
about 15% of Canada’s total broiler chicken sales.
Figure 21 BC hatching egg industry value chain
Figure 12 BC chicken industry value chain
8Turkey Table Egg
Turkeys are raised similar to broiler chickens for Egg farmers produce unfertilized eggs that are
meat. They share the poultry supply chain with graded and sold as whole eggs or are sent to a
chicken because they have the same hatcheries breaker for further processing. In 2015, there were
and processors. In 2015, there were 67 registered 128 table egg farms in BC, with farm cash receipts
turkey farms in BC, an increase of 5% since 2010. of $121.1 million, representing approximately 11%
The farm gate sales were over $49 million. of the Canadian total.
Figure 17 BC turkey industry value chain Figure 26 BC table egg industry value chain
9Food Processing in BC The food processing industry is a significant component of the British Columbia economy, on par with the wood products industry. The revenue of province’s food and beverage processing/manufacturing industry was $9.8 Billion in 2016, approximately 18 percent of the total provincial revenue from manufacturing. This sector employs 33,000 people of whom 10,500 are in dairy and poultry processing. Although supply management is a policy developed to provide stability at the farm production level, it also benefits processors. Without an assured supply of locally produced products at regulated prices and with strong import controls, British Columbia processors would find it difficult to compete with lower cost jurisdictions such as the United States of America where the government subsidizes farm products. Also, the supply management system ensures that each province receives an equitable share of the national production of dairy, poultry and egg products.
Downstream Components –
Processing and Grading
The downstream components of the supply managed sectors represent the complete industry from farm
through processing. Downstream components encompass processors, graders as well as all the associated
inputs into the industries that supply them, such as animal health, veterinary services, consultant services,
contractors, packaging and other materials. The processors and graders’ economic impact best represents
the total impact of the supply-managed sectors.

Dairy Processing
In 2015, British Columbia’s 59 dairy processors
contributed $831 million to Canada’s GDP, an
increased 12% since 2013. These processors
employed a total of 7,400 people, an increase of 5%
and tax revenues were $138 million, an increase of
12% since 2013.

 Dairy Processors - BC

                               Dairy Processing
 GDP                           $ 831 Million
 Jobs (Persons)                7,368
 Taxes                         $ 138 Million

 Source: ÉcoRessources

                                                   11
Poultry Processing and Egg
Grading
In 2015, British Columbia’s 70 poultry processing
and egg grading plants consisted of 15 chicken
processing facilities, 5 turkey processing
facilities, and 23 egg graders.
In total, BC’s poultry processing and egg
grading facilities add $313 million to BC’s GDP,
employing 3,713 people, contributing about
$104 million in taxes.
Poultry Processing And Egg Grading – BC
Processors
GDP $ 313 Million
Jobs (Persons) 3,173
Wages, Salaries & Benefits $ 201 Million
Taxes $ 104 Million
Source: Statistics Canada and KGMCA calculations
12Total Impact –
Farming and Processing
In 2015 British Columbia had over 1,000 dairy, Poultry & Egg
broiler chicken, hatching egg, table egg and The BC poultry and egg industry contributes
turkey farms with a combined farm gate sales $1,305 million to British Columbia’s economy,
of over $1.14 Billion dollars. Together with 129 employing 16,820 workers, and paying $425
processing plants, graders, hatcheries, they million in taxes.
add 2.8 Billion to the British Columbia’s GDP,
generating almost 33,000 jobs and contributing
Poultry Processing, Egg Grading and
over $675 million in taxes.
Total Industry - BC
Dairy Total All Sectors
The BC dairy industry contributes $1,509 million
GDP $ 1,305 Million
to British Columbia’s economy, employing 14,759
Jobs (Persons) 16,820
workers and pays $241 million in taxes.
Taxes $ 425 Million
Source: Statistics Canada and KGMCA calculations
Dairy Industry - BC
Total The contribution of the supply managed industry
GDP $ 1,509 Million is significant to many communities throughout
Jobs (Persons) 14,759 British Columbia. While most of British Columbia’s
Taxes $ 241 Million poultry and dairy industries are centered in the
Fraser Valley, Okanagan and Vancouver Island,
Source: ÉcoRessources supply managed dairy and poultry farms also
contribute to the economies in the Peace River,
Kootenays, Bulkley Valley and Cariboo regions.
13Supply Management Total Industry
Economic Impact - BC
Total All Sectors
GDP $ 2,814 Million
Jobs (Persons) 31,579
Taxes $ 666 Million
Source: Dairy data for BC was not available for 2010 so
2013 data was used.
Source: ÉcoRessources.
British Columbia’s supply managed sectors of
dairy, egg and poultry industries, processors,
egg graders and suppliers add $2.8 Billion to
British Columbia’s GDP, provide 33,000 full time
jobs and contribute $ 666 million in municipal,
provincial and federal taxes. The dairy and
poultry industries are two of the top farm
sectors in BC and are major contributors to the
provincial economy. The orderly marketing of
these products through supply management
allows these industries to thrive and grow at
levels meeting and/or exceeding provincial
averages. Supply management provides
stability to farmers, processors and consumers
and contributes to the economic and social
impact of local economies.Appendices
1516
Appendix One BC Poultry &
Egg Economic Impact
 Chicken Farming and Processing
Indicator/Region                                   British Columbia  Canada - Total
Farm Cash Receipts (Million $)                                 358.6       2,400.0
Number of Producers                                             328          2,803
Chicken Processing Plants (Federal and Provincial)               33            191
Contribution to total employment (Jobs)                      12,625         87,200
Contribution to GDP (Million $)                                979.0       6,762.1
Total Tax Revenues (Million $)                                 318.6       2,200.4

 Hatching Egg Farming and Processing
 Indicator/Region                                            British Columbia    Canada - Total
 Farm Cash Receipts (Million $)                                           42.8           290.4
 Number of Producers                                                        53             244
 Hatcheries (Federally Registered - broiler hatching eggs)                  10              40
 Contribution to total employment (Jobs)                                 1,429           8,447
 Contribution to GDP (Million $)                                          69.2           470.2
 Total Tax Revenues (Million $)                                           16.4           132.9

 Turkey Farming and Processing
 Indicator/Region                                            British Columbia    Canada - Total
 Farm Cash Receipts (Million $)                                          49.3            395.9

                                                    17
Number of Producers 67 535
* Turkey Processing Plants (Federal) 4 20
Contribution to total employment (Jobs) 1,758 14,301
Contribution to GDP (Million $) 137.0 1,112.0
Total Tax Revenues (Million $) 44.5 362.0
*Provincial plants excluded to minimize double counting with chicken processing plants
Egg Farming and Grading
Indicator/Region British Columbia Canada - Total
Farm Cash Receipts (Million $) 121.1 961.5
Number of Producers 134 903
Egg Graders (Federal and Provincial) 23 199
Contribution to total employment (Jobs) 2,166 17,600
Contribution to GDP (Million $) 168.0 1,365.1
Total Tax Revenues (Million $) 54.6 443.9
Amalgamated: Poultry Farming and Processing
Indicator/Region British Columbia Canada - Total
Farm Cash Receipts (Million $) 571.8 4,047.7
Number of Producers 582 4,485
Processing Plants, Graders and Hatcheries (Federal and Provincial) 70 450
Contribution to total employment (Jobs) 17,978 127,548
Contribution to GDP (Million $) 1,353.2 9,709.4
Total Tax Revenues (Million $) 434.1 3,139.3
*contribution to GDP in report was slightly less to avoid double counting of broiler hatching egg sector, which
is an input for the broiler industry.
Source: Kevin Grier Consulting. 2016. The Economic Impact of the Poultry & Egg Industries in Canada
18Appendix Two BC Dairy
Industry Economic Impact
Total impacts of the dairy industry, by province, 2013 and 2015
Prov Total GDP ($M) Total tax revenues ($M) Total jobs (FTE)
2013 2015 2013 2015 2013 2015
BC 1316 1509 15% 211 241 14% 14009 14759 5%
AB 2063 2030 -2% 372 364 -2% 16841 17743 5%
SK 429 413 -4% 70 66 -6% 4561 4805 5%
MB 642 582 -9% 100 88 -12% 7551 7955 5%
Source: Eco Resources. 2016. The Economic Impact of Canada’s Dairy Industry.
*Statistics Canada
**Totals may not add up because farm sales value has been discounted by rate of inflation from 2008-2015.
StatsCan says that should be done because the multipliers were for 2008.
1920
References
• BC Ministry of Agriculture. 2017. Sector
  Snapshot 2015: BC Agriculture.

• Eco Ressources. 2013. The Economic
  Impact of the Canadian Dairy Industry in
  2013. March 31, 2015.

• Eco Ressources. 2016. The Economic
  Impact of Canada’s Dairy Industry.

• Kevin Grier Consulting. 2016. The
  Economic Impact of the Poultry & Egg
  Industries in Canada.

• Statistics Canada. 2016. Farm Cash Receipts.

• Statistics Canada. 2016. Input-Output
  Model for estimating economic impact.
For further information go to:
                   depi.ca
You can also read


