2019-21 South Eastern Melbourne - Alcohol and Other Drug (AOD) Catchment-based plan
←
→
Page content transcription
If your browser does not render page correctly, please read the page content below
Data accuracy, integrity                                    The role of                                               Health promotion, prevention
Cross sector collaboration                              Service geography                                          Clients and community
                                 and application                                      local government                                             and community development

           January 2019              2019-21                                             South Eastern Melbourne
                                                                                     Alcohol and Other Drug (AOD)
                                                                                            Catchment-based plan

                                       Prepared by       on behalf of SECADA in collaboration with SURe

                                                                            SECADA and SURe acknowledge the support of the Victorian Government.
2019-21South Eastern Melbourne Alcohol and Other Drug (AOD) Catchment-based plan

2
Prepared by   on behalf of SECADA in collaboration with SURe

Executive summary
The south eastern Melbourne catchment is comprised               Participants in the above planning processes were also
of the Cities of Greater Dandenong and Casey, and                instrumental in manufacturing the actions featured in
the Shire of Cardinia. It is geographically sparse with a        the plan following. Actions have been crafted to effect
landscape that is nearly as diverse as its population. The       both micro- and macro-level change, ranging from those
catchment has an assortment of characteristics – from            targeting AOD services themselves; to collaborative work
vast differences in demography and socio-cultural profiles,      with other sectors and organisations, and community
to disparities in access to universal services, employment       action. As such, the plan is considered a plan for the
and education.                                                   community, and is intended to have utility for any
                                                                 individual, group or organisation whose path it intercepts.
State funded Alcohol and Other Drug (AOD) services in
south eastern Melbourne are provided by two consortiums          The plan has been endorsed by both SECADA and SURe
- South Eastern Consortia of Alcohol and Drug Agencies           consortia, and with this a commitment has been made to
(SECADA), with Windana as the lead agent; and Substance          the collaborative delivery of the actions herein.
Use and Recovery (SURe), led by EACH.
The South Eastern Melbourne Alcohol and Other Drug
(AOD) Catchment-based plan (the plan) has been prepared
by enliven on behalf of SECADA and SURe. Formulation of
the plan involved a dynamic and rigorous data collection
and stakeholder engagement process. This included:
assessment of client data; secondary data analyses;
qualitative consultation through focus groups and forums,
and administration of an online survey.
Outputs from the above processes were iteratively
synthesised together using inductive and deductive
techniques to identify six key priority areas requiring action
to address AOD-related harm:
∞∞ Cross sector collaboration
∞∞ Data accuracy, integrity and application
∞∞ Service geography
∞∞ The role of local government
∞∞ Clients and community
∞∞ Health promotion, prevention and community
   development

                                                                                                                                                                                     3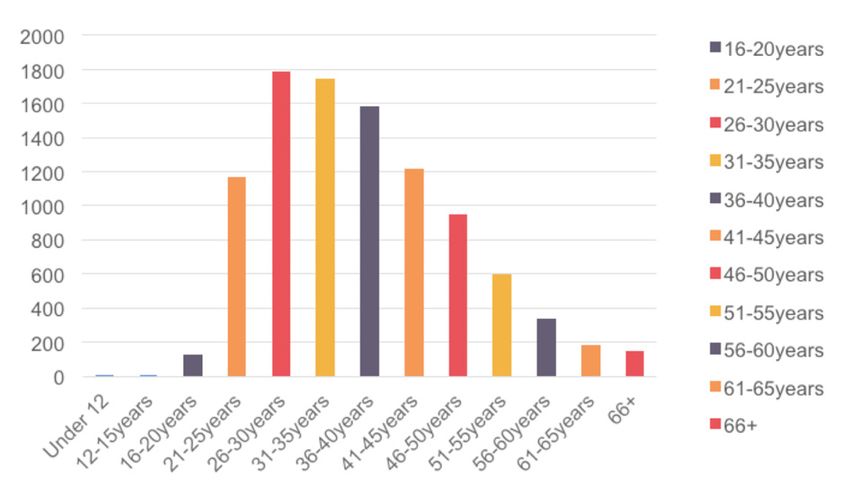
2019-21South Eastern Melbourne Alcohol and Other Drug (AOD) Catchment-based plan

    Acknowledgements
    On behalf of SECADA and SURe, enliven would like to thank the following people for   Representatives from the following organisations participated in consultations across the
    their participation in one or multiple of the consultation processes.                various platforms:

     Adele Poulus                Jacqueline McBride           Melissa Holmes                                                                          South Eastern Melbourne
                                                                                          Afri-Aus Care Inc             enliven
                                                                                                                                                      Primary Health Network
     Aisha Mahboob               Janet Schimleck              Mel Sacco
                                                                                          AMES Australia                Link Health and Community     SMRC
     Alaine Prime                Jennifer Furby               Merilyn Young
                                                                                                                        Monash Health Refugee
     Allen Curry                 Jenny Danielson              Mitchell Bowden             Anglicare (SURe)                                            Taskforce (SECADA)
                                                                                                                        Health
     Andrea Savarin              Jess Champan                 Myf Evans
                                                                                          City of Greater Dandenong     Monash Health (SECADA)        WAYSS Ltd
     Andrea Shepherd             Joanne Campos                Nigel Joseph
                                                                                          City of Casey                 Odyssey House (SECADA)        Windana (SECADA)
     Arun Kumaraswamy            John Riek                    Peter Meyer
                                                                                          Department of Health
                                                                                                                        Shire of Cardinia             YSAS Ltd (SECADA)
     Bill Wilson                 Julie Walters                Rachael Beckenham           and Human Services
     Carly Pickering             Kate Jeffery                 Ray Blessing                EACH (SURe)                   SECL
     Cassandra Dresner           Kay-Sheree Spurling          Rhonda Cumberland
     Chiedza Malunga             Kim Griffin                  Rob Koch
                                                                                         enliven would also like to acknowledge the 67 respondents who participated in the
     Cinzia Theobald             Lauren Zelunka               Rob Macindoe
                                                                                         anonymous online engagement survey.
     Dabessa Gemetal             Linda Watson                 Sam Bartholomeusz
     Darrell Hinga               Lisa Hooper                  Shelly Ogden
     Debra Alexander             Lisa Innes                   Sean Quigley
     Deborah Valentine           Lora Hares                   Teressa Ma
     Dirk Francke                Louise Cristofaro            Vanessa Smith
     Dona Macik                  Louise Richardson            Vicki Hawke
     Gayle Stapleton             Marianne Potter              Wasana Liyanage
     Irina Hart                  Mary Larkin                  Yvette Shaw
                                 Marama Kufi

                                                                                                                         SECADA and SURe acknowledge the
                                                                                                                        support of the Victorian Government.

4
Prepared by           on behalf of SECADA in collaboration with SURe

Contents
Background . . . . . . . . . . . . . . . . . . . . . . . . . . . . . . . . . . . . . . . . . . . . . . . . . . . . 6              Our plan - priority areas for action. . . . . . . . . . . . . . . . . . . . . . 21
Our catchment - the ‘where’ and ‘who’. . . . . . . . . . . . . . . . . . 7                                                                   Cross sector collaboration . . . . . . . . . . . . . . . . . . . . . . . . . . . . 21
     Local government profiles . . . . . . . . . . . . . . . . . . . . . . . . . . . . . . . . . . . 8
                                                                                                                                             Data accuracy, integrity and application . . . . . . . . . . . . 22
Our process - the ‘how’. . . . . . . . . . . . . . . . . . . . . . . . . . . . . . . . . . . . . . 9
     Data mining and analyses. . . . . . . . . . . . . . . . . . . . . . . . . . . . . . . . . . . . 9                                       Service geography . . . . . . . . . . . . . . . . . . . . . . . . . . . . . . . . . . . . 23
     Stakeholder consultation . . . . . . . . . . . . . . . . . . . . . . . . . . . . . . . . . . . 10
                                                                                                                                             The role of local government . . . . . . . . . . . . . . . . . . . . . . . .  24
Our needs - the ‘why’ . . . . . . . . . . . . . . . . . . . . . . . . . . . . . . . . . . . . . . . 12
     Social determinants of drug use. . . . . . . . . . . . . . . . . . . . . . . . . . . . 12                                               Clients and community . . . . . . . . . . . . . . . . . . . . . . . . . . . . . . . 25
           Socio-economic disadvantage. . . . . . . . . . . . . . . . . . . . . . . . . . . . . . . .                        12
           Education . . . . . . . . . . . . . . . . . . . . . . . . . . . . . . . . . . . . . . . . . . . . . . . . . . .   13              Health promotion, prevention
           Housing and homelessness. . . . . . . . . . . . . . . . . . . . . . . . . . . . . . . . . . .                     13              and community development . . . . . . . . . . . . . . . . . . . . . . . . 26
           Gambling. . . . . . . . . . . . . . . . . . . . . . . . . . . . . . . . . . . . . . . . . . . . . . . . . . . .   13
           Family violence. . . . . . . . . . . . . . . . . . . . . . . . . . . . . . . . . . . . . . . . . . . . . .        13   Appendicies. . . . . . . . . . . . . . . . . . . . . go to https://www.secada.org.au/
           Health literacy . . . . . . . . . . . . . . . . . . . . . . . . . . . . . . . . . . . . . . . . . . . . . . .     13
     AOD use and outcomes. . . . . . . . . . . . . . . . . . . . . . . . . . . . . . . . . . . . . . 15
           Client and substance profile. . . . . . . . . . . . . . . . . . . . . . . . . . . . . . . . . . 15
           Our needs . . . . . . . . . . . . . . . . . . . . . . . . . . . . . . . . . . . . . . . . . . . . . . . . . . . 16
           Community and stakeholder concerns. . . . . . . . . . . . . . . . . . . . . . . . 17

Our priorities - the ‘what’ . . . . . . . . . . . . . . . . . . . . . . . . . . . . . . . . . . 18
           Governance and working group structure. . . . . . . . . . . . . . . . . . . . . 18
           A note about our approach to the planning cycle. . . . . . . . . . . . . . 19
           A note about scope. . . . . . . . . . . . . . . . . . . . . . . . . . . . . . . . . . . . . . . . . . . 19

                                                                                                                                                                                                                                            5
2019-21South Eastern Melbourne Alcohol and Other Drug (AOD) Catchment-based plan

    Background
    In Victoria, state funded Alcohol and Other Drug (AOD)                         “Catchment-based planning          As the lead agency for SECADA, Windana has led the
    services are delivered by catchment-based consortia with                       is undertaken by a single          preparation of this plan in partnership with SECADA
    funding from the Victorian Government Department of                                                               consortium partners (Monash Health, Odyssey House,
                                                                                   provider on behalf of, and in
    Health and Human Services (DHHS). The south eastern                                                               Taskforce, and YSAS); and the SURe consortium (EACH,
    Melbourne catchment is comprised of the Cities of Greater
                                                                                   partnership with all alcohol and   Anglicare and YSAS).
    Dandenong and Casey, and the Shire of Cardinia. The                            other drug services operating
                                                                                   in the catchment and a range       The plan is a roadmap for use by not only SECADA and
    consortia delivering AOD services in the catchment are:
                                                                                                                      SURe but also other local providers and community
    South Eastern Consortium of Alcohol and other Drug                             of stakeholders, including the
                                                                                                                      groups in identifying and addressing critical service gaps
    Agencies (SECADA), and Substance Use and Recovery                              department.                        and pressures; as well as cultivating opportunities for
    (SURe). A key responsibility of catchment-based consortia
                                                                                                                      prevention, harm minimisation and early intervention, in a
    is to develop a localised plan for their region.                               The primary purpose of             coordinated way.
                                                                                   the planning function is to
                                                                                   assist alcohol and other drug      “The AOD catchment-based planning process
                                                                                                                      is an important step toward understanding the
                                                                                   providers operating in a given     various and discrete needs of our catchment
                                                                                   catchment to develop a regular     - south eastern Melbourne. SECADA, in
                                                                                   common plan which will             conjunction with the SURe consortium have
                                                                                   identify critical service gaps     worked closely with enliven to identify the
                                                                                   and pressures, and strategies      specific needs of our communities and how
                                                                                   to improve responsiveness          best to address them.
                                                                                   to people with alcohol and         As a result of an extensive consultation
                                                                                   other drug issues (particularly    and development phase involving multiple
                                                                                   people facing disadvantage),       agencies, community members and specific
                                                                                   population diversity and broader   groups we are proud to commend this
                                                                                                                      comprehensive catchment-based plan (2019-
                                                                                   community need.
                                                                                                                      21) for the south east region of Melbourne.
                                                                                                                      This plan identifies six key areas and will
                                                                                   The plan provides a basis          form the basis of our focus for the next three
                                                                                   for improved cross-service         years.”
                                                                                   coordination at the catchment
                                                                                   level to achieve a more planned,
                                                                                                                      Executive Officer - SECADA and Team Leader - SURe
                                                                                   joined-up approach to the needs
    1    Victorian Government Department of Health and Human Services (2018).      of individual clients.”1
        Alcohol and Other Drugs - Catchment-based planning. Retrieved 7 January,
        2019 from https://www2.health.vic.gov.au/alcohol-and-drugs/aod-service-
        standards-guidelines/aod-program-guidelines/catchment-based-planning-
        guide-aod

6
Prepared by              on behalf of SECADA in collaboration with SURe

Our catchment - the ‘where’ and ‘who’
Comprising of Greater Dandenong, Casey and Cardinia,
the south eastern Melbourne (SEM) catchment covers
1, 821km2. Owing to several socio-demographic
characteristics that are outlined in more detail below,
SEM’s population is relatively transient and therefore
published figures are often considered under-estimations of
the exact size. However according to most recent Census
data, the population is rapidly approaching 600,000 people
across the catchment, with the highest concentration in
Casey (326,820), followed by Greater Dandenong (164,148)
and lastly Cardinia (102,425).2
Interestingly, when compared to its south eastern
Melbourne counterparts, Cardinia Shire recorded the
highest growth rate (5.5%) in 2015-16, named the 6th
fastest growing municipality in the country and the 3rd
in Victoria. This rate was followed closely by Casey which
also recorded a staggering rate (3.8%) making it the 12th
fastest growing municipality in Australia, and the 6th in
Victoria.3
Although service availability per capita
is relatively comparable to other areas of
Victoria, for many reasons outlined later,
large portions of the population remain un-
or under-serviced. This is compounded by
the fact that SEM has some of the highest                                                                                                                                                City of Greater Dandenong
rates of AOD-related harm in the state.                                                                                                                                                  City of Casey
                                                                                                                                                                                         Shire of Cardinia

                                                              2   Australian Bureau of Statistics (2016). Census Community Profiles. Retrieved 7 December, 2018 from http://www.abs.gov.au/websitedbs/D3310114.nsf/Home/2016%20
                                                                  Census%20Community%20Profiles
                                                              3   Australian Bureau of Statistics (2016). Regional Population Growth. Retrieved 7 December, 2018 from https://blog.id.com.au/2017/population/population-trends/
                                                                  australias-top-20-fastest-growing-areas/

                                                                                                                                                                                                                                  7
2019-21South Eastern Melbourne Alcohol and Other Drug (AOD) Catchment-based plan
Our catchment - the ‘where’ and ‘who’
Local government profiles
City of Greater Dandenong City of Casey Shire of Cardinia
The City of Greater Dandenong The City of Casey is described The Shire of Cardinia, another
(CGD) is famous for its diversity. as an ‘Interface Council’ as it is interface Council, is the largest
Following the 2016 Census, comprised of both agricultural/ of SEM’s municipalities in
it was re-crowned the most low-density localities and terms of land mass. Most
multicultural municipality in urban expansion. It bridges Cardinia residents live through
Australia, with residents from the gap between metropolitan the ‘growth corridor’ suburbs
over 150 different birth places. Melbourne and rural Victoria, of Beaconsfield, Officer
bringing with it both urban and rural characteristics.5 and Pakenham – which make up merely 10% of the
municipality’s total land area.7
Casey has a significantly
young population when This trend is expected to continue with predictions that by
compared to the rest of 2020, 66% of Cardinia’s population will reside in this area
Victoria, with almost one of growth.8 The challenge is to balance the resulting need
quarter (22.6%) under the for additional services, facilities and other infrastructure
Just over half (52%) of CGD’s residents were born in countries age of 14, compared to the with the needs of existing communities in other more rural
where English is not the main spoken language, resulting in state average of 18%. Not areas of Cardinia.
one in seven having ‘limited fluency’ in spoken English. surprisingly Casey also has much fewer residents in the 55
Not surprisingly given
and over age groups – 19.2% compared to an average of
Similarly, in 2017 more people Cardinia’s sparsity,
27% across Victoria.
seeking asylum were recorded to the vast majority of
be residing in CGD than in any Casey also has a large population of residents who identify residents are required
other municipality in the country. as Aboriginal and/or Torres Strait Islander, with the third to travel some distances to work/school. Large numbers of
highest number across Cardinia residents travel to work by car (77% compared to
CGD’s diversity is also reflected
metropolitan Melbourne.6 68% across Victoria), while few travel by public transport
in the variety of faiths that its
or active travel (5.7% compared to 12.6% across Victoria).9
residents subscribe to and there
are over 100 places of worship
7 Cardinia Shire Council (2017). Cardinia Shire’s Liveability Plan 2017 – 2029.
across the municipality.4 Retrieved 19 December, 2018 from https://www.cardinia.vic.gov.au/
Chrisitianity
Buddhism
Islam
Hinduism
downloads/download/536/cardinia_shire_s_liveability_plan_2017-29
8 Cardinia Shire Council (2018). 2018 – 19 Council Plan and Actions. Retrieved
5 Interface Councils (2016). Creating Liveable Communities in the Interface. 19 December, 2018 from https://www.cardinia.vic.gov.au/info/20007/your_
Retrieved 7 December, 2018 from http://www.lgam.info/social-planners- shire_and_council/177/our_budget_and_council_plan#section-3-previous-
network budgets
4 City of Greater Dandenong (2017). Community Wellbeing Plan. Retrieved 28 6 Australian Bureau of Statistics (2016). City of Casey Community Profile. 9 Australian Bureau of Statistics (2016). Shire of Cardinia Quickstats. Retrieved
December, 2018 from http://www.greaterdandenong.com/document/26182/ Retrieved 28 December, 2018 from https://profile.id.com.au/casey/ 28 December, 2018 from http://quickstats.censusdata.abs.gov.au/census_
community-wellbeing-plan indigenous-keystatistics?BMID=40 services/getproduct/census/2016/quickstat/LGA21450
8
Prepared by   on behalf of SECADA in collaboration with SURe

Our process - the ‘how’
In August 2018, Windana as the lead agency for the SECADA
consortium engaged enliven on behalf of SECADA and SURe
to conduct the planning, monitoring and review functions for
the AOD catchment-based plan in south eastern Melbourne.
In consultation with the Governance Group, enliven
established, designed and executed a rigorous and dynamic
stakeholder engagement and data collection process.
Recognising the variable socio-demographic characteristics
of the catchment, enliven ensured this process was not
only multi-modal but also iterative, with each stage being
informed by the previous.

Data mining and analyses
Insights relating to the profile of local AOD service clients
were gleaned from the Client Information Management
System (CIMS) in use at SECADA (Episoft). The findings are
summarised below, and more information is available in
Appendix B (online).
Additional data sources were also appraised in pursuit of a
more complete understanding of AOD related issues in the
catchment including those experienced by people who are
not currently being serviced, or whom are accessing non-
consortium services.
Additional data sources included:
∞∞ ABS, Census of Population and housing
∞∞ Public Health Information Development Unit.
   Social Health Atlas of Australia
∞∞ Turning point AOD Stats
∞∞ Victoria Crime Statistics Agency (CSA)
∞∞ Victorian Child and Adolescent Monitoring System (VCAMS)
∞∞ PBS data - Ambulance Victoria
∞∞ VicHealth Indicators 2015 Survey

                                                                                                                               9
2019-21South Eastern Melbourne Alcohol and Other Drug (AOD) Catchment-based plan

     Our process - the ‘how’
     Stakeholder consultation                                        1. Discovery forum – service provider                            3. Solutions forum – service provider
                                                                        forum (Wednesday 31 October 2018)                                forum (Thursday 6 December 2018)
     For the purposes of this plan, a broad definition to the
     term ‘stakeholder’ was adopted. In essence, enliven sought      Attended by 14 representatives from                              Attended by 20 representatives
     to engage with anyone in the south eastern Melbourne            organisations both within and exterior                           from organisations both within and
     catchment that has an interest and the capacity to input in     to the AOD service system. Several                               exterior to the AOD service system,
     the planning process - from organisations both inside and       explorative activities were facilitated                          including many return attendees
     exterior to the AOD service system; to existing or past         to discover key issues, insights and                             from the Discovery forum. Findings
     clients of AOD services and their families and friends; to      opinions. During post-forum analyses                             from the Discovery forum and the
     community members more broadly.                                 six key themes emerged, particularly                             CALD community focus group were
                                                                     regarding areas of opportunity for                               presented. This was followed by
     As a result of the relatively tight timelines, recruitment      development in catchment-based planning.                         facilitated activities to identify and collaboratively prioritise
     was largely conducted by convenience sampling and a small                                                                        key objectives and areas for action.
                                                                     See Appendix B (online) for full report.
     social marketing campaign through enliven’s network. As
     such, it should be acknowledged, that although enliven
                                                                     2. Storming and forming – CALD                                   4. Online engagement survey
     was indeed able to engage with all the above groups, the
                                                                        community focus group
     participant sample could not be considered representative of                                                                     On Monday 26 November 2018, an
                                                                        (Thursday 22 November 2018)
     the overall catchment. In particular, consultation with AOD                                                                      electronic survey was distributed
     clients was minimal, however this deficit was acknowledged      The most recent evaluation of                                    through a variety of online
     and now features as a key priority area for action within the   SECADA services highlighted                                      channels, with the intention of
     plan.                                                           insufficient participation by                                    capturing the voice of those
                                                                     community members from                                           who were unable to participate in
     More information on each component of the multi-modal
                                                                     Culturally and Linguistically Diverse                            face-to-face consultations. The
     stakeholder consultations described below can be found in
                                                                     (CALD) backgrounds, in all aspects                               survey was designed to mirror the process of the other fora,
     the Appendices.
                                                                     of service delivery, planning and                                whereby respondents were first prompted to explore issues
                                                                     decision-making. As such, concerted efforts were made to         and areas of concern relating to AOD in their community/
                                                                     engage with these cohorts, particularly those of African         organisation/client-base. Following this they are encouraged
                                                                     descent, in the development of the plan.                         to identify areas of possible action and to provide ideas or
                                                                                                                                      solutions that they envisage would have an impact on AOD
                                                                     As such, this focus group was attended by 6 community
                                                                                                                                      related harm.
                                                                     members from the following cultural backgrounds: Sri
                                                                     Lankan (n=1), Afghan (n=1), South Sudan (n=1), Ethiopia          The survey was completed by 67 respondents. 52% of
                                                                     (n=2), and Zimbabwe (n=1). A variety of ‘storming’ activities    all respondents were representatives from organisations
                                                                     were co-facilitated to first identify issues that local          that provide non-AOD services to people in south eastern
                                                                     communities face in relation to AOD. This was followed           Melbourne. Nineteen (29%) respondents described
                                                                     by ‘forming’ activities that sought to identify and prioritise   themselves as representatives from AOD service providers,
                                                                     potential solutions. See Appendix (online) C for full report.    with the rest of the respondents comprised of:

10
Prepared by on behalf of SECADA in collaboration with SURe
Our process - the ‘how’
∞∞ lay community members (14.5%) ∞∞ A set of objectives and associated indicators, as well as “Denying access to good quality
∞∞ family members of friends of people who have an a raft of specific and measurable actions that are to be data to any community is
addressed in the first year
AOD related problem (3%) actually denying them a human
∞∞ AOD clients themselves (1.5%) ∞∞ A range of presently relevant priority areas that are likely right, because you can’t know
to be addressed in either the second or third year but
See Appendix D (online) for full report. whether you are being treated
have not been prescribed specific actions at this stage
5. Broader sector consultations to enable optimal responsivity to local needs as they
fairly in a society, unless you
change over the life of the plan. have a measure of fairness”
Additional opportunities were sought
to further expand engagement and Professor Papaarangi Reid
consultation where possible with
existing groups.
∞∞ Focus group with SECADA staff
(n= 28) conducted on Tuesday 4
December 2018 at staff meeting.
Insights from the Discovery forum, CALD community
focus group and early findings from the online
engagement survey were presented. The team provided
verification or rebuttal of themes and findings in line
with their perspectives as client-facing staff.
∞∞ Focus group with enliven-led Community Strengthening
Task group. This Community of Practice (COP) is
comprised of (n=10) representatives from health,
humanitarian and social welfare organisations – those
primarily working with refugees, people seeking asylum
and other migrants. As such, the COP were able to further
articulate the barriers, challenges and issues experienced
by the communities they support.
The iterative and reflexive approach for both data mining
and stakeholder consultation process, was transferred into
the formulation, structure and intended use of this plan. As
such, this plan seeks to outline a living, working roadmap
that includes the following:
∞∞ An overall vision and set of locally relevant goals for
AOD services in south east Melbourne
112019-21South Eastern Melbourne Alcohol and Other Drug (AOD) Catchment-based plan
Our needs - the ‘why’
Figure 1. Face the facts A number of areas of expressed need emerged during data
analysis, consultation and planning processes, which are
further explained below.
The social determinants of drug use
Social determinants of drug
In 2016-17, the SEM catchment recorded 8.4% use
high rates of low income, welfare 9.8% 10.3% State average
dependent families compared to 13.6% Casey Cardinia Victoria
the state average of 8.4%. CGD Socio-economic disadvantage10
Socio-Economic Indexes for Areas (SEIFA) are a set of
CGD ranks the 2nd highest in the state
32.8%
geographical based indexes developed by the Australian
in measures of socio-economic Bureau of Statistics to rank areas according to advantage
FOR disadvantage with a score of 896.
RENT and disadvantage. A lower score correlates with a higher
of familes in CGD (lower score = higher disadvantage)
level of disadvantage and vice-versa. The Victorian average
experience rental stress (where rent is
greater than 30% of total household income). 1st SEIFA Index is 1010.
2nd Indexes for both the Cities of Greater Dandenong
3rd and Casey rank below this average at 896 and 1004
Expenditure on electronic gaming respectively. As reflected in Figure 1, the Index for CGD is
$609
PER ADULT
machines in SEM is well above the state
average with $609 spent per adult, compared to
CGD
CENTRAL
GOLDFIELDS
SHIRE
CITY OF
BRIMBANK
the second lowest in the state.
The SEM catchment also have high rates of
$532 across Victoria. CGD recorded the highest
with $927 per adult.
896 889 921 unemployment, with all three local government areas
recording rates that are higher than the state average of
5.9% of the population.
18.2% 10.6%
Mortgage stress CGD and Casey both ∞∞ City of Greater Dandenong – 12.4%
(where mortgage consistently record
of familes in CGD of familes in Cardinia payments are greater family violence ∞∞ City of Casey – 8.0%
than 30% of total rates that are higher
13.5% 10.2%
∞∞ Shire of Cardinia – 7.0%
household income), is than the state average.
experienced at a higher 2017-18, 1458.4 incidents Not surprisingly, as a result of high unemployment rates,
of familes in Casey of familes across Vic. rate by families in the per 100,000 population experiences of financial stress are also significant across
were recorded in CGD,
followed by 1284 in Casey
Health Literacy (Victorian average -
1176.7). 8.4%
A 2016 study conducted by the Ophelia project found that Cardinia and CGD residents have 9.8% 10.3% State average
overall poorer health literacy than those in other southern metro Melbourne LGAs: 13.6% Casey Cardinia Victoria
Stonnington, Port Phillip, Bayside, Glen Eira, Kingston, Casey, Frankston and Mornington Peninsula. CGD
12Prepared by on behalf of SECADA in collaboration with SURe
Our needs - the ‘why’
south eastern Melbourne. In Victoria, 8.4% of families are Similarly, experiences of both mortgage and rental stress them which might include
considered ‘low income, welfare dependent’. All three local are also notably higher across south eastern Melbourne. prevention and health
government areas in the SEM catchment have rates that With all three local government areas seeing rates promotion messages, or
are higher than this. particularly of mortgage stress that are significantly higher similarly may contain critical service information.
than the state average of 10.2%.
∞∞ City of Greater Dandenong – 13.6% A study conducted in 2016 by the Ophelia project
∞∞ City of Greater Dandenong – 18.2% across the ten southern metropolitan Melbourne local
∞∞ City of Casey – 10.3%
∞∞ City of Casey – 13.5% government areas highlighted that across all the nine
∞∞ Shire of Cardinia – 9.8% measures Cardinia had higher proportions of people
∞∞ Shire of Cardinia – 10.6%
reporting difficulty than the overall sample. CGD also had
Education Gambling higher scores for five of the measures.
Lack of education is both a consequence of, and a Spending (losses) on electronic
$609
reinforcing factor for socio-economic disadvantage. All gaming machines in south eastern
three local government areas in the SEM catchment record Melbourne is well above the state PER ADULT
high rates of ‘early school leavers’ – people who left school average with a median expenditure of
at or before year 10 as indicated by an Age-Standardised $609 per adult per year, compared to
Rate (ASR) per 100. SEM’s rates are notably higher than $532 across Victoria. CGD recorded
Victoria ASR of 26.0.11 the highest with $927 spent per adult in 2017-18.13
∞∞ Shire of Cardinia – 33.8
Family violence
∞∞ City of Greater Dandenong – 32.9 10 PHIDU (2017). Social Health Atlases of Australia: Local Government Areas.
∞∞ City of Casey – 30.7 In the 2017-18 financial year, Retrieved 3 January, 2019 from http://www.phidu.torrens.edu.au/social-
health-atlases/data#social-health-atlases-of-australia-by-socioeconomic-
both CGD and Casey saw rates of disadvantage-of-area
Housing and homelessness family violence that were notably 11 PHIDU (2017). Social Health Atlases of Australia: Local Government Areas.
Retrieved 3 January, 2019 from http://www.phidu.torrens.edu.au/social-
higher than the state average of health-atlases/data#social-health-atlases-of-australia-by-socioeconomic-
In 2016, the rate of homelessness 1,176.7 per 100,000 population. disadvantage-of-area
(number per 10, 000 population) The rates of 1,458.4 and 1,284.4 12 Australian Bureau of Statistics (2016). Victorian Homelessness Data –
Homelessness rates per 10, 000. Retrieved 3 January, 2019 from https://
in Victoria was 41.9, an increase respectively not only ranked asdfresearch.com.au/wp-content/uploads/2018/03/Homelessness-by-
of 1% since the data was the second and third highest among the ten southern LGA-2016.xlsx
13 Victorian Commission for Gambling and Liquor Regulation (2018). LGA
previously reported in 2011. Not metropolitan but were also among the highest in the state.14 population density and gaming expenditure statistics. Retrieved 3 January,
only are CGD and Casey rates of 2019 from https://www.vcglr.vic.gov.au/resources/data-and-research/
gambling-data/population-density-and-gaming-expenditure
homelessness higher than the average at 127.7 and 42.8 Health literacy 14 Crime Statistics Agency (2018). Family incident by Local Government Area.
respectively, but the growth rate in the SEM catchment far Retrieved 3 January, 2019 from https://www.crimestatistics.vic.gov.au/family-
‘Individual Health literacy’ refers to one’s ability to find, violence-data-portal/family-violence-data-dashboard/victoria-police
exceeds the average growth across Victoria. Since 2011, the interpret and use health information and services, to make 15 Nuteam, D (2000). Health literacy as a public health goal: a challenge for
rate of homelessness has increased 20% in Cardinia, 16% in contemporary health education and communication strategies into the 21st
choices about their health and health care.15 It impacts century. Health Promotion International. Retrieved 3 January, 2019 from
Casey, and 14% in CGD.12 the way people understand information that is given to https://academic.oup.com/heapro/article/15/3/259/551108
132019-21South Eastern Melbourne Alcohol and Other Drug (AOD) Catchment-based plan
Our needs - the ‘why’
Figure 2. Face the facts
AOD use and outcomes in SEM
AOD-related presentations by 8.3% of residents in Cardinia
Opioids 5.7%
CGD residents per 10, 000 consume alcohol a levels Alcohol
40.4%
population at Emergency considered ‘high-risk’ Ice 11.9%
Departments are almost (eleven drinks or more on a Primary drug
double state averages. single occasion).
Alcohol - 22.5 (Victorian average of concern Cannabis 12.8%
- 13.8) Illicit drugs - 3.9 (Victorian
average - 2.1) The average rate of hospitalisation
AOD-related ambulance attendance per 10,000
rates in CGD per 100, 000 population are population for both
notably higher than state averages. ‘cannabis’ and
Alcohol - 417.5 (Victorian average - 301.1) ’other stimulants’ 2014-15 2017-18 Aboriginal & Torres
Illicit drugs - 280.8 (Victorian average - 179.6) have more than Strait Islanders
doubled across 4.75 13.3
the entire SEM 2.81% of SECADA clients
$45 $91
catchment in 3
In the City of Casey... years. 4.5 14.5 0.49% of total SEM population
Victorian
average
...the average expenditure on alcohol in licensed premises
(in the past 7 days) is double the state average.
City of
Casey
70% Over two-thirds
(70%) of SECADA
clients are male.
73/100
The top three most common reasons for the score of 73 were:
1
The obvious harms to ‘individuals’ health
and wellbeing, but also the ripple effects Consultation &
on their families and communities.
Engagement
Level of concern
Online consultation participants
2 Decreased levels of
community safety
(real and perceived),
All forms of consultation
have emphasised the
importance of ‘engaging
rated an average score of 73, and increased violence. with SEM’s CALD
when asked to rate their ‘level communities’ in
96.37% of SECADA clients were recorded
3
of concern’ about alcohol and Availability and both service delivery and
Current SECADA client profile as English-speaking, which does not match
drugs in south eastern Melbourne. accessibility of services. prevention and health
the cultural diversity of the SEM catchment.
14Prepared by on behalf of SECADA in collaboration with SURe
Our needs - the ‘why’
AOD use and outcomes clients reside in the below postcode areas: ∞∞ In recognition of the cultural diversity within south
∞∞ 3175 - 12.97% eastern Melbourne, and the disproportionate impact
Spooner and Hetherington (2004)16 emphasise the (Dandenong, Dandenong South, Dandenong East, that the social determinants of drug use have on
significant impact that the social determinants of health Dandenong North, Bangholme, Dunearn) some cultural groups, a concerted effort was made to
namely the social, cultural, economic and physical understand the representation of these groups within the
∞∞ 3977 - 10.05%
environments have on either reducing or heightening the (Cranbourne, Cranbourne East, Cranbourne North, client profile. Insights relating to Aboriginals and Torres
risk of individuals using drugs. Cranbourne South, Cranbourne West, Botanic Ridge, Strait Islanders, as well as Culturally and Linguistically
The authors conclude that treatments targeting individuals Cannon’s Creek, Sandhurt, Skye, Devon Meadows, Diverse (CALD) groups are summarised below.
can only have a partial impact if the social determinants of Junction Village)
Aboriginal and Torres Strait Islander clients
drug use behaviour are not acknowledged and addressed as ∞∞ 3810 - 7.97%
part of the solution. (Pakenham, Pakenham Upper, Pakenham South, According to the 2016
Rythdale) census 2,557 people of
As such, the determinants featured in Figure 1 and
Aboriginal and/or Torres
discussed above have been selected due to their well- These three areas all have a SECADA/SURe service site in
Strait Islander decent
researched correlation with AOD-related harm, primarily as them, meaning that just over 30% of the client group
reside in the SEM catchment, equating to 0.49% of the
key risk factors. In effect, they assist in explaining some of have easy access to service front doors.
catchment’s total population.
the below outcome-based findings.
∞∞ Data on age and sex was assessed, showing that the
However, in the 2017-18 financial year SECADA saw
average client age for the 12-month period was 37.3
Client and substance profile 277 Aboriginal and/or Torres Strait Islander clients,
years.
accounting for 2.81% of all clients. This proportion is
Data from SECADA’s CIMS almost six times higher than the percentage of the total
was analysed to develop a Table 1: SECADA Clients - age distribution
catchment population for which indigenous peoples
client profile for those who account.
received AOD services in the
SEM catchment between July The residential breakdown of Aboriginal and Torres Strait
2017 to June 2018. A number Islander clients is shown in the table below.
of issues relating to data Percentage of total
completeness and quality were Current SECADA client profile LGA Number
population
encountered, and the dataset City of Dandenong 512 0.34%
did not include extracts from SURe’s CIMS. As such, the City of Casey 1,616 0.54%
resulting client profile cannot be considered completely
Shire of Cardinia 429 0.58%
representative.
Total 2,557 0.49%
∞∞ To understand the geographic distribution of clients,
residential postcodes were analysed. This analysis Males accounted for more than double the number of
clients than females, with 6,787 (69.2%) males and 3,017 16 Spooner C and Hetherington K. (2004). Social Determinants of Drug Use.
indicates that two thirds (66.7%) of clients came from National Drug and Alcohol Research Centre, University of New South Wales,
just 16 postcode areas. The highest concentration of (30.76%) females. Sydney
152019-21South Eastern Melbourne Alcohol and Other Drug (AOD) Catchment-based plan
Our needs - the ‘why’
Age In order to understand the CALD composition of the ∞∞ Substances of concern are
The average age of Aboriginal and Torres Strait Islander total client group, the fields of ‘ethnicity’ and ‘language’ recorded both at intake and
clients was younger than the total client group at 35.19 were assessed. There was some inconsistency in the data assessment, however the data
years (total client group average - 37.3 years). quality where ethnicity and language entered suggested capture at assessment is much
one or both fields were incorrect. more complete across the client
Sex cohort and has therefore been
It should also be noted that at present the mechanism used to determine primary drug
Unlike the total client group where females only
for collecting this data is unclear (eg. client-reported v of concern. 93.19% of clients had their primary drug of
accounted for 30.76% of clients, relatively even numbers
clinician-attributed). As such, the results below should be concern recorded at assessment, as depicted in the table
of males and females from Aboriginal and Torres Strait
Islander backgrounds accessed AOD services. interpreted with some caution. below.
Sex Number Percentage of client group Ethnicity Percentage of
Females 132 47.65% Number total clients
Ethnicity was recorded in 78.93% of the client records. Substance
Males 145 52.34% of clients (excluding
Of those where ethnicity was recorded, 80.20% were tobacco)
Ethnicity, sex and age Australian, followed by 5.50% European, and 3.65% Alcohol 793 40.38%
Further examination of ethnicity, sex and age reflects Asian.
Cannabis 253 12.88%
that males of Torres Strait Islander descent are Methamphetamine 235 11.97%
significantly younger than the rest of the client group, Language
Opioids 113 5.75%
with an average age of 28.52 years. Language was recorded Amphetamine 108 5.50%
Ethnicity Sex Number Average age for just over two thirds Sedatives 49 2.49%
Aboriginal Female 112 35.69 years (67.86%) of the data GHB 12 0.61%
set. Of these, 96.37%
Aboriginal Male 114 36.98 years Cocaine 11 0.56%
were recorded as English,
Torres Strait Islander Female 19 32.89 years Hallucinogens 1 0.05%
followed by 0.55%
Torres Strait Islander Male 31 28.52 years Inhalants 1 0.05%
Vietnamese, and 0.48% Tamil. These results are
incongruent with the high proportions of clients whom Clients with no data
CALD clients speak English as a second language, across south eastern entered as their
388 19.76%
primary drug of
As mentioned previously, cultural and linguistic diversity is Melbourne. concern
a key demographic feature of south eastern Melbourne’s When consulted, SECADA staff advised that as a default,
population. People from CALD backgrounds are defined as: English is recorded as the language when clients opt not
“those people born overseas, in countries other than those to communicate through an interpreter. This results in
classified by the Australian Bureau of Statistics (ABS) as an inaccurately high representation of English-speaking 17 Australian Bureau of Statistics (2017). Census of Population and Housing –
‘main English-speaking countries’, it excludes Canada, clients being recorded and effectively skews the number Cultural Diversity. Retrieved 4 January, 2019 from http://www.abs.gov.au/
ausstats/abs@.nsf/Latestproducts/2024.0Main%20Features22016?opendocum
New Zealand, the United Kingdom, USA and Ireland.”17 of clients whom would otherwise be considered CALD. ent&tabname=Summary&prodno=2024.0&issue=2016&num=&view=
16Prepared by on behalf of SECADA in collaboration with SURe
Our needs - the ‘why’
Health service outcomes Hospitalisation rates per 10,000 population for both
cannabis and other stimulants have increased significantly
∞∞ Many residents of south
in the past three years. In 2014-15 the average
eastern Melbourne who
hospitalisation rate for cannabis across CGD, Casey and
have AOD-related issues
Cardinia was 4.75, whereas in 2017-18 they were:
did not receive service
from SECADA/SURe in the ∞∞ CGD: 17.3
2017-18 year and therefore ∞∞ Casey: 8.6
are not reflected in the client profile above. As such, it is ∞∞ Cardinia: 13.5
important to appraise alternative data sources in order Similarly, the average hospitalisation rate for other
to develop a more comprehensive understanding of the
stimulants in 2014-15 across the three local government
impact of AOD-related harm in the catchment. Data
areas was 4.5. In 2017-18 they were:
from other health services (non-AOD), namely hospitals
and Ambulance Victoria was obtained and analysed for ∞∞ CGD: 20.2
this exact reason. ∞∞ Casey: 12.5
AOD-related presentations at Hospital Emergency ∞∞ Cardinia: 11
Departments in south eastern Melbourne are
consistently higher than State averages. As reflected in Community and stakeholder concerns
Figure 1, in 2013-14, the number of presentations per ∞∞ The online survey platform enabled respondents
10,000 population in CGD were almost double state who may have otherwise been unable to participate
averages.18 the opportunity to contribute their perspectives
Similarly, 2016-17 ambulance attendance rates per at their convenience and with the promise of
100,000 population in CGD sit well above the State anonymity. Aggregated survey responses also provide
average for almost all substances. supplementary data that help to enhance the depth and
richness to other data sets.
Rate Victorian rate ∞∞ Participants rated an average score of 73 (out of 100)
Substance (per 100,000 (per 100,000
population) population)
when asked to rate their level of concern regarding
alcohol and drugs in south east Melbourne. The top three
Alcohol 417.5 301.1 reasons most commonly cited for this score were:
Crystal
73.9 40.7 1. Harmful effects of AOD use on individuals’ health
methamphetamine
and wellbeing, as well as the harms to families and
Illicit drugs 280.8 179.6
communities
Cannabis 59.0 46.4
2. Decreased levels of community safety (both real and
perceived), and increased violence
18 Turning Point (2016). AOD Stats Victoria LGA. Retrieved 4 January, 2019 from
http://aodstats.org.au/VicLGA/ 3. Poor availability and accessibility of services
172019-21South Eastern Melbourne Alcohol and Other Drug (AOD) Catchment-based plan
Our priorities - the ‘what’
As described previously, stakeholder engagement and Figure 3. Suggestions for addressing AOD-related harm
data collection processes were iterative, with each series
of findings being tested by both inductive and deductive
techniques to maximise validation. Creative strategic
development processes and collaborative prioritisation
then aided in the refinement of six priority areas for action:
∞∞ Cross sector collaboration
∞∞ Data accuracy, integrity and application
∞∞ Service geography
∞∞ The role of local government
∞∞ Clients and community
∞∞ Health promotion, prevention and community
development
A vision for the desired outcome/s, as well as indicators
that reflect progress or completion for each of the
identified priority areas were co-designed by stakeholders
at the ‘Solutions forum’. Similarly, these stakeholders
were also tasked with developing specific and measurable
activities for inclusion in the action plan, as well as
determining when in the planning cycle they should occur.
Figure 3 (right) depicts the most commonly reported
suggestions for addressing AOD-related harm in south east
Melbourne across the various consultation platforms.
Governance and working group
structure
Windana as the lead agency for the SECADA consortium, Windana or EACH, it does not belong to SECADA or SURe stakeholders. Working groups will be established and
and EACH as the lead agency for the SURe consortium are or to enliven. It belongs to the south eastern Melbourne coordinated by enliven and will include representatives
ultimately accountable for successfully delivering on the community, and the south eastern Melbourne community from SECADA and SURe where appropriate. They will
plan that has been committed to by submission to DHHS. are all responsible in some way for seeing that it is collectively lead the design and implementation of actions
implemented in the best interests of the community. for their priority area alongside identified key stakeholders.
However, as previously stipulated the roadmap that this
plan provides is a guide for all local service providers and In Year 1 a working group will be convened for each The priority areas for action for which the working
community groups. As such, the plan does not belong to of the six priority areas, comprised of locally relevant groups will be formed are:
18Prepared by on behalf of SECADA in collaboration with SURe
Our priorities - the ‘what’
Priority areas for action A number of opportunities have been identified where working groups will be
required either to support another group to achieve their actions, or to deliver
particular activities collaboratively. Where this occurs, a badge that corresponds to
the companion working group has been affixed within the plan.
A key area for response that emerged from consultation is centred on
improvements required to the AOD service system itself (eg. SECADA/SURe
consortia agencies or other partner organisations). The nature of the identified
improvements is varied, each intersecting with at least one or multiple other
identified priority areas. As such, it was deemed ineffectual to develop a working
group with the sole focus of addressing service system improvements, as this group
Cross sector collaboration Data accuracy, integrity
and application would be heavily reliant on one or multiple other groups depending on the need.
Instead, it was decided that accountability for addressing the identified area of
improvement would be allocated to the working group responsible for the priority
area that most closely relates. These actions are denoted within each action plan
below under the title ‘Service system improvements.’
A note about our approach to the planning cycle
The primary focus for the first year in the life of the plan, is ‘information gathering’
and improving data collection and reporting. This recognises that many decisions
and plans for future years can and should remain either undetermined or flexible
until a more comprehensive understanding is gleaned, which in effect will result
The role of
Service geography in more appropriate and effective action planning. Emphasis will be placed on
local government
building the governance infrastructure and resources required for future service
and program planning; as well as establishing baseline measurements for later
comparison. Workplans for Year 2 and Year 3 will be shaped by these efforts and
a greater understanding of the intricacies of client needs, community harms, and
AOD service issues in south east Melbourne.
A note about scope
Prior to reviewing the priority areas and associated action plans, it should be noted
that the scope for catchment-based planning is limited as described in the catchment-
Health promotion, prevention based planning service specifications. These guidelines recognise that effectively
Clients and community addressing population level AOD-related harm, requires a coordinated effort across
and community development
multiple sectors outside of AOD.
192019-21South Eastern Melbourne Alcohol and Other Drug (AOD) Catchment-based plan
Our priorities - the ‘what’
“Service coordination is expected across However, whilst intersectoral collaboration is promoted
housing, mental health, gambling, and encouraged, the available funding does not permit
primary health, justice, education and actions to occur within other sectors. For this reason, no
employment providers.”19 specific actions have been outlined in this plan that seek to
target or take place within other sectors. Concerted efforts
will however be made to ensure that representatives from
periphery sectors are meaningfully involved in planning
and delivering activities to optimise their relevance and
uptake across the entire system.
Similarly, the service specifications classify “primary
prevention activities” as out-of-scope for catchment-based
planning. However, there is also strong encouragement
for participation in planning structures relating to “health
promotion platforms and strategies”. Stakeholders
throughout all stages of consultation, from clinicians
to managers, and community members themselves
emphasised the need for a heightened focus on health
promotion and prevention. As such, this plan features a
priority area specific to this area of expressed need, but
one that respects the scope prescribed by DHHS and
makes sense for bodies like SECADA/SURe to lead.
19 Victorian Government Department of Health and Human Services (2018).
Alcohol and Other Drugs - Catchment-based planning. Retrieved 7 January, 2019
from https://www2.health.vic.gov.au/alcohol-and-drugs/aod-service-standards-
guidelines/aod-program-guidelines/catchment-based-planning-guide-aod
20Prepared by on behalf of SECADA in collaboration with SURe
Our plan - Cross sector collaboration
INDICATORS: ACTIVITIES: PROGRESS:
What it will look like How we will get there Update on how we are tracking
∞∞ Referral pathways are Year 1 actions:
clear and developed ∞∞ Establish relevant working group
∞∞ AOD staff report high levels ∞∞ Collect baseline data for referrals into and out of the AOD sector
of confidence in navigating/
∞∞ Administer survey to staff to ascertain baseline
assisting clients to navigate
levels of confidence in service system navigation
the broader service system
∞∞ Build understanding and appreciation of key pressures and demands
∞∞ Increased number of
experienced by organisations across sectors (cross-sector empathy) in
appropriate referrals
managing clients with AOD-related issues at a deliberative forum
out of the AOD service
sector ensuring clients are
holistically supported in Service System Improvements
their recovery journey
Develop/strengthen/consolidate referral pathways into and out of the AOD sector
∞∞ Increased number of
appropriate referrals Year 2 actions:
into the AOD sector ∞∞ Monitor referrals data
from related sectors
∞∞ Conduct brief literature review into cross sector collaboration methodology
∞∞ A “No wrong door” approach
is implemented throughout ∞∞ Use literature review findings and other insights to develop
the catchment and AOD a communications and engagement strategy that identifies
services are able to respond to stakeholders and platforms for collaboration (eg. task groups,
DESIRED OUTCOME: clients wherever they present forums, shared consumer groups, online base camp)
What we want to see ∞∞ Deliver cross sector empathy and collaboration forums
∞∞ Intersectoral collaboration
is enhanced by the informed by literature review findings
That AOD services in ∞∞ Build capacity of internal and external staff, including GPs
establishment of relevant
south eastern Melbourne cross-sector platforms and and other health professionals, to enhance referral practices
are integrated with the enhanced relationships and implement a “No wrong door” approach
broader service system ∞∞ Advocate for funding to deliver collaborative AOD initiatives
and strive for excellent
cross-sector collaboration Year 3 actions:
in responding to people ∞∞ Re-administer survey to staff to compare levels of confidence
experiencing AOD-related in service system navigation with baseline results
issues. ∞∞ Conduct evaluation of year 1 and 2 activities, and
measure progress against indicators
∞∞ Review priority area and make recommendations regarding its continuation
∞∞ Showcase learnings, including both successes and failures
212019-21South Eastern Melbourne Alcohol and Other Drug (AOD) Catchment-based plan
Our plan - Data accuracy, integrity and application
INDICATORS: ACTIVITIES: PROGRESS:
What it will look like How we will get there Update on how we are tracking
∞∞ Data captures are Year 1 actions:
100% compliant with ∞∞ Establish relevant working group
reporting requirements
∞∞ Conduct a gap analysis of VADC data requirements vs. the
∞∞ Data is routinely captured draft catchment-based planning minimum data set
from multiple sources and
∞∞ Develop a south eastern Melbourne catchment-
used to inform planning
based planning data monitoring framework
(e.g. local government,
ambulance, ABS, VicPol) ∞∞ Develop a strategy for gathering and using qualitative data
that specifies what data is to be collected when, from whom
∞∞ At least 20% of data
(eg. staff, clients, community) and for what, etc.
used to make planning
decisions is qualitative
(e.g. from consultation) Service System Improvements
∞∞ Incomplete/unentered/
insufficient data decreases Scope the need for and make any required changes to EpiSoft
as a proportion of all Year 2 actions:
data collected
∞∞ Develop and implement a capacity building strategy that highlights
∞∞ Improvements to data the value of accurate and complete data collection both internally and
quality and integrity are external to the AOD sector, and includes updated practice guidelines
communicated and the
effects that this has on the ∞∞ Launch data monitoring framework and associated material
DESIRED OUTCOME: service system are clear and ensure staff are equipped to optimise it
What we want to see ∞∞ SECADA/SURe take ∞∞ Implement qualitative data strategy
a leadership role in ∞∞ Communicate feedback to the sector
That south eastern AOD data integrity
Melbourne AOD
service and program
planning is informed by
Year 3 actions:
accurate, relevant and
∞∞ Re-administer survey to staff to compare levels of confidence
comprehensive data to in service system navigation with baseline results
enable excellent evidence- ∞∞ Conduct evaluation of year 1 and 2 activities, and
based decisions and guide measure progress against indicators
interactions with the ∞∞ Review priority area and make recommendations regarding its continuation
community. ∞∞ Showcase learnings, including both successes and failuresPrepared by on behalf of SECADA in collaboration with SURe
Our plan - Service geography
INDICATORS: ACTIVITIES: PROGRESS:
What it will look like How we will get there Update on how we are tracking
∞∞ Service locations (including Year 1 actions:
co-locations) reflect ∞∞ Establish relevant working group
community need
∞∞ Conduct scoping of council Geographic Information Systems (GIS)
∞∞ Increased number of capacity to enhance AOD catchment-based planning service geography
services co-located to (includes measures of unmet need, such as Ambo, ED, VicPol, people at
address unmet need risk of alcohol related harm)
∞∞ Increased service attendance ∞∞ Conduct annual review and update of service
across the catchment, catalogue to inform service planning
with equitable distribution
∞∞ Consult with clients and community to understand the barriers to service
at all services relative
access and utilise findings to inform further year 2 and 3 actions
to community need
∞∞ Information on available Service System Improvements
AOD services is provided
in accessible formats Implement identified opportunities for co-location/outreach/telehealth/eHealth
according to literacy and
English proficiency needs Year 2 actions:
∞∞ Monitor service utilisation data in the context of GIS mapping output to
stay informed of geographic areas experiencing gaps in service delivery
∞∞ Develop and update communications material including social
marketing, ensuring it is available in accessible formats
DESIRED OUTCOME:
What we want to see ∞∞ Scope opportunities for cross sector co-location, outreach
and telehealth/eHealth options to enhance service availability,
That south eastern including advocacy for funding if required
Melbourne AOD services ∞∞ Review and make any required amendments to service catalogue
are available in a range of
easily accessible locations Year 3 actions:
across the catchment, ∞∞ Repeat GIS mapping exercise comparing to Year 1 extract
and that clients and to evaluate changes to service geography
community are aware of ∞∞ Review and make any required amendments to service catalogue
how and when they can ∞∞ Conduct evaluation of year 1 and 2 activities, and
access them. measure progress against indicators
∞∞ Showcase learnings, including both successes and failures
23You can also read