2019 Chilton Capital Management Commentary | January 2019 - Liberty Street Funds
←
→
Page content transcription
If your browser does not render page correctly, please read the page content below
Q4 2018 Manager Commentary
                                                                                                  REIAX • REICX• REIIX

2019 Chilton Capital Management Commentary | January 2019

Volatility certainly ruled in 2018 once again, showing that 2017 was not a fluke. As of December 31, 2018, the
MSCI US REIT Index (Bloomberg: RMZ) finished the year with a total return of -4.6%. The rise in interest rates from
2.4% to 2.7% and a second half global selloff caused the West Loop Realty Fund to finish the year in a bear case
scenario.

Importantly, we correctly predicted another year of strong fundamentals. We forecast another year of positive fun-
damentals in 2019, which could produce real estate investment trust (REIT) price appreciation . The biggest risks
to our 2019 outlook are an economic downturn, rising interest rates, and an uptick in new construction.

2018 Review

Early in the year, REITs were attached at the hip to long term interest rates, as they had been since 2012. From
January 1 to February 21, the US 10-yr Treasury yield increased from 2.4% to 3.0% and the RMZ dropped by 12%.
The drop in the index value without the corresponding decline in fundamentals led us believe that REITs were
inexpensive, presenting an entry point that occurs only a few times every cycle. We also noted the extreme diver-
gence in performance between the RMZ and the S&P 500, and felt that the divergence historically closed over
the next 12 months, resulting in significant REIT outperformance. From March 1, 2018 through December 31,
2018, the RMZ produced a total return of +7.7%, besting the S&P 500 which had a total return of -4.9%.

Surprisingly, the US 10-yr Treasury yield was flat (although volatile) over that period of REIT outperformance.
Although a decoupling from interest rates has been on the Chilton Capital Management’s Team Christmas wish
list since 2012, this was not part of our bullish call. Instead, we merely looked at the past 20 years for other peri-
ods with similar valuation metrics. We found that such inexpensive valuation levels were only reached during and
around recessions. Given our both near and intermediate term positive outlook for positive fundamentals, we felt
confident that the market would eventually recognize the value of a predictable, growing income stream, espe-
cially when it is at a significant discount to where properties are trading on the private market.

Despite the RMZ finishing in bear market territory amid rising interest rates, REIT and S&P 500 total returns were
almost identical. The S&P 500 produced a total return of -4.4% in 2018, only 20 basis points (or bps) ahead of
the RMZ 2018’s REIT performance, especially the rebound following the precipitous drop to start the year, should
serve as a reminder that REITs can benefit in an environment of decelerating GDP growth and low inflation.

2019 Forecast

Looking into 2019, we believe diversification will once again prove to be the prudent investment decision. We
believe the economic environment will continue to be choppy as it was toward the end of 2018. GDP and job
growth will slow for 2019 versus 2018, as consensus 2019 GDP growth is projected to be only 2.6% versus 2.9%
for 2018, and 2019 consensus job growth is 157,000 per month, which compares to 204,000 per month in 2018.
After commentary from the FOMC (Federal Open Market Committee) meeting on December 19, the market is
now assuming only two rate hikes for 2019, which reflects a ‘data-dependent’ path. Assuming the Fed does not
hike rates beyond the neutral rate and completely stave off growth, we do not believe a recession will likely occur
in 2019.

In our opinion, the choppy yet positive economy (without a recession) could produce a near ‘goldilocks’ environ-
ment that could drive REIT prices closer to NAV from their current discounts.

We believe that REITs will be able to trade closer to NAV as REIT fund flows reverse course from the past four
years. REITs have struggled to trade at a premium to NAV partly due to massive flow of funds away from REITs. In
the meantime, broad equity investors were rewarded for taking more risk, enjoying annualized returns well above
those produced by REITs. However, we believe the elevated risk in the stock market in the fourth quarter of 2018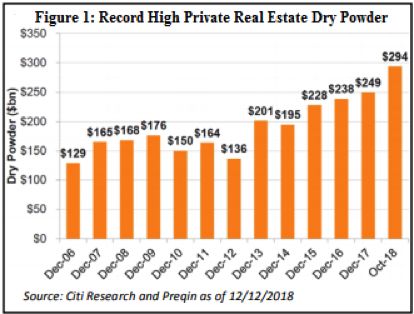
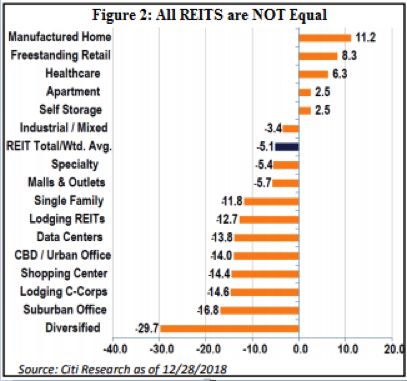
West Loop Realty Fund Q4 2018

 combined with the discounted valuation and lower risk profile of REITs sets the stage for a reversal of fund
 flows in 2019.

 While we don’t forecast total returns for the S&P 500, we do feel the predictability of REIT earnings, NAV, and
 dividends over the next 12 months is higher than the predictability of S&P 500 earnings. REITs are also insu-
 lated from any direct effects from tariffs that could dampen S&P 500 earnings growth in 2019. This is due to
 REITS limited exposure to overseas revenue.

 In addition, due to the one-time nature of the benefits from corporate tax reform in 2018, S&P 500 earnings
 growth is set to decelerate meaningfully in 2019. In contrast, REIT same store net operating income (SSNOI)
 and adjusted funds from operations (or AFFO) growth in 2019 should be as strong as or stronger than in 2018.
 Therefore, investors may consider rotating out of sectors that have outperformed over the past four years and
 are now in a stage of decelerating growth. The forecast is supported by benign new construction, attractive
 valuations, and the potential for merger and acquisition (or M&A) activity. Though construction has increased
 steadily during this cycle, we are still below the historical average for construction starts at 1.5% of existing
 stock. Despite what the Fed has said about inflation remaining subdued, construction costs have increased al-
 most 33% since 2012. The result is positive for landlords as it increases replacement costs and, in most cases,
 eventually leads to higher rents. As of December 31, 2018, REIT valuations were in the ‘extremely’ inexpen-
 sive range, which could attract generalist investors. Also according to ISI Research, the discount to NAV was
 14%, which compares to the long term average premium of 1%. We believe a spread that is 100 bps or more
 above the historical average has typically had a 80% correlation with positive total returns over the next two
 years.

 Finally, according to Preqin, a real estate private equity consultant, there is $294 billion in capital raised in
 private equity funds as of November 2018 with the purpose of investing in commercial real estate, an alltime
 record and up $45 billion from 2017 (Figure 1). The volatility of REITs in 2018 and high availability of capital
 generated appealing scenarios for both public to public and public to private transactions. As a result, there
 were $87 billion in M&A transactions in 2018, the most since 2006. We believe the ‘wall of capital’ combined
 with a positive US commercial real estate outlook will lead to another year of elevated M&A activity, which
 could be a catalyst to close the discount to NAV.

 Sector Overweights

 As a reminder, the REIT industry has come a long way toward inclusion of new sectors away from core real
 estate such as office buildings and apartments. We believe the differentiation between REITs and REIT sectors
 is not fully appreciated by most investors and it therefore makes generalizations about “all REITs” unreliable.
West Loop Realty Fund Q4 2018

Figure 2 shows the total returns of 16 REIT sectors in 2018. Within sectors, the results of individual REITs
differed as well. For example, the best mall REIT SP Plus Corporation (NYSE:SPG) produced a total return of
+2.5% versus the worst CBL & Associates Properties, Inc. (NYSE:CBL) at -60.0%. We believe this is why active
management in REITs seems likely to allow for the generation of alpha over long periods.

Going into 2019, the largest overweights in the West Loop Realty Fund are cell towers, residential, and malls.
The largest underweights are healthcare, triple net, and lodging.

The first half of 2018 was plagued by the rumor, and then actual announcement, of a merger agreement
between Sprint (NYSE: S) and TMobile (NYSE: TMUS). If approved by the Department of Justice and Feder-
al Trade Commission, the companies plan to decommission 35,000 cell sites as the leases mature over the
next 10 years (average remaining term is 3-7 years depending on the tower owner). However, they have also
announced plans to add 10,000 new sites and significantly increase utilization at 60,000 sites (which normally
results in rent increases) in the near term. Whether or not the deal is approved in 2019, we believe the pos-
itive near-term fundamentals driven by 5G upgrades, FirstNet rollout (potentially 40,000 new leases), and
international smartphone penetration will far outweigh any headwinds from Sprint non-renewals.

The residential sector was also a positive contributor in 2018, led by Essex Property Trust, Inc. (NYSE: ESS)
which benefited from the failure of a proposition to allow for more rent control in California. The biggest lag-
gards were the single family rental REITs: Invitation Homes (NYSE: INVH) and American Homes 4 Rent (NYSE:
AMH). Both had issues controlling expenses, particularly related to Hurricane Florence. We believe the solid
story of increasing demand from job growth and the lack of new supply will drive a rebound in the single fam-
ily rental REITs and continued outperformance by the apartment REITs, especially if mortgage rates remain at
or above current levels. Additionally, limits on deductibility of interest expense and property taxes for home-
owners have decreased affordability somewhat in favor of rental options.

Finally, malls were a lightning rod for speculators who believe that e-commerce will make brick-and-mortar
retail obsolete. Other than Simon Property Group (NYSE: SPG), all mall REITs underperformed in 2018, with
the low quality mall REITs at the back of the pack. The Sears bankruptcy, albeit official now, is still an overhang
as landlords aren’t sure if the company will ultimately close all stores, or just the ones on the initial list in the
filing.
West Loop Realty Fund Q4 2018

In addition, JCPenney’s (NYSE: JCP) stock price was down 67.1% in 2018, leading some to believe it could
be the next department store to announce store closures. And Macy’s could soon follow with more closures,
though its total return was +23.7% in 2018. We maintain that high quality mall REITs with access to capital will
be able to survive and thrive in the changing retail environment. As such, SPG is the largest holding in the
Fund as of December 31, 2018.

Healthcare and Triple Net had improbably solid total returns in 2018. Both are known as interest rate sensitive
sectors, and thus their outperformance despite the 30 bps increase in the US 10 yr Treasury yield over the
year was surprising. We believe that both will underperform other REIT sectors that offer higher growth in the
current environment. In addition, their outperformance this year has resulted in both sectors trading at NAV
premiums at the same time that most REITs are trading at a discount to NAV. Similarly, lodging REITs are trad-
ing at premium valuations but offer little growth in the face of high supply.

What is Different This Time?

Admittedly, we are not proud of the relative performance of the West Loop Realty Fund in 2018. We attribute
the underperformance to the lack of healthcare and triple net exposure, which attracted investors looking for
safety (in the form of long term leases) and high dividend yields. In addition, the Fund’s allocation to several
mid-tier quality shopping center REITs and lack of exposure to a few higher quality shopping center names
detracted from the Fund’s relative return.

In 2019, we believe some of our names that caused the underperformance will stabilize, and the portfolio is
positioned to regain outperformance versus the benchmark. Notable changes in 2018 include an overweight
allocation to the single family rental REITs (versus prior zero exposure), zero self-storage exposure (versus prior
slight underweight), and an overweight position in industrial (versus prior underweight).

As a result of portfolio positioning, weighted average NAV discount of the West Loop Realty Fund is 17%,
which compares to the RMZ weighted average of 14% as of December 31, 2018. We believe this portfolio of
high growth at a discounted value has the potential to produce returns above the index in 2019.

As of December 31, 2018, the Fund’s Top 10 holdings were as follows: Simon Property Group Inc (SPG):
8.89%, Essex Property Trust Inc (ESS) 6.05%, Equinix Inc (EQIX) 5.59%, Crown Castle International Corp
(CCI), 5.55%, AvalonBay Communities Inc (AVB) 5.52%, Boston Properties Inc (BXP) 4.96%, Camden
Property Trust (CPT) 4.81%, American Tower Corp (AMT) 4.18%, SBA Communications Corp (SBAC)
4.00%, CyrusOne Inc (CONE) 3.73%.
West Loop Realty Fund Q4 2018

                                    PERFORMANCE (%) as of 12/31/2018
                                       Q4 2018         YTD         1 Year      3 Year        5 Year         Ann ITD*
 REIAX                                  -7.88%       -9.22%       -9.22%       1.55%         7.33%           7.33%
 REIAX w/Load                           -13.15%      -14.41%     -14.41%       -0.42%        6.06%           6.06%
 REICX                                  -7.99%       -9.88%       -9.88%       0.82%         6.53%           6.53%
 REIIX                                  -7.81%       -8.90%       -8.90%       1.82%         7.60%           7.60%
 MSCI US REIT Index                     -6.71%       -4.57%       -4.57%       2.88%         7.80%           7.80%

Performance data quoted represents past performance and is no guarantee of future results. Total
return figures include the reinvestment of dividends and capital gains. Current performance may be low-er
or higher than the performance data quoted. Investment return and principal value will fluctuate so that an
investor’s shares, when redeemed, may be worth more or less than original cost. For the most recent month
end performance, please call (800) 207-7108. Returns showing less than one year are cu-mulative. The gross
operating expense ratio for the Class A. C. and Institutional Shares are 1.59%, 2.34%, and 1.34% respectively.
The net operating expenses after fee waiver and/or expense reimbursements are 1.35%, 2.10%, and 1.10% for
the Class A, C, and Institutional Shares respectively. The contractual agree-ment between the Fund and the
Advisor for fee waiver and/or expense reimbursement is in effect until April 30, 2019. Without the contractual
agreement, performance would have been lower. Performance results with load reflect the deduction for Class
A Shares of the 5.75% maximum front end sales charge. Class C Shares are subject to a contingent deferred
sales charge of 1.00% when redeemed within 12 months of purchase. Performance presented without the
load would be lower if this charge was reflected Fund performance may be subject to substantial short-
term changes. *ITD represents inception-to-date data; inception 12/31/2013.
RISK AND OTHER DISCLOSURES:
Before investing you should carefully consider the West Loop Realty Fund’s investment objectives, risks,
charges and expenses. This and other information about the Fund is in the prospectus and summary
prospectus, a copy of which may be obtained by calling 800-207-7108 or by visiting the Fund’s website at
www.libertystreetfunds.com. Please read the Fund’s prospectus or summary prospectus carefully before
investing.
An investment in the West Loop Realty Fund is subject to risk, including the possible loss of principal amount
invested and including, but not limited to, the following risks, which are more fully described in the prospectus:
• The Fund invests in Real Estate Investment Trusts (REITs), which involve additional risks compared to those from
investments in common stock. REITs are dependent upon management skills; generally may not be diversified;
and are subject to heavy cash flow dependency, defaults by borrowers, self-liquidation, and tax risks.
• Investments in REITs involve risks including, but not limited to, market risk, interest rate risk, equity risk and risks
related to the real estate market.
The Fund will be closely linked to the performance of the real estate markets. The Real Estate industry is subject
to certain market risks such as property revaluations, interest rate fluctuations, rental rate fluctuations and
operating expenses, increasing vacancies, rising construction costs and potential modifications to government
regulations.
• REITs are subject to declines in the value of real estate as it relates to general and local economic conditions
and decreases in property revenues. Continued disruptions in the financial markets and deteriorating economic
conditions could adversely affect the value of the Fund’s investments.
• As a non-diversified fund, the Fund may focus its assets in the securities of fewer issuers, which exposes the
Fund to greater market risk than if its assets were diversified among a greater number of issuers.
• The Fund’s investments will be concentrated in the real estate sector. The focus of the Fund’s portfolio on a
specific sector may present more risks than if the portfolio were broadly diversified over numerous sectors.
• Foreign investment risk. These risks include currency fluctuations, economic or financial instability, lack of
timely or reliable financial information or unfavorable political or legal developments. Foreign companies are
generally subject to different legal and accounting standards than U.S. companies.
• The Fund invests in small and mid-cap real estate companies, which may involve less trading and, therefore, a
larger impact on a stock’s price than customarily associated with larger, more established company stocks.
• In order to qualify for the favorable tax treatment generally available to regulated investment companies,
the Fund must satisfy certain diversification requirements. The Fund’s strategy of investing in a relatively small
number of securities may cause it inadvertently to fail to satisfy the diversification requirements. If the Fund
were to fail to qualify as a regulated investment company, it would be taxed in the same manner as an ordinary
corporation, and distributions to its shareholders would not be deductible by the Fund in computing its taxable
income.
West Loop Realty Fund Q4 2018 The MSCI US REIT Index is a is a free float adjusted market capitalization weighted index that is comprised of equity REITs that are included in the MSCI US Investable Market 2500 Index, with the exception of specialty equity REITs that do not generate a majority of their revenue and income from real estate rental and leasing operations. The index represents approximately 85% of the US REIT universe. The S&P 500 ® Index is a broad-based, unmanaged measurement of changes in stock market conditions based on the average of 500 widely held common stocks. The Bloomberg Barclays US Aggregate Bond Index is a broad-based flagship benchmark that measures the investment grade, US dollar-denominated, fixed-rate taxable bond market. The index includes Treasuries, government-related and corporate securities, MBS (agency fixed-rate and hybrid ARM pass-throughs), ABS and CMBS (agency and non-agency). One cannot invest directly in an index. Discount to net asset value (NAV) refers to a situation where shares of a closed-end stock fund are trading at a price lower than the fund’s net asset value per share A Basis Point is a unit of measure used in finance to describe the percentage change in the value or rate of a financial instrument. One basis point is equivalent to 0.01% (1/100th of a percent) or 0.0001 in decimal form. Distributed by Foreside Fund Services, LLC. The views in this material are intended to assist readers in understanding certain investment methodology and do not constitute investment advice. The views in this material were those of the Fund’s Sub-advisor as of the date written and may not reflect its views on the date this material is first disseminated or any time thereafter. Liberty Street Advisors, Inc. is the advisor to the Fund. The Fund is part of the Liberty Street family of funds within the series of Investment Managers Series Trust.
You can also read