2019 Economic & Market Outlook - January 2019 - Cerity Partners
←
→
Page content transcription
If your browser does not render page correctly, please read the page content below
2019 Economic & Market Outlook
January 2019
2019 Economic & Market Outlook

             Source: D. Granlund, The Cagle Post. Reprinted with Permission

             Table of Contents
             Executive Summary                                                  Page 3
             2018 Wrap-Up                                                       Page 4
             Economic Outlook                                                   Page 5
             Key Risks                                                          Page 8
             Key Investment Themes for 2019                                    Page 11
             2019 Portfolio Positioning                                        Page 17
             2018 Scorecard                                                   Page 18
             Fourth Quarter Performance Summary                               Page 21

                                                                                         2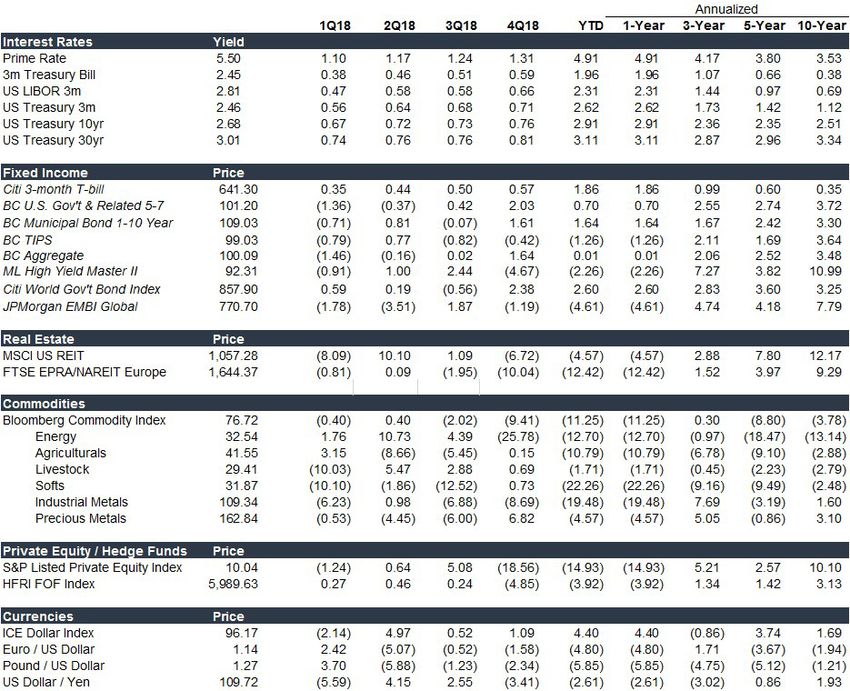
2019 Economic & Market Outlook
Executive Summary

Global markets ended 2018 on a dismal note, with many major asset categories posting negative returns for the year after a challenging fourth quarter. Foremost on
investors’ minds are two pressing questions: One, now that the Fed has taken away the proverbial punch bowl, is the party over for investors? And two, are we now
about to experience a damaging recession?

In our view, the recent market gyrations reflect unease over the uncertain direction of economic policy and fear of a global trade war, rather than any deterioration
in the underlying economic fundamentals. Indeed, the most recent economic data confirm that the U.S. economy remains firmly on track for continued growth in
2019 and even 2020. As a result, we are optimistic about the outlook for 2019, although we expect it will be another year of decoupling between positive economic
fundamentals and negative market sentiment in reaction to political uncertainty here and abroad.

We also enter 2019 with what might be considered a clean slate. Equity valuations have recalibrated lower and now offer considerably more upside to investors. Spreads
on high-yield bonds and EM debt have widened to where investors are fully compensated for being in these asset classes, while default risk remains low and there is no
sign of a recession on the horizon. If anything, the key risk investors face today is being too conservatively positioned in reaction to the recent market sell-off to take
full advantage of these opportunities.

Our Key Investment Themes for 2019

    1. The global growth expansion continues.
    2. Volatility is back in the picture.
    3. The dollar’s bull run may be finally ending.
    4. Cash is competitive again. And bonds are not just for income.
    5. In bonds, favor credit over duration.
    6. Equities are likely to rebound and offer compelling value at current levels.
    7.   Favor emerging markets over developed markets.
    8. There’s limited upside for commodities in 2019.
    9. Alternative investments have a bigger role in portfolios.
    10. Diversification remains a critical tool for risk control.

                                                                                                                                                                          3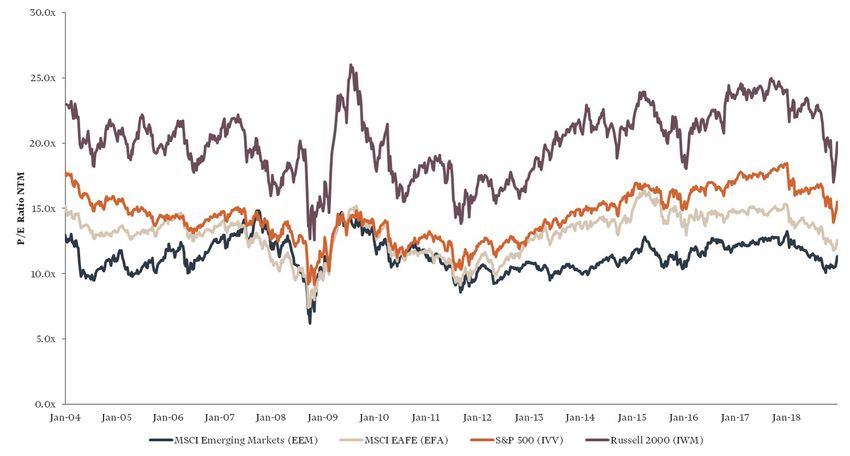
2019 Economic & Market Outlook
2018 Wrap-Up
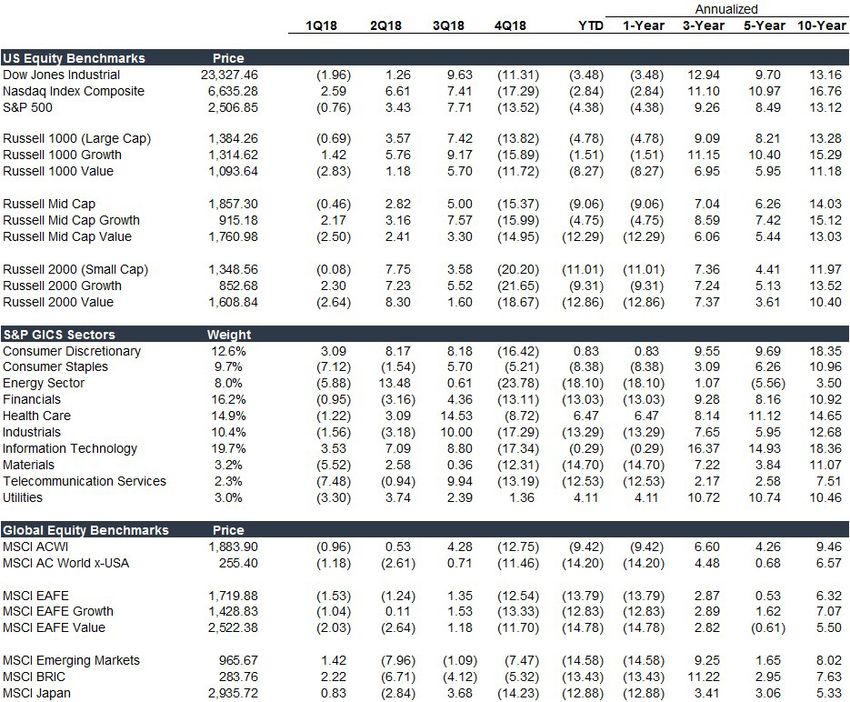
Let’s begin with a review of how the major asset classes performed in 2018. Chart 1 Through Q3, it seemed our concerns were unfounded. Investors were buoyed by signs that
provides a pictorial depiction of Q4 and full-year results. The underlying performance the synchronized global growth trend was continuing into 2018. The steep cut in corporate
data can be found in the dashboard at the back of this report. tax rates from 35% to 21% helped fuel a strong rally in U.S. equity markets. Emerging
markets appeared to shrug off challenges from the strong dollar, a slowdown in China and
Chart 1: 2018 Q4 and Full-Year Asset Class Returns weak commodity prices. As the year progressed, markets powered ahead to hit new highs
in September, and it appeared that 2018 would be another good year for investors.
However, Q4 brought a dramatic shift in market sentiment, leading to widespread market
sell-offs in October and December. A few reasons were cited for the abrupt change.
1. The Federal Reserve unnerved markets by signaling a new and considerably more
hawkish stance on future interest rate hikes. A steep fall in U.S. and global equity
markets forced the Fed to issue a clarification that it had not abandoned its pledge
of a measured and gradual path to raising rates.
2. Q3 corporate earnings reports indicated that a number of industrial companies
were seeing margins squeezed by the strong dollar, rising wages and higher
materials prices at the same time protectionist measures were impacting business
conditions. Markets grew increasingly nervous that the escalating rhetoric between
the U.S. and China would bring about punitive tariffs, which could also affect other
countries and lead to a broader global slowdown.
3. High-flying technology companies that had propelled markets to new highs in 2018
Source: Bloomberg, FactSet, MSCI, Vanguard Source: FactSet
faced a slew of negative headlines about their business practices, sparking fears of
a crackdown by regulators that could impede their future growth. With investors
In our 2018 outlook, we cautioned investors that 2018 was likely to be a challenging year already rattled by headlines, the subsequent disclosures of weakening business
and not to expect a repeat of 2017’s stellar returns. We cited a number of reasons for conditions in China, a key export market, helped spark a massive sell-off across the
caution: sector.
• The potential for policy missteps by central banks
• The disruptive impact of rising populist movements around the world
• The impact of growing protectionist sentiment on global trade
• The economic slowdown in China and its effect on emerging markets
4
2019 Economic & Market Outlook
As highlighted in Chart 1, virtually all asset classes posted negative returns for the       Chart 3: Latest Global GDP Forecasts
year, giving the impression that diversification provided little benefit to investors in                                     IMF - 1/19        World Bank - 1/19         OECD - 11/18       Average
2018. However, for the first time since the global financial crisis, bonds were the best                                  2018        2019       2018        2019        2018     2019   2018     2019
performing asset class and helped protect investor capital. And if we look more closely at
                                                                                              World                       3.7         3.5         3.0         2.9        3.7      3.5    3.9      3.6
the data for Q4 and December (the worst month for equities), we see that diversification
                                                                                              Developed Markets           2.3         2.0         2.2         2.0        2.4      2.1    2.4      2.1
across equity markets was helpful to investors:
                                                                                                       USA                2.9         2.5         2.9         2.5        2.9      2.7    2.9      2.6
Chart 2: Global Equity Performance                                                                     Japan              0.9         1.1         0.8         0.9        0.9      1.0    1.1          1.1
 Category                   Benchmark             2018          4th Qtr.      December                 Eurozone           1.8         1.6         1.9         1.6        1.9      1.8    1.9          1.7
 U.S. Large Cap              S&P 500             -4.38%         -13.52%         -9.03%                 UK                 1.4         1.5         1.3         1.4        1.3      1.4    1.3      1.4
 U.S. SMID                 Russell 2000          -11.01%        -20.20%         -11.88%       Emerging Markets            4.6         4.5         4.2         4.2        4.7      4.7    5.1      4.9
 Developed non-U.S.         MSCI EAFE           -13.79%         -12.54%         -4.85%                 Brazil             1.3         2.5         1.2         2.2        1.2      2.1    1.2      2.3

 Emerging Markets            MSCI EM            -14.98%          -7.56%         -2.70%                 Russia              1.7        1.6         1.6         1.5        1.6      1.5    1.6      1.5

 Global Equities            MSCI ACWI            -9.42%         -12.75%         -7.04%                 India               7.3        7.5         7.3         7.5        7.5      7.3    7.4      7.4

Source: FactSet                                                                                        China              6.6         6.2         6.5         6.2        6.6      6.3    6.6      6.2
                                                                                             Source: IMF. World Bank, OECD

Economic Outlook                                                                             Chart 4: Global Economic Growth Prospects

Global GDP growth is expected to slow in 2019, mainly due to lower growth in the U.S.
and China. U.S. GDP growth is predicted to fall from an above-trend 2.9% in 2018 to 2.6%
in 2019, which many economists now view as a more accurate measure of the economy’s
long-term growth potential. GDP growth for China is forecasted to fall to 6.2% this year.
Besides the continuing trade conflict with the U.S., the drop reflects a recalibration of
growth expectations as part of the ongoing transition from a manufacturing-driven,
centrally planned economy to a more consumer-driven economic model. Chart 3 is a
summary of the latest forecasts from the International Monetary Fund (IMF), World
Bank, Organization for Economic Cooperation and Development (OECD) and Bloomberg:

The foremost concern for investors is whether the current global expansion is finally
ending. While economic growth has slowed from the torrid pace of early 2018, it’s still
forecasted to stay strong over the next couple of years:

                                                                                             Source: World Economic Outlook, International Monetary Fund, October 2018

                                                                                                                                                                                                            5
2019 Economic & Market Outlook
Although global manufacturing activity slowed in 2018, the latest readings from
manufacturing purchasing managers show they remain broadly optimistic about their            Chart 6: Nearing the End of the Economic Cycle
business prospects going into 2019:

Chart 5: Global Purchasing Managers Index – Manufacturing
         Data as of 12/31/2018

                                                                                             Source: National Bureau of Economic Research

                                                                                             Chart 7: U.S. Recession Risk Estimates
Source: 1Q 2019 Guide to The Markets, JP Morgan Asset Management, January 2019

A big question for investors is the outlook for the U.S. economy, which has been a
key contributor to higher global growth in recent years. Many worry that the current
expansion, now the second longest on record, cannot continue indefinitely and that after a
nearly 10-year advance, the economy is overdue for a recession.

In our view, the long duration of the current cycle is irrelevant. A recession is usually
triggered by higher interest rates that lead to a sharp slowdown in the economy or a steep
rise in borrowing costs. With GDP growth below 2% for much of the post-crisis period, the
anemic nature of the expansion and the unusual late-cycle fiscal boost from the 2017 tax
cuts point to a continuation of the current expansion. An absence of traditional recession
indicators, such as an inverted yield curve or a blowout of high-yield spreads, confirms
this expectation. A recent Goldman Sachs study puts the likelihood of a U.S. recession
at 10% over the next 12 months, rising to 25% over the next two years and 43% over the
next three years (Chart 7). We believe the odds of a recession before 2021 are low as        Source: J. Hatzius, 2019 Outlook: The Home Stretch, Goldman Sachs Economics Research, November 2018
policymakers will be keen to avoid a downturn going into the presidential election.

                                                                                                                                                                                                   6
2019 Economic & Market Outlook
Capital investment and productivity increases will be crucial drivers for a continuation   Consumer spending accounts for nearly two-thirds (2/3) of U.S. GDP, which makes it a
of the current expansion. In the uncertain economic environment of the post-crisis era,    key determinant of economic health. We’re reassured that the overall backdrop for this
businesses were reluctant to make large capital investments and preferred to hold cash     critical segment remains solidly positive: national unemployment stands at historically
in reserve or execute share buy-backs. As a result, many businesses have been operating    low levels, aided by strong jobs growth. Workers have seen their purchasing power
with aging or obsolete machinery, which prevents them from taking full advantage           boosted by a combination of wage growth, subdued inflation and a sharp fall in energy
of recent technical and technological advances to improve operating efficiency. The        prices. Deleveraging has left consumer balance sheets in good shape, and savings rates
2017 corporate tax cuts have greatly improved business profitability, and we believe       have gone up. And, despite the recent drop in investment markets, consumer sentiment
corporations should now be comfortable investing in new capital equipment:                 remains very healthy. All this bodes well for the U.S. economy as we enter 2019.

Chart 8: Capital Investment by Businesses: A Key Driver of GDP Growth                      Chart 9: The Health of the U.S. Consumer

                                                                                           Source: FactSet
Source: Federal Reserve Economic Data, Federal Reserve Bank of St Louis, December 2018

                                                                                                                                                                                     7
2019 Economic & Market Outlook
Key Risks to Our Forecast
United States
                                                                                                Chart 11: Federal Funds Rate Expectations
Policy missteps by the Federal Reserve are a significant risk to our forecast. Monetary
policy is now considered tight, with real interest rates above zero. As it continues to
shrink its balance sheet, the Fed is, in effect, withdrawing liquidity from the financial
system. With an already tight monetary policy, a growing budget deficit and the potential
pause in further rate hikes, the Fed will have limited room to maneuver if economic
conditions deteriorate down the line, unlike other developed markets.

Chart 10: Impact of Fiscal Policy on Budget Deficits

                                                                                                Source: U.S. Recession Rundown, Goldman Sachs Macro Research, October 2018

                                                                                                The other aspect of the Fed’s normalization policy is the ongoing reduction of its balance
                                                                                                sheet to unwind actions taken following the financial crisis (quantitative easing). At a
                                                                                                runoff rate of $50 billion per month, the impact of the contraction is relatively small in
                                                                                                comparison to the overall $4.06 trillion balance sheet at the end of 2018.

                                                                                                China
Source: Federal Reserve Economic Data, Federal Reserve Bank of St Louis, December 2018
                                                                                                As shown in Chart 12 on the following page, China is attempting a delicate transition
                                                                                                from a centrally-planned economy based on manufacturing to a more consumer-driven
One of the unusual aspects of the current tightening cycle is the virtual absence of            economic model. This transition has been hampered by the government’s periodic need
inflationary pressures. We think the Fed was compelled to hike rates; otherwise, it would       to reverse course and loosen restrictions on industrial production to maintain economic
have little ability to cut them in the future. Markets are currently pricing in one rate        and market stability. Just recently, the government reduced reserve requirements and
hike in 2019. U.S. rates will still be low by historical levels, and policymakers will still    loosened restrictions on bank lending. It also stated its readiness to implement other
be restricted in their ability to cut interest rates in the event of a downturn, unlike prior   stimulus measures to help stabilize growth.
downturns when rates were cut by more than 5%.

                                                                                                                                                                                             8
2019 Economic & Market Outlook
Chart 12: China’s Rebalancing Act

                                                                                             If we look at the relative performance of equity markets and currency rates, the U.S. looks
                                                                                             to be “winning” the early stages of the trade dispute. However, it’s not in either country’s
                                                                                             interest to have the trade tensions escalate into a protracted trade war. U.S. companies
                                                                                             are already seeing steeper prices for essential materials and components obtained from
                                                                                             China. Thus, just as with the European Union (EU) and Mexico/Canada conflicts, we
                                                                                             expect a behind-the-scenes compromise that partially addresses some of the most critical
                                                                                             issues and allows each side to claim victory.

                                                                                             Chart 14: U.S., China and Tariffs

Source: FactSet

The U.S.-China trade dispute is another major risk to our 2019 outlook. It has already
caused a slowdown in the Chinese economy even before all of the sanctions have
taken effect. As highlighted in Chart 13, if all the threatened tariffs are implemented, a
contraction equal to 0.4% of China’s GDP is expected in the region:

Chart 13: GDP Impact of Tariffs

                                                                                             Source: FactSet

                                                                                             In its Top Risks 2019 report, the Eurasia Group explained that the U.S.-China dispute is
                                                                                             not merely about trade barriers or intellectual property, but rather a fight over global
                                                                                             dominance by two competing ideologies. With the U.S. stepping back from its traditional
                                                                                             role as the enforcer of world order, China is eager to fill the void. Even if the current trade
                                                                                             issues are resolved, the potential for a longer-term conflict between the two countries will
                                                                                             remain. Here’s a snapshot of the many contentious issues causing the conflict.

Source: J. Hatzius, Landing the Plane, Goldman Sachs Economic Research, November 2018

                                                                                                                                                                                           9
2019 Economic & Market Outlook
Chart 15: The Many Layers of U.S.-China Trade Tensions                                       Chart 16: Europe Slowing

                                                                                             Source: FactSet

                                                                                             Emerging Markets

                                                                                             The strong dollar, higher U.S. interest rates and economic slowdown in China all had
                                                                                             a profound impact on emerging markets (EM) last year. Countries with high levels of
    Source: Top Risks 2019, The Eurasia Group, January 2019                                  dollar-denominated debt saw sharply higher interest costs as U.S. rates rose and the dollar
                                                                                             strengthened. Importers of oil and other commodities traded in dollars faced large price
Europe
                                                                                             increases in their local currencies. Economies reliant on commodity exports were hurt by
                                                                                             the falloff in demand from China and overall low worldwide demand for commodities and
Turning to Europe, we see two major risks affecting our 2019 outlook. Since late 2017,
                                                                                             natural resources.
European economic growth has been falling, with Italy at the epicenter. As the third
largest economy in the Eurozone, Italy has a strong bearing on the overall performance of    Chart 17: EM Headwinds
the entire region. The Italian government and the European Commission are at odds over
how much the Italian budget deficit can rise to accommodate earlier pledges for higher
government aid. If they’re unable to come to terms, other populist regimes in Europe may
demand a similar relaxation of deficit targets for their own countries.

The other major risk facing Europe is the fast-approaching March 29 deadline for Britain’s
exit from the European Union. On January 15, the withdrawal agreement was defeated
by the biggest margin in parliamentary history. The next day, Prime Minister May’s
government survived a vote of confidence likely because the alternative, a Corbyn-led
Labour government, is considered worse. However, the odds of a hard Brexit with no
withdrawal agreement in place may be rising.

                                                                                             Source: FactSet
                                                                                                                                                                                     10
2019 Economic & Market Outlook
Our Key Investment Themes For 2019 2. Volatility is back in the picture.
1. The global growth expansion continues. After several years of abnormally low interest rates and expansionary monetary
policy, policy- normalization measures by the Federal Reserve and other central
Although we may be in the later stages of a nearly 10-year expansionary cycle banks contributed to a sharp rise in market volatility in 2018. Unresolved tensions
and global growth is slowing, the overall outlook for 2019 remains promising. over global trade, along with disruptive populist and nationalist forces, all point to
As highlighted in Chart 18, except for well-documented trouble spots such as the continuation of a more volatile macro environment in 2019, with a continued
Argentina, Venezuela, Iran and Sudan, most of the world is expected to generate decoupling of markets from their underlying economic fundamentals.
positive economic growth. Inflation remains in check, and central banks are still in Investors should embrace, rather than be deterred by, the rising volatility. It may
accommodative mode. Additionally, consumers should benefit from low commodity provide opportunities for skilled managers to profitably pursue differentiated
prices. strategies that were less effective when market volatility was suppressed.
Chart 18: IMF 2019 GDP Growth Outlook Chart 19: Volatility has Re-Emerged
Source: IMF DataMapper, World Economic Outlook, IMF, October 2018
Source: FactSet
112019 Economic & Market Outlook
3. The dollar’s bull run may finally be coming to an end. 4. Cash is competitive again. And bonds are not just for income.
Stalling international growth combined with strong U.S. growth fueled the After nearly a decade, cash and bond yields have risen to the point where they now
resumption of the dollar’s bull market in 2018. With rate hikes likely on hold, there offer a tangible alternative to riskier assets.
is less impetus for the dollar to continue rising in 2019, given that we’re already
experiencing tighter financial conditions and diminishing impact from the recent More importantly, 2018 demonstrated that cash and bonds remain valuable buffers
tax changes. A stable to weaker dollar will not only aid U.S. exports, but also benefit during periods of market turmoil. In a year when virtually all asset classes lost value,
global buyers of commodities priced in dollars. It will also provide some welcome the best performing assets were cash (+1.86%) and municipal bonds (+1.64%). (See
respite to emerging market debt and currencies that have been under siege from the Chart 1.)
strong dollar.
Chart 20: Impact of Tighter Financial Conditions and Waning Fiscal Stimulus on Dollar Chart 21: Tangible Yields on Cash and Fixed Income
Source: Federal Reserve Economic Data, Federal Reserve Bank of St Louis, January 2019
Source: J. Hatzius, 2019 Macro Outlook: The Home Stretch, Goldman Sachs Economics Research, November 2018
122019 Economic & Market Outlook
5. In bonds, favor credit over duration. Chart 23: EM Debt Attractive at Current Levels
After the 2018 sell-off, high-yield bonds and emerging markets debt now offer
good value. With defaults well below historical levels and no signs of an impending
recession, wider high-yield spreads going into 2019 offer attractive total returns
(Chart 22). We see comparable opportunities in EM debt.
Chart 22: High Yield Spreads Reflect Benign Economic Conditions
Source: FactSet
6. Equities are likely to rebound and offer compelling value at current levels.
Per Chart 24, global equity markets underwent a significant contraction in price/
earnings multiples when stocks sold off in December:
Chart 24: Equity Multiple Contraction
12-month forward P/E
Source: FactSet
Although full-year returns for both local currency and hard currency debt were
negative, this was largely due to sell-offs in Turkey, Argentina and South Africa early
in the year. During the heightened volatility in Q4, EM debt was one of the bright
spots. This category, which currently offers yields close to 7%, should benefit from
the anticipated end to Fed tightening, the positive outlook for global growth and
expected fiscal stimulus measures in China.
Source: P. Oppenheimer, Bear Necessities, Goldman Sachs Investment Research, January 2019
132019 Economic & Market Outlook
Breaking it out a little further, Chart 25 shows that P/E multiples for U.S. large-cap Chart 26: Value vs. Growth Underperformance for Stocks in MSCI World Index
stocks have retracted five years to their January 2014 levels. While we used U.S.
large-cap stocks as an example, we see comparable re-ratings in small- and mid-cap
stocks, developed international equities and emerging market equities.
Chart 25: Multiple Contraction for U.S. Large-Cap Stocks
Source: P. Oppenheimer, Bear Necessities, Goldman Sachs Investment Research, January 2019
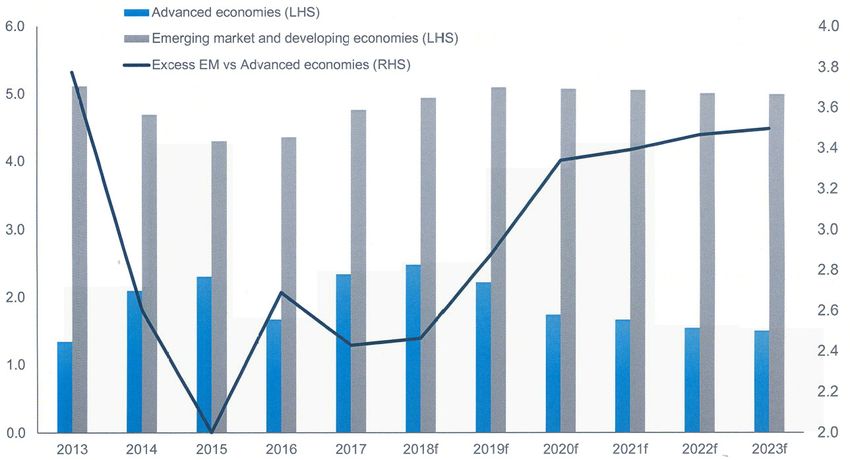
7. Favor emerging markets over developed markets.
Source: FactSet
As shown in Chart 27 on the following page, developed markets (DM) are forecasted
Since the last financial crisis, markets have disproportionately rewarded stocks to have decelerating GDP growth in the coming years, due mainly to the combined
of companies that have demonstrated solid revenue and earnings growth in a challenges of disruptive forces in Europe and chronic fiscal, structural and
low-growth/low-inflation environment. As a result, value stocks have greatly demographic problems in Japan.
underperformed growth stocks over this period. The disparity in relative valuations
approached extremes last seen during the early 2000s tech bubble. In the Q4 sell- Conversely, emerging markets offer superior economic prospects in the long run, plus
off, however, the highest-flying growth stocks experienced the greatest losses, while less risky debt burdens and lower political risk than developed countries. Valuations
value stocks held up better. It appears value stocks may be poised for a turnaround. today for EM equities, developed markets equities and EM debt all provide
However, investors must be careful not to get caught in a value trap and buy cheap compelling opportunities for investors. Current valuation multiples for international
stocks that are deservedly cheap. equities suggest attractive upside, despite the lowered growth expectations.
142019 Economic & Market Outlook
Chart 27: EM vs. DM Real GDP Growth
8. There’s limited upside for commodities in 2019.
With the outlook for slower global growth in 2019, the potential for commodity prices
to appreciate from their depressed levels at year-end appears limited (Chart 28). The
decline followed the sharp drop in oil prices and continued pressure on industrials
metals in the wake of U.S.-China trade tensions. With the possible exception of gold,
which might see prices rise in the event of a flare-up, we don’t see any catalyst for
overall prices to appreciate. Oil prices should be kept range bound, with production
cuts by OPEC and Russia offset by U.S. shale producers, who want to keep production
flowing to cover their marginal costs.
9. Alternative investments have a bigger role in portfolios.
Over the past decade, investors have benefited greatly from the abnormally low
interest rates, stimulative monetary policy and copious liquidity. As the global
central banks now take steps to normalize interest rates and reduce their balance
Source: Emerging Markets 2019 Outlook: Back in Black, Ashmore Investment Management, December 2018 sheets, it will be harder for investors to reap large returns from traditional assets
such as stocks and bonds. After a period of above-average returns from equities,
Chart 28: 2018 Price Movements for Major Commodity Sectors their expected future returns are likely to be lower, and the outlook for bonds is less
favorable when rates are rising.
Hence, investors will need to look beyond the traditional asset classes for
opportunities to generate attractive returns. Additionally, the recent market
gyrations reinforced the necessity to include risk reduction strategies in the portfolio
mix.
For these reasons, we expect alternative asset categories, such as hedge funds,
private equity and private debt, will have an important role in client portfolios in the
coming period. A relatively small number of firms have the capital, global reach and
intellectual resources to address these demands. We are fortunate to work with many
of them, and we intend to utilize their expertise to develop tailored solutions that
help our clients meet their portfolio goals.
Source: 2019 Global Commodities Outlook, JP Morgan, November 2018
152019 Economic & Market Outlook
10. Diversification remains a critical tool for risk control.
Throughout the post-crisis era, U.S. equities have consistently outperformed Real Estate Investment Trusts (REITs), which had been punished by rising interest
other asset categories, leading many clients to question the benefits of portfolio rates and the disruptive transformation of the retail landscape, turned in better
diversification. We believe the market events of Q4 2018 reinforce the case for asset performance than most stocks. And after a decade of punishingly low yields, cash and
allocation. Stocks, the best performing asset class for the last decade, gave back all of bonds turned out to be the only assets that preserved capital in 2018. All of which
their gains for the year and then some within a short period of time. During Q4, U.S. leads us to reiterate that diversification is the single best tool for controlling portfolio
equities vastly underperformed non-U.S. equities. risk. It can be painful to stay the course in periods of declining markets, but as we
saw last quarter, extreme market shifts are unpredictable, and when they occur, well-
diversified portfolios can help weather the storm.
Chart 29: Historical Performance by Asset Class (1999-2018)
Source: Periodic Table of Investment Returns, Callan LLC, January 2019
162019 Economic & Market Outlook
2019 Portfolio Positioning Conclusion
2019 Tactical Weightings Last year was a notably difficult year for investing. Investors focused on risk reduction
Bonds/Cash and capital preservation found themselves too conservatively positioned for strongly
Cash Equal Weight positive markets in the first three quarters of 2018. And investors who discounted the
Taxable Bonds Underweight probability of a downturn as markets continued to rise found themselves fully exposed
Tax-Exempt Bonds Underweight during the severe decline in Q4.
High Yield Equal Weight
Global Bonds Underweight We enter 2019 with the outlook for another year of positive economic growth, albeit at a
EM Debt Equal Weight slightly lower rate than in 2018. While we expect more of the volatility and uncertainty
that roiled markets in 2018, we also enter the year with what might be considered a clean
Equities slate: Equity valuations have recalibrated lower and now offer considerably more upside
US Large Cap Overweight
US Small/Mid Cap Overweight to investors. Spreads on high-yield bonds and EM debt have widened to where investors
Europe Overweight are fully compensated for being in these asset classes, while default risk remains low and
Japan Equal Weight there is no sign of a recession on the horizon. If anything, the key risk investors face today
Pacific ex-Japan Equal Weight is being too conservatively positioned in response to the recent market sell-off to take full
Emerging Markets Overweight advantage of these opportunities.
Real Return & Specialty
Commodities Underweight
TIPS Underweight
REITs Underweight
Real Estate/Infrastructure Equal Weight
Hedge Funds Equal Weight
Private Assets Equal Weight
172018 Scorecard
In our 2018 Outlook, our Investment Committee presented the themes we expected to drive markets last year. Here’s how our predictions turned out:
BC MUNI
MSCI ACWI S&P 500 R2000 MSCI EAFE MSCI EM BC AGG BAML HY
1-10
-9.42% -4.38% -11.01% -13.79% -14.58% 0.01% -2.26%
1.64%
Theme: Policy normalization will influence markets in 2018. Theme: The dollar’s recent bull cycle still has room to run in 2018.
What we said: We’re not convinced the dollar’s bull cycle has run its course. U.S.
What we said: The Fed will continue the path to normalization in 2018. We expect
interest rates are higher than those in other countries. The Fed is determined
the ongoing impact of these moves will be restrained, and the actual trajectory of
to proceed with policy normalization, while other central banks remain
rate hikes will be lower than the Fed indicates.
accommodative. This should help support the dollar in 2018.
Were we right? Yes Were we right? Yes
What really happened: The Fed raised the Fed Funds rate 0.25% four times in What really happened: The U.S. Dollar Index, which measures the value of the
2018 for a cumulative increase of 1.0%. By comparison, the benchmark 10-year dollar relative to a basket of currencies of major trade partners, rose from 91.87 at
Treasury yield rose by just 0.27%, from 2.42% at the beginning of 2018 to 2.69% at the beginning of 2018 to 96.17 at year-end. Aside from higher U.S. rates, the dollar
year-end. also benefited from its safe haven status during periods of market turmoil.
Theme: Abnormally low market volatility may be behind us. Theme: International equities are likely to outperform U.S. equities.
What we said: U.S. equities are trading at a premium to their long-term
What we said: As the Fed reverses course, the abnormally low market volatility of valuations while international equities are priced at a discount. We see an
recent years will revert to more normal levels. opportunity for international markets to outpace U.S. markets as other countries
regain economic momentum.
Were we right? Yes Were we right? No
What really happened: VIX began the year at 9.77 and ended the year at 25.42, What really happened: Non-U.S. stocks performed considerably worse in 2018.
a 160% rise. During the February and December market sell-offs, the index The MSCI EAFE Index was down for the year (-13.79%) due to declining growth in
registered interim spikes to 37.32 on February 5 and 36.07 on December 24. (VIX Europe, turmoil over Brexit, the Italian deficits and structural weakness in Japan.
is the CBOE Volatility Index. It reflects investors’ expectations of fluctuations in And the slowdown in China, the U.S.-China trade conflict and spillover impact on
the S&P 500 index over the next 30 days. Readings below 20 are considered low, emerging markets took a toll on MSCI EM. These macro issues overshadowed the
while readings above 30 reflect higher expected risk.) wide disparity in valuations between U.S. and non-U.S. equities.
Index Key for Benchmarks can be found on page 20.
182018 Scorecard (continued)
Citi WGBI JPM EMBI MSCI REIT BC TIPS BCOM Oil WTI Gold HFRI
2.60% -4.61% -4.57% -1.26% -11.25% -20.70% -2.70% -3.92%
Theme: Emerging market (EM) equities should outperform developed
Theme: Inflation will re-emerge.
markets (DM).
What we said: We’re finally seeing signs of a pickup in inflation globally, and
What we said: The big growth differential between developed and emerging
commodities and real assets could help protect purchasing power. However, with
markets, coupled with cheaper valuations and higher earnings growth for EM
global demand still weak, we don’t see a catalyst for commodity prices to rise,
equities, all favor emerging markets.
absent a big U.S. infrastructure program.
Were we right? Partly Were we right? Yes
What really happened: Allocations to real estate investment trusts, also known
What really happened: EM momentum was hurt by fears that the U.S.-China
as REITS (-4.57%), helped offset bigger declines in equities last year, while illiquid
trade conflict could exacerbate the slowdown in China and cause disproportionate
investments in real estate and infrastructure helped to buffer portfolios from
collateral damage to EM economies. However, we’ll take some credit because EM
the market disruptions. As expected, without a catalyst to spur demand, the
equities (-7.56%) performed considerably better than DM (-12.75%) during the
Bloomberg Barclays Commodity index fell 11.25% in 2018. The 20.7% drop in WTI
critical Q4 selloff.
crude oil helped to keep inflation in check.
Theme: Bonds are an effective diversifier within portfolios. Theme: Hedge funds are finally getting some respect.
What we said: Global bonds remain our least-favored asset class because What we said: Current market conditions call for continued exposure to hedge
a significant portion still trade at negative yields. Conversely, we view U.S. fund strategies. With equity valuations stretched and bond markets subject to
Treasuries and municipal bonds as key safe havens for U.S. investors during higher interest rates and central bank actions, hedge funds may be a useful tool to
periods of market distress. control portfolio risk.
Were we right? Partly Were we right? Yes
What really happened: We had minimal exposure to global bonds (+2.6%),
What really happened: The 3.9% drop in the Hedge Fund Research Index (HFRI)
which turned out to be a top-performing asset category for 2018 due to the safe
was smaller than the losses registered by global equity markets for calendar 2018.
haven role of the euro, yen and Swiss Franc. However, we certainly benefited from
In the critical month of December, HFRI fell just 1.6% versus drops of 9.0% in the
widespread allocations to municipal bonds (+1.64%), which also acted as a safe
S&P 500, 11.0% in the Russell 2000, 4.8% in MSCI EAFE and 2.7% in MSCI EM.
haven and helped preserve investor capital..
192018 Scorecard (continued)
Theme: Private markets offer continued opportunity. Theme: Asset allocation remains critical to wealth creation.
What we said: We’re focused on the public debt and equity markets for our core What we said: Markets are inherently unpredictable, and a disciplined approach
offerings, but we’ll also look to the private markets for attractive opportunities. to asset allocation is the best tool for long-term wealth creation.
Were we right? Yes Were we right? Yes
What really happened: Investments in private equity and debt provided exposure What really happened: The wide variation in returns during the most disruptive
to investment themes that are not accessible in public markets. They also served market periods in 2018 demonstrated conclusively that asset allocation is a vital
as a welcome buffer from the daily market gyrations during a turbulent year tool, both for controlling portfolio risk as well as for creating long-term wealth.
Index Key
MSCI ACWI MSCI All Countries World Index (global equity benchmark)
R2000 Russell 2000 Index (U.S. small-cap equities)
MSCI EAFE MSCI Europe Australia Far East Index (developed non-U.S. equities)
MSCI EM MSCI Emerging Markets Index (emerging market equities)
BC AGG Barclays Capital U.S. Aggregate (U.S. taxable bonds)
BC MUNI Barclays Capital U.S. Municipal 1-10 year Index (1 to 10-yr U.S. municipal bonds)
BAML HY Bank of America Merrill Lynch High Yield (high-yield bonds)
Citi WGBI Citigroup World Government Bond Index (developed country sovereign bonds)
JPM EMBI JP Morgan Emerging Market Bond Index (USD emerging country bonds)
MSCI REIT MSCI U.S. Real Estate Investment Trust Index (U.S. publicly traded REITs)
BC TIPS Barclays Capital Treasury Inflation Protected Securities Index
BCOM Bloomberg Commodity Index
WTI Crude West Texas Intermediate Crude Oil price
HFRI Hedge Fund Research Index Fund-of-Funds Composite Index
20Fourth Quarter Performance Summary
YTD
Asset Class Benchmark 4Q18 Performance Summary
Return
Yields on cash are finally starting to rise in response to the Fed tightening. With most other asset categories
Cash Citi 3-month T-bill 0.57 1.86 experiencing large drawdowns in the turbulent markets of 2018, cash was the best-performing asset class last
year.
Along with other fixed-income categories, municipal bonds benefited from the massive move by investors into
safer assets. This shift led to high quality/lower-yielding bonds outperforming lower quality/higher-yielding
Bloomberg Barclays Municipal
Domestic Tax-Exempt 1.61 1.64 assets, a reversal of the preference for lower credit over quality in the first three quarters of the year. Reflecting
Bond 1-10 Year
improvements in the broader economy, municipal credit quality improved across the board, with Standard &
Poors issuing 2 upgrades and 2 downgrades, compared to 2 upgrades and 17 downgrades in 2017.
Q4 marked a turnaround for the category as investors sold risky assets and moved into safer ones. As would be
expected, Treasury bonds were the biggest gainer, with the Barclays U.S. Government Bond index rising 2.5%.
Bloomberg Barclays U.S.
Investment-Grade Debt 1.64 0.01 Conversely, the Barclays U.S. Credit index was flat for the quarter. Credit spreads widened over concerns of rising
Aggregate
corporate indebtedness and the deteriorating credit quality of U.S. investment-grade bonds, with nearly 50% of
all outstanding debt now rated BBB, the lowest investment-grade rating.
The Q4 sell-off extended to high-yield bonds as part of the broader flight to quality. Credit spreads jumped from
a low of 3.03% over Treasury bonds in early October to 5.26% at year-end, the biggest quarterly rise since 2011.
Merrill Lynch High Yield Energy bonds were hit particularly hard by the 40% drop in oil prices from October to December. With investors
High-Yield Debt (4.67) (2.26)
Master II shunning risky assets, no new high-yield bonds came to market in December, which helped mitigate the impact
of that month's sell-off. At 1.8%, defaults remain low by historical levels, with only one energy-related default in
December.
Global sovereign bonds performed well in Q4 and 2018 despite slowing economic growth and abnormally low
yields in Europe and Japan. As with U.S. Treasury bonds, the category benefited from the global flight to quality.
Citi World Government Bond
Global Bonds 2.38 2.60 Yields on 10-year Japanese government bonds (JGBs) fell from 0.13% to below zero, while 10-year German bond
Index (Hedged)
yields fell from 0.47% to 0.24% and 10-year U.K. gilt yields fell from 1.57% to 1.28%. The European Central Bank
(ECB) confirmed its bond purchase program would end on December 31, 2018.
Although hard currency bonds gained 1.4% in December, Q4 and 2018 returns were negative. Investor concerns
about several issues hurt performance, including the effect of proposed U.S. tariffs on the already-slowing
Emerging Markets Debt JPMorgan EMBI Global (1.19) (4.61)
Chinese economy, the combined impact of U.S. sanctions and low energy prices on the Russian economy, and
unsustainably high external debt levels for Turkey, Argentina and South Africa.
Q4 was a punishing period for large-cap stocks. The S&P 500 index fell 7% in October amid fears of a looming
trade war with China and signs of an overheating U.S. economy that could force the Fed to raise rates more
aggressively. After regaining ground in November on weaker economic data, the index fell a further 9% in
Large-Cap Equity S&P 500 (13.52) (4.38)
December over worries about rising interest rates, signs of slowing global growth and unresolved trade tensions.
The index was down 4.38% for the year, its worst showing since the financial crisis. P/E multiples have now
retracted to January 2014 levels.
21Fourth Quarter Performance Summary (continued)
YTD
Asset Class Benchmark 4Q18 Performance Summary
Return
Contrary to expectations, the domestic focus of smaller stocks did not afford much protection during the sell-off.
Small/Mid Cap Equity Russell 2000 (20.20) (11.01) The Russell 2000 index dropped 11.88% in December for a 20.2% loss for Q4, the worst quarterly performance
since Q3 2011. The index's 11.01% loss for the year was its worst annual showing since 2015.
International stocks fell in unison with the global sell-off in Q4, with investors unnerved by deteriorating global
growth,intensifying trade conflicts and higher U.S. interest rates. The MSCI EAFE's full-year loss of 13.79% was
International Equity MSCI EAFE (12.54) (13.79) considerably worse than the 4.38% drop in the S&P 500. However, the roles were reversed in Q4 and December. In
Q4, MSCI EAFE lost 12.54%, slightly better than the S&P 500's 13.52% loss. In December, MSCI EAFE fell 4.85%
compared to the 9.0% drop in the S&P 500.
With China a major component of the EM index, the US-China trade dispute and the country's deteriorating growth
further dampened investor sentiment. Although the 14.58% full-year loss for MSCI EM was worse than losses for
Emerging Markets Equity MSCI Emerging Markets (7.47) (14.58)
other global markets, MSCI EM materially outperformed other global markets in the Q4 sell-off, with losses of
7.47% for Q4 and just 2.70% for December.
The global flight to quality raised demand for Treasury Inflation-Protected Securities (TIPS) in Q4 and helped
to minimize losses on longer-dated bonds. The spread between 10-year Treasuries and 10-year TIPS, a gauge of
TIPS Bloomberg Barclays TIPS (0.42) (1.26)
investor expectations for future inflation, fell sharply from 2.15% at the beginning of the quarter to 1.71% at year-
end. Lower expectations for inflation will influence the Fed's approach to tightening in 2019.
Low global demand for commodities, the strong U.S. dollar, rising global trade tensions and plunging energy prices
all served to depress commodity returns in 2018. WTI crude oil prices fell 37.5% in the quarter on reports of rising
Commodities Bloomberg Commodity Index (9.41) (11.25)
U.S. stockpiles and uncertain prospects for supply cuts by OPEC and Russia. Gold rose 7.2% in Q4, benefiting from
the market turbulence and indications that further rate hikes from the Fed were put on hold.
Real Estate Investment Trusts (REITs) were considerably less affected by the Q4 market sell-off due to their lower
correlations to equiities. Among REITs, leaders for 2018 included free-standing retail (+13.93%), manufactured
Real Estate MSCI US REIT (6.72) (4.57)
homes (+11.43%), health care (+7.58%) and infrastructure (+6.99%), while laggards included timber (-31.96%),
shopping centers (-14.55%), data centers (-14.11%) and lodging (-12.82%).
Preqin reports that fundraising for private equity (PE) and private debt remained strong in 2018, although below
the torrid levels of 2017. Committed funds awaiting deployment (dry powder) reached a record $1.2T for PE and
$280B for private debt by year-end. PE fundraising is increasingly a two-tier market, with $1B+ funds taking in the
Private Equity/Private Debt No Benchmark n/a n/a majority of capital and a growing share going to the very largest funds. The sharp equity market sell-off in Q4 has
reduced P/E multiples, which should adjust private market valuations to more reasonable levels and help future
capital deployment. In private debt, capital was diverted from direct lending and distressed managers to fund a
surge in mezzanine funding to finance robust buyout activity.
Although returns for both Q4 and 2018 were negative, hedge funds outperformed global equities over both periods,
the category’s best relative outperformance since February 2009. For the critical month of December, the category
Hedge Funds HFRI FOF Composite Index (4.85) (3.92) fell just 1.60%, compared to losses of 9.03% for the S&P 500 and 7.04% for the MSCI ACWI global benchmark.
As expected, equity and event-driven strategies were hurt by falling equity markets in Q4, but defensive and
idiosyncratic strategies, such as market neutral, global macro and managed futures, all generated positive results.
22Fourth Quarter Market Summary
23Fourth Quarter Market Summary (continued)
Source: FactSet, Cerity Partners. Reflects 5-year tenor, broad composite and generic
returns.
Municipal bond yields are shown on a comparable, adjusted basis using a 35% tax
rate.
24Important Disclosures
This document contains general information that is not applicable to everyone. The information contained herein should not be construed as personalized investment advice. Past performance is no
guarantee of future results. There is no guarantee that the views and opinions expressed in this document will come to pass. Information contained herein has been obtained from sources believed to be
reliable but is not guaranteed accurate. Unless otherwise indicated, all information is as of 4Q2018, political and economic changes after that date may impact the accuracy of the information herein and
Cerity Partners LLC (“Cerity Partners”) is not obligated to update this document. Investing in the financial markets involves risk, including the risk of loss of the principal amount invested, and may not be
appropriate for everyone. The information presented is subject to change without notice and should not be considered as a solicitation to buy or sell any security. Information about any index is included
for illustrative purposes only and you cannot invest in one directly. Cerity Partners is an SEC-registered investment adviser with offices in New York, Illinois, Ohio, Michigan and California. For information
pertaining to the registration status of Cerity Partners, please contact us or refer to the Investment Adviser Public Disclosure website (www.adviserinfo.sec.gov). For additional information about Cerity
Partners, including fees and services, send for our disclosure statement as set forth on the Form ADV using the contact information herein. Please read the disclosure statement carefully before you invest
or send money.
©2019 Cerity Partners LLC, an SEC-registered investment adviser. All Rights Reserved. (01/19)
25You can also read