2019 ESG Survey Research - Callan

Page created by Glenn Beck
 
CONTINUE READING
2019 ESG Survey Research - Callan
Research

2019 ESG Survey
2019 ESG Survey Research - Callan
Table of Contents

                    Executive Summary                            2

                    Key Findings                                3

                    Respondent Overview                         4

                    ESG Factor Adoption Rates                   6

                    ESG Implementation                          13

                    Reasons For and Against ESG Incorporation   21

                    Looking Forward                             24

                    Conclusions                                 26

                    About the Survey                            27

                                                                 1
2019 ESG Survey Research - Callan
Executive Summary

Overview                                        Callan’s 2019 ESG Survey, conducted from May to July 2019, reflects input from 89 unique U.S.
                                                institutional investors that were asked about their approach to environmental, social, and governance
                                                (ESG) factors when evaluating investments. For this survey, ESG factors include socially responsible
                                                investing (SRI, including divestment), sustainable investing, responsible investing, impact investing,
                                                and other associated terms.

                                                Our 2019 survey, the seventh we have conducted, found that U.S.-based institutional investors are
                                                increasingly incorporating ESG considerations into their investment decision-making process. The
                                                ratio of investors either incorporating or thinking about incorporating ESG was about half of the
                                                respondent pool in 2019.

Almost half of U.S. institutional investors     Overall, incorporation of ESG factors into the investment decision-making process nearly doubled to
currently consider ESG factors when making      42% in 2019 compared to 22% in 2013. Our survey revealed an ongoing disparity in ESG adoption rates
investment decisions or are considering doing   by investor type and size. Historically, endowments and foundations have consistently had the highest
so in the future.                               ESG adoption rates. Public plans have incorporated ESG factors into the investment decision-making
                                                process at a higher rate than their corporate counterparts.

                                                – ESG was relatively new for most survey respondents: 62% of funds that utilized ESG began doing
                                                   so in the past five years.

                                                – Foundations reported the highest rate of ESG incorporation in 2018 at 64%, but fell to 44% in 2019.
                                                   While 22% of foundations that did not utilize ESG are considering it, the top reason for not
                                                   implementing was a focus on only purely financial factors in investment decision-making.

                                                – 49% of public funds incorporated ESG in 2019, up from 15% in 2013.

                                                – The survey respondents with more diverse boards were more likely to be incorporating ESG into
                                                   investment decisions than those with less diversity as gauged by differences in gender, race,
                                                   ethnicity, and age.

                                                                                                                                                         2
Key Findings

Callan’s seventh annual ESG Survey
                                            Most Common Implementation: Integration
presents trends on ESG adoption for
U.S. institutional investors. The results                                                   of large funds (>$20bn)
reflect input from 89 unique                            of those that incorporated ESG      have incorporated ESG
organizations, and highlight growing        51%         considered ESG factors with every
                                                        investment/manager selection
                                                                                            factors into investment
                                                                                            decisions
adoption of ESG practices.

   Diversity                                                                                49%
   Effect                                   42%            incorporated ESG factors
                                                           into the investment
                                                                                            of respondents that
   Investors with more diverse                             decision-making
                                                                                            incorporated ESG plan to
   boards/committees were                                  process—up from 22%              seek more, better, or
   more likely to incorporate                              in 2013                          different ESG data in the
   ESG                                                                                      future

                                                               44%                          Investment
                                                                                            managers &
    36%                                                      foundations
                                                                                            general
    of defined contribution                     58%                           49%           consultants were
                                              endowments                      public        the most common sources
    plans featured an ESG
    option in the plan lineup                                  19%                          of data to evaluate ESG
                                                              corporate                     strategies

                                                                                                                        3
Respondent Overview

                                                                   Respondents by type

89 institutional investors responded to the                                Foundations
                                                                           18%
survey

                                                                                                                   Public
                                                                     Endowments                                    42%                      Public Defined Benefit (33%)
                                                                     13%
42% of respondents were public plans,                                                                                                       Public Defined Contribution (7%)
making them the largest plan type represented                                                                                               Other Public Plans (2%)
                                                                            Other                      Corporate
24% of respondents were corporate plans,                                     3%                        24%
                                                                                                                                            Corporate Defined Benefit (12%)
and around one-third are endowments or
                                                                                                                                            Corporate Defined Contribution (6%)
foundations
                                                                                                                                            Other Corporate Plans (6%)

36% of respondents were “small” funds with
less than $500 million in assets. The 2019                         Respondents by size
                                                                                         > $20bn 11%
survey had fewer large funds than in previous
years: 11% of 2019 respondents had more than
$20 billion in assets, compared to 20% in 2018.
Respondent Overview (continued)

                                                   Respondents by sector

Most respondents were from the government
(31%), nonprofit (26%), education (12%), and
health care (11%) sectors. “Other” includes:
aerospace/defense, professional services,
technology, and philanthropy.                                                                                  Government (31%)
                                                                                                               Nonprofit (26%)
                                                                                                               Education (12%)
                                                                                                               Health Care (11%)
                                                                                                               Energy/Utilities (6%)
                                                                                                               Manufacturing (6%)
                                                                                                               Other (4%)
                                                                                                               Insurance (3%)

Looking at ESG incorporation rates by
sector, we note that education tops

           55%
its peers at
                                                   Investors incorporating ESG factors into investment decisions by sector

Government, health care, and nonprofit                                                                       55%
industries all have higher rates of ESG adoption
than other sectors that responded to our survey,                         50%               50%
                                                       48%
including energy/utilities, manufacturing,
insurance, and other.

                                                     Nonprofit        Government        Health Care       Education

                                                                                                                                       5
ESG Adoption Rates

                                                  Does your fund incorporate ESG factors into investment decisions?

42%
of respondents incorporated
ESG factors into investment decisions in
2019, consistent with 2018 and nearly double
the 22% we recorded when first conducting            Yes   42%                         No   57%                       Not sure 1%
this survey in 2013. ESG adoption has
steadily climbed in the U.S.

91%
increase in respondents that have incorporated
ESG factors into investment decisions from 2013
to 2019                                           ESG adoption shows steady increase

                                                                                                              43%        42%

                                                                                            37%    37%

                                                                             29%
                                                                  26%
                                                       22%

                                                      2013       2014       2015        2016      2017       2018       2019

                                                                                                                                6
ESG Adoption Over Time

                                                      When respondents first incorporated ESG factors into the
                                                      investment decision-making process
ESG is a relatively new phenomenon for
most survey respondents.

                                                                                                                            19%   19%
62%
of investors that utilize ESG began doing so in the
past five years.

Throughout the survey, we note differences in           11%                                                           11%
implementation between early adopters of ESG
(before 2015) and more recent adopters (2015-19)                                                    8%   8%

                                                                                                                 5%

                                                              3%   3%    3%   3%   3%    3%   3%

                                                       Before 2000 2003 2005 2008 2010 2011 2012 2014 2015 2016 2017 2018 2019
                                                        2000

                                                                                                                                        7
ESG Adoption Rates by Investor Type

                                                    Investors incorporating ESG factors into investment decisions

58%                                                           49%
                                                                                                                58%

of endowments incorporated ESG factors into                                                                                              44%

investment decisions, the 2019 survey found.
Over time, endowments and foundations have                                               19%

incorporated ESG factors at a higher rate than
                                                    Public                   Corporate                  Endowments            Foundations
other institutional investor types Callan has
surveyed. Codifying a definition of ESG that is
consistent with the organization’s overall goals
and philosophy is often the first step in           By type over last seven years
implementing ESG into investments; this can be
                                                     Foundation     Endowment     Foundation   Endowment       Foundation   Foundation      Endowment
a more straightforward process at mission-
                                                     35%            34%           39%          53%             56%          64%             58%
focused endowments and foundations than
other investor types.
                                                     Endowment      Foundation    Endowment    Foundation      Endowment    Endowment       Public
                                                     22%            31%           37%          48%             39%          56%             49%
Defined benefit (DB) and defined contribution
(DC) plans, both public and corporate
combined, incorporated ESG at a rate of 35%          Public         Public        Public       Corporate       Public       Public          Foundation
and 36%, respectively (not pictured). This           15%            22%           27%          30%             35%          39%             44%
represents a shift for DC plans, which previously
had much lower ESG utilization rates than DB         Corporate      Corporate     Corporate    Public          Corporate    Corporate       Corporate
plans.                                               14%            16%           15%          25%             25%          20%             19%

                                                      2013          2014          2015         2016            2017         2018            2019

                                                                                                                                                         8
ESG Adoption Rates by Investor Size

                                                           Investors incorporating ESG factors into investment decisions
                                                     85%

                                                     80%

50%
                                                     75%

                                                     70%

                                                     65%

                                                     60%

                                                     55%

of the largest respondents (>$20 bn)                 50%

                                                     45%

                                                                                        50%                                                 50%
incorporated ESG factors into investment
                                                     40%

                                                     35%

                                                     30%
                                                                   38%                                              35%
decisions in 2019. The largest institutional         25%

                                                     20%

                                                     15%

investors have incorporated ESG factors at the       10%

                                                     5%

highest rate since the survey’s inception in
                                                     0%

                                                           < $500mm                $500mm to $3bn             $3bn to $20bn            > $20bn
2013. Larger organizations tend to have more
resources to facilitate ESG adoption. But size
and resources are becoming less relevant in                By fund size over last seven years
predicting ESG adoption.
                                                            > $20bn      > $20bn      > $20bn       > $20bn         > $20bn     > $20bn          > $20bn

                                                            33%          31%          35%           71%             78%         72%              50%
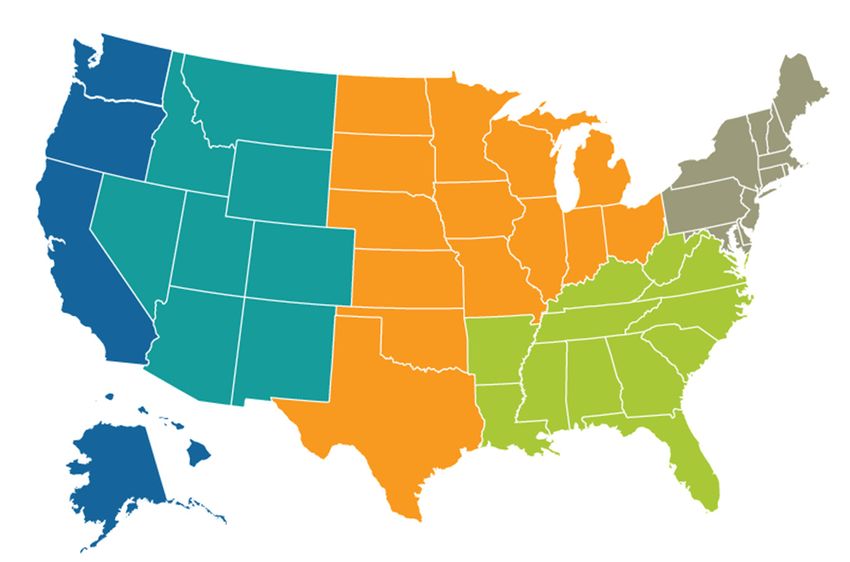
50%                                                         $3bn to      $500mm to    $3bn to
ESG Adoption Rates by Region

                                                    Regional breakdown of ESG incorporation

52%
of investors in the Northeast region surveyed
in 2019 incorporated ESG into investment
decisions.
                                                        43%
Investor type and size, rather than region, tend                                           31%                                  52%
to be more consistent factors in whether an
investor will use ESG factors in investment                          43%*
decision-making.

In the seven years Callan has produced the
ESG survey, we’ve observed varying                                                                       46%                Pacific (14)
                                                                                                                            Mountain (7*)
regional trends in ESG adoption that suggest                                                                                Central (32)
location plays little role in whether a fund will
                                                                                                                            Northeast (23)
implement ESG. Since 2013, all regions have
                                                                                                                            Southeast (13)
seen an increase in ESG adoption except for
the Central U.S.

                                                                                                                     2019
                                                                                                                     52%                   2019
                                                              2019               2019
                                                                                                                                           46%
                                                              43%                43%*     2013
                                                                        2013                      2019
                                                                                          36%
                                                                        16%                       31%
                                                      2013                                                 2013               2013
                                                      20%                                                  23%                21%

                                                    Pacific           Mountain          Central          Northeast          Southeast
*Note the small sample size

                                                                                                                                                  10
ESG and Board Demographics

                                                                           Investors incorporating ESG factors into investment decisions: variations by
                                                                           board/investment committee makeup
Diversity matters
                                                                                                                                                     57%
Survey respondents provided details on the                                                                                                                                   50%
demographics of their investment committees,                                          42%                             39%
boards, or other decision-making bodies. Most
boards tended to be majority white males over
the age of 40.                                                             All respondents                30%+ female                    30%+ minority            30%+ under 40
The more diverse boards were more likely to be
incorporating ESG into investment decisions:
‒   Investors with 30% or more minorities (14
    total) had an ESG adoption rate of 57%
                                                                           Total respondents: Board/Committee demographic profile*
‒   Investors with 30% or more of the board
    under 40 (12 total) had an ESG adoption
    rate of 50%                                                                      32%                                      77%                               82%
                                                                                    Female                                                                  Older than 40
‒   Investors with 30% or more women on the
    board (44 total) incorporated ESG at a 39%
    rate, slightly lower than the overall
                                                                                      68%
    population. But investors with 50% or more
                                                                                      Male
    women on the board (17) reported an
    ESG incorporation rate of 53%.

                                                                                                                             23%
                                                                                                                            Minority                            18%
                                                                                                                                                           Younger than 40

*Sample size note: all 89 respondent funds reported on percentage male; 55 and 54 responded as to percentage minority and aged under 40, respectively.

                                                                                                                                                                                   11
Looking Forward

                                                        If you have not incorporated ESG factors into investment decisions, are you
                                                        considering it?
Room to grow
                                                         100%
12%
of respondents that have not yet incorporated             80%
ESG into investment decisions are
considering doing so in the future. This figure           60%                                                                       No
has fluctuated from 10-20% over time,                                                                                               Yes
suggesting that more investors will explore
                                                          40%
and implement ESG in the future.
                                                                                           22%
                                                          20%                                                   15%
                                                                  9%   11%        11%                  7%
                                                                                                                       12%
By type, 22% of foundations, 16% of public                 0%
plans, and 6% of corporate plans that have                   2013      2014        2015    2016       2017     2018       2019
not incorporated ESG into investment
decisions are considering doing so. None of
the endowments surveyed that are not
incorporating ESG are considering doing so.       50%
                                                        Share of respondents that have not incorporated ESG factors into investment
Endowments have the highest ESG                   45%   decisions but are considering it (by investor type)
                                                  40%

incorporation rates (58%) in 2019’s survey.       35%

                                                  30%

                                                  25%

                                                  20%

                                                  15%                                                                        22%
                                                  10%
                                                                 16%
                                                  5%

                                                  0%
                                                                                    6%               0%
                                                        Public                Corporate           Endowments          Foundations

                                                                                                                                          12
ESG Implementation: Early vs. Recent Adopters

                                                   How investors are incorporating ESG*

Integration is becoming the preferred                     Considered ESG factors with every                                                             64%
method of implementation, particularly for early    investment/investment manager selection                                        43%
adopters of ESG: 64% of early adopters                                   Added language to                                                              64%
consider ESG factors with every investment.                      investment policy statement                                   39%

                                                     Communicated to investment managers                                                        57%
The Principles for Responsible Investment           that ESG is important to the organization                                35%
defines ESG integration as “the explicit and
                                                                                                                                         50%
systematic inclusion of ESG issues in                        Pursued education around ESG
                                                                                                                                                57%
investment analysis and investment decisions.”
                                                                                                                                   43%
                                                           Incorporated a screening process
Thematic ESG funds are separate from ESG                                                                        22%

integration, although they often do integrate                      Hired a manager/strategy                                        43%
                                                                  that has incorporated ESG                           26%
ESG criteria into investment decisions.
Thematic ESG funds often have a fund name                                                                              29%
                                                       Added language to investment beliefs
that conveys which tenet of ESG is central to                                                               17%
the investment thesis (e.g., Social Equity,                 Divested from a certain industry,                          29%
Climate Change Aware, etc.)                                             sector, or other area               17%

                                                               Scored investment managers                       21%                  Early Adopters (before 2015)
For recent adopters, ESG education is the most                           using ESG metrics           9%
                                                                                                                                     Recent Adopters (2015-2019)
common action (57%). Half of early adopters
                                                                   Hired a manager/strategy                     21%
also pursue ESG education, signaling the                                 for impact investing                   22%
importance of ongoing learning to keep up with     Engaged with management, actively voted                      21%
changes in the field.                                 proxies, and/or submitted shareholder
                                                                                 resolutions          13%
On average, early ESG adopters selected 5                             Added an ESG option                 14%
implementation strategies to indicate how they                        to the DC plan lineup          9%
are incorporating ESG, compared to 3 for the                                                              14%
                                                                          Hired a consultant
recent adopters.                                                                                4%

*Multiple responses allowed

                                                                                                                                                                    13
Separate ESG Allocation

                                                     Distinct allocation dedicated to ESG separate from the traditional portfolio

As ESG integration is emerging as the most
                                                                                         68%
popular implementation method in the U.S., less
than one-fifth of survey respondents separate
their ESG investments.

16%
of investors who have incorporated ESG factors
into the investment decision-making process
                                                                16%                                                 16%
made a distinct allocation to ESG investing. This
is a common implementation approach for
defined contribution plans; adding a standalone                 Yes                      No                Not Sure/No Response
ESG option can be a direct way of offering plan
participants a sustainable investment choice, for
example.                                              If your endowment or foundation receives new donations, do you maintain
                                                      a separate portfolio 100% dedicated to ESG for donors that desire this type
Endowments and foundations also might utilize
                                                      of investment strategy?
this approach by creating a carve-out of the
main portfolio for targeted ESG investments, or
a specific donor pool dedicated to an ESG                                                      20%
theme. Out of 10 funds surveyed that responded
to this question, only two maintained a separate
portfolio 100% dedicated to ESG, reinforcing the
notion that ESG integration is likely to be a more
                                                                                       80%
widely embraced implementation strategy going
                                                                                                              Yes
forward.
                                                                                                              No

                                                                                                                                    14
ESG Data Sources

                                                  ESG data sources to evaluate managers/investment strategies*

Quantifying ESG
As ESG gains momentum in the investment
                                                             Directly from the manager                             54%
industry, the issue of how to quantify and
measure ESG in investments arises regularly.

Investors tend to use multiple sources for data                    General consultant                            51%
to evaluate investment managers/strategies on
their ESG capabilities and outcomes; 2019
survey respondents used 2 sources, on
                                                                  Specialty consultant                22%
average. The investment manager and the
general consultant were the most prevalent
sources of information. Many managers
incorporating ESG include strategy-specific                                     MSCI                19%
metrics, such as carbon footprint, diversity
statistics, or progress relative to a UN
Sustainable Development Goal.
                                                                                Other         14%

Early ESG adopters (implemented ESG before
2015) were more likely to use a general or
specialty consultant than those recently                                   Bloomberg     5%
adopting ESG.

Other ESG data sources included manager
                                                                        Sustainalytics   5%
proxy voting records, staff, outsourced chief
investment officer, and the Principles for
Responsible Investment.

*Multiple responses allowed

                                                                                                                         15
ESG Implementation: To Avoid

                                                                          Industries/sectors/companies avoided/excluded per ESG policies*

While ESG integration is quickly becoming the
most common implementation method for ESG,                                                                                                                 27%
negative screening and divestment still play a                                                                Tobacco                                        29%
role: 43% of early ESG adopters and 22% of                                                                                                                26%

recent adopters have incorporated a screening                                                                                                    19%
                                                                                                                 Other                                                         43%
process, respectively, and 29% of early
                                                                                                                           4%
adopters and 17% of recent adopters have
                                                                                                                                             16%
divested from an issue.                                                                            Weapons /defense                        14%
                                                                                                                                              17%
For all respondents incorporating ESG,
                                                                                                                                       14%
tobacco was the most common area to divest
                                                                                                                Alcohol                                     29%
from. For early adopters, divestment was                                                                                   4%
spread across “other” areas (climate change-                                                                                         11%
related sectors such as thermal coal and oil                                                               Fossil fuels                    14%
sands, and recreational cannabis and                                                                                             9%
vaping), but alcohol and gambling were                                                                                               11%
common areas to avoid as well.                                                                               Gambling                               21%
                                                                                                                           4%
                                                                                                                            5%
                                                                                                        Private prisons    0%
                                                                                                                                                              All Adopters
                                                                                                                                 9%
                                                                                                                                                              Early Adopters (before 2015)
                                                                                                                            5%
                                                                                   Companies with poor labor practices     0%                                 Recent Adopters (2015-2019)
                                                                                                                                 9%
                                                                                                                           3%
                                                                              Religious screen (e.g., Islamic, Catholic)        7%
                                                                                                                           0%

*Multiple responses allowed
“Other” also includes pornography, abortion, fetal research, and for-profit education.

                                                                                                                                                                                             16
ESG Implementation: To Embrace

                                                      Positive impact investments intentionally included per ESG policies*

Impact investing, thematic ESG funds, and ESG
integration can all target specific areas for                                                                                                        22%
investment that emphasize financial returns in                      Local economic benefit                                                           21%
addition to positive societal or environmental
                                                                                                                                                     22%
change.
                                                                                                                              14%
Areas targeted for positive change from survey                                  Clean tech                                      14%
respondents included local economic benefit,                                                                                  13%
the environment, clean tech, diversity/inclusion,
                                                                                                                        11%
poverty alleviation, and education.
                                                                              Environment                                      14%
“Environment” areas flagged for positive impact                                                                    9%
include clean energy, sustainable and
                                                                                                               8%
regenerative agriculture, the transition to a low-
                                                                       Diversity / inclusion                                    14%
carbon economy, water (access to and waste
                                                                                                    4%
water solutions), and pollution. Additional “other”
categories include general impact investing in                                                                 8%                     All Adopters
private equity, ministry support, and church                            Poverty alleviation                   7%                      Early Adopters (before 2015)
investment.                                                                                                        9%                 Recent Adopters (2015-2019)
                                                                                                               8%
                                                                                     Other                                     14%
                                                                                                    4%

                                                                                                         5%
                                                                                Education      0%
                                                                                                                   9%

*Multiple responses allowed

                                                                                                                                                                 17
ESG and Defined Contribution Assets

Defined contribution (DC) plan assets are          ESG in defined contribution plans*
increasingly reflecting ESG incorporation.
                                                                No ESG option 64%

36%
of DC plans surveyed (both public and
corporate) said there was an ESG option in their
plan lineup. For context, 18% of plans in
Callan’s DC Index™ offered a thematic ESG
                                                                                                                            ESG option in DC
fund option (fund name conveys ESG
                                                                                                                            plan lineup
approach), up slightly from 16% in 2018.                                                                                    36%

While thematic ESG funds are increasing, so is
                                                   Callan DC Index: Prevalence of ESG thematic vs. integrated funds by plans
the number of funds using ESG integration
(i.e., employing ESG data and considerations
in the investment analysis process), and this is
a far more prevalent approach. Less than 1%                           94%
of the 2,400+ fund options in the DC Index
were thematic ESG options, but 20% of the
funds indicated they integrate ESG into the
investment process. And while only 18% of
plans have added an ESG-themed fund to the
lineup, the vast majority of plans (94%) had
                                                                                                                 18%
exposure to ESG-managed assets (i.e., at least
one fund manager indicates they use ESG                     Have at least one ESG                      Have at least one ESG
                                                           integrated fund in lineup                   thematic fund in lineup
considerations in the investment process).

                                                   *Note the small sample size. Responses from 11 DC plans, 4 of which have an ESG fund in the lineup and one of which is also
                                                   integrating ESG in other ways (integrated fund; consider ESG with all fund selection, pursuing education, etc.)
                                                   **Source: Callan DC Index™, first quarter 2019.

                                                                                                                                                                                 18
Environmental Actions

                                                     Actions taken specific to “E” for those incorporating ESG
27%
We asked respondents that incorporate ESG                                                            Implemented          Explored
what actions they have explored or taken
specific to environmental concerns, such as                                                                        11%
                                                                                        Scope 1
climate change. The most common                                                  direct pollution                                    22%
environmental action taken by those that have
implemented ESG was to allocate a portion of                 Carbon footprint          Scope 2                8%
                                                      portfolio measurement           electricity
assets to positive environmental impact                                                                                    16%
strategies (27%).                                                                     Scope 3                            14%
                                                                                supply chain &
                                                                                  use/disposal                           14%
24%                                                                                                                11%
                                                                        Partial decarbonization
Shareholder advocacy was the second most                                         of the portfolio                  11%
common action taken around “E” (24%).
Investors see company engagement—through                                        Specific carbon          5%
                                                                                 footprint target
proxy voting and other measures—as an                                                                    5%
effective tool to mitigate the worst effects of
                                                                       Full divestment of fossil    3%
climate change.                                                                fuel investments               8%

Carbon footprint portfolio measurement is                         Allocated a portion of assets                                              27%
being explored and implemented by around 10-                          to positive environmental
                                                                               impact strategies         5%
20% of ESG investors. Several global reporting
initiatives related to climate change, such as the                                 Shareholder                                         24%
Task Force on Climate Change Financial                                               advocacy                      11%
Disclosures, are creating frameworks and
                                                                                                                         14%
standards for investors and companies to report                                           Other
                                                                                                    3%
on climate-related risks and opportunities.

*Multiple responses allowed

                                                                                                                                                   19
Organization Membership

                                                 Organization membership by those incorporating ESG*

65%
                                                                                    None                 65%
Most survey respondents implementing ESG
have not joined any organization to support
efforts at education, collaboration, and
commitment around ESG issues (65%) .              Principles for Responsible Investment            19%
Those that participated with third-party
organizations did so with two groups, on
average.                                                Council of Institutional Investors         19%

19%
The two most prevalent ESG-centric member                                          Other          16%
organizations for survey respondents were the
Principles for Responsible Investment and the
Council of Institutional Investors (19% each).   US SIF: The Forum for Sustainable and
                                                                                             8%
                                                               Responsible Investment
Other organizations include Mission Investors
Exchange, U.S. Impact Alliance, U.S. Council
on Impact Investments, Confluence                                                  Ceres     5%
Philanthropy, Catholic Healthcare Investment
Guidelines, Global Impact Investing Network,
BALLE, and ICGN.

*Multiple responses were allowed

                                                                                                               20
Reasons for Incorporating ESG: Early vs. Recent Adopters

                                                  Reasons for incorporating ESG factors into the investment
                                                  decision-making process*
When comparing the early adopters’
motivations for incorporating ESG to the recent
adopters, we note recent adopters are more                                                                             50%
                                                                          Fiduciary responsibility
likely to be addressing stakeholder concerns
                                                                                                                             57%
and to be focused on an improved risk profile.

                                                                                                                       50%
                                                                   To align our portfolio with our
                                                                           organization's values
                                                                                                                                     65%

                                                                                                                 43%
Adoption Timeframes                                     Stakeholder concerns (board members,
Before 2015 (14) and after (23)                                  advocacy groups, employees)
                                                                                                                                 61%

                                                                                                           29%
                              Before
                               2005                                         Improved risk profile
          2019
          19%                  16%                                                                               43%

                                                                                                           29%
                                       2005 -         To utilize our investment fund to make an
                                        2014       impact (e.g., job creation, affordable housing)
                                                                                                     17%
                                        22%
         2015 -
          2018                                                                                             29%
          43%                                                                                                    Early Adopters (before 2015)
                                                                        Higher long-term returns
                                                                                                     17%         Recent Adopters (2015-2019)

*Multiple responses allowed

                                                                                                                                                21
Reasons for Incorporating ESG

                                                    Reasons for incorporating ESG factors into the investment
                                                    decision-making process*
                                                                                                                    Foundations         Endowments
Institutional investors in the U.S. adopted ESG
                                                                                         All respondents            Corporate           Public
for various reasons. The top reason across fund
types was to align the portfolio with the                                                                                                       100%
organization’s values, which can be easier to          To align our portfolio with our                                            57%
                                                                                                            59%
                                                               organization's values                                                            100%
achieve at some organizations, such as those
                                                                                                                        33%
with a mission statement that clearly articulates
an ESG initiative.                                                                                                        43%
                                                                                                                  14%
                                                              Fiduciary responsibility                     54%
                                                                                                                                      75%
54%                                                                                                                                 67%

of respondents looked to ESG to fulfill their                                                                                           71%
fiduciary responsibility and to address                                                                                                       86%
                                                               Stakeholder concerns                        54%
stakeholder concerns—for endowments this                                                                                      50%
                                                                                                                        33%
was particularly relevant (86%).
                                                                                                                          43%
According to respondents, stakeholders                                                                            14%
                                                                Improved risk profile               38%
included student groups, donors, board                                                                             0%
                                                                                                                                  56%
members, investment staff, and employees.
                                                                                                                                  57%
                                                    To utilize our investment fund to                               29%
                                                                                           22%
                                                                      make an impact                               25%
                                                                                                                   6%

                                                                                                                  0%
                                                                                                                  0%
                                                            Higher long-term returns       22%
                                                                                                                    25%
                                                                                                                      33%

* Multiple responses allowed

                                                                                                                                                       22
Reasons Against ESG Incorporation

                                                        Reasons for NOT incorporating ESG factors into the investment
                                                        decision-making process*
53%                                                                                             All respondents
                                                                                                                             Foundations
                                                                                                                             Corporate
                                                                                                                                                 Endowments
                                                                                                                                                 Public
of investors that are not incorporating ESG
indicated they will not consider any factors that are                                                                                              44%
                                                           My fund will not consider any
not purely financial. Emerging research supports              factors that are not purely                                                        40%
                                                                                                                  53%
                                                             financial in our investment                                                                 53%
the notion that ESG issues can have material                            decision-making
                                                                                                                                                               61%
financial impacts in certain investment situations.
For example, the CFA Institute “sees value in the                                                                                  22%
incorporation of ESG data into the investment             Lack of research tying ESG to                                                           40%
                                                                                                       33%
process, but it is agnostic on the value-investing                      outperformance                                                           41%
argument more pertinent in the SRI community.”                                                                                           28%

Other reasons for not implementing ESG:                                                                                            22%
                                                                                                                        0%
‒   Limited or no participant interest/demand                  Unclear value proposition              31%
                                                                                                                                                 41%
‒   Perceived political activism/unintended
                                                                                                                                           33%
    political consequences
                                                                                                                                   22%
‒   Concerns of breach of fiduciary duty                  I don't know how ESG factors
                                                                                                                        0%
                                                          would fit in the fund's strategic   12%
‒   View that ESG is pushing a moral agenda                                                                              12%
                                                                          asset allocation
‒   Not legally required                                                                                                     6%

‒   Leave it to managers to integrate ESG as                                                                                       22%
    appropriate                                                                                                         0%
                                                               ESG under consideration        12%
‒   Haven't yet considered                                                                                                   6%
                                                                                                                             17%

12%                                                                                                                     11%
                                                                                                                                  20%
                                                                                    Other           25%
of those that have not incorporated ESG into                                                                                             29%
investment decision-making are considering doing                                                                                         28%
so (page 12).
                                                          * Multiple responses allowed

                                                                                                                                                                23
Looking Forward

                                                  Planned changes to usage of ESG factors over the next 1 to 3 years*

49%
of respondents that have incorporated ESG              Seek better quality, more detailed, or
                                                                          different ESG data
                                                                                                49%
factors in investment decision-making will seek
better quality, more detailed, or different ESG
data in the coming years.

More than one-third (35%) will broaden the                Broaden ESG incorporation in our
scope of ESG incorporation. Specifically,              investment decision-making process       35%
respondents indicated they will look to
incorporate ESG by:
‒   Adding real assets and fixed income
‒   Seeking managers with better ESG
    processes and outcomes                                             No changes planned       27%
‒   Using new or different reporting
    frameworks
‒   Including more impact investing
‒   Enhancing engagement and monitoring
‒   Developing policies (e.g., investment               Increase the number of ESG factors      14%
    beliefs, proxy voting)

More than one-quarter (27%) of those
incorporating ESG have no changes planned.
                                                                                       Other    8%
*Multiple responses allowed

                                                                                                                        24
Product Offerings

                                                   Interest in more ESG-focused product offerings*
                                                                                                                                 57%
We asked all survey respondents where they                          None/Not Applicable                                                62%
                                                                                                              24%
would like to see more ESG-focused product
                                                                                                                27%
offerings. Choosing from an array of asset                                   U.S. equity                    21%
classes, 43% of survey participants (38 funds)                                                                            35%
                                                                                                            21%
responded, including those that had and had not                           Global equity               15%
integrated ESG.                                                                                                     30%
                                                                                                        19%
                                                                          Private equity    6%
                                                                                                                           38%
Most respondents (62%) not incorporating ESG
                                                                                                       18%
did not have any asset classes where they’d like                 Emerging market equity          12%
to see more ESG-focused products.                                                                                  27%
                                                                                                       18%
                                                                             Real estate     4%
                                                                                                                           38%
Those implementing ESG highlighted several                                                             17%                              All
asset classes for more product offerings:                               Non-U.S. equity               15%
                                                                                                         19%                            ESG No
‒   Private equity and real estate (38%) topped                                                        17%                              ESG Yes
    the list                                                               Infrastructure        4%
                                                                                                                          35%
‒   U.S. equity and infrastructure (35%) were                                                          17%
    close behind                                                       U.S. fixed income     10%
                                                                                                                   27%
‒   Hedge funds (30%), global equity (30%),                                                      12%
    emerging market equity (27%), and U.S.                           Global fixed income    8%
                                                                                                        19%
    fixed income (27%) were all areas of                                                         12%
    interest                                            Hedge funds/hedge fund-of-funds     0%
                                                                                                                    30%
                                                                                             10%
                                                                           Commodities      2%
                                                                                                             22%
                                                                                             8%
                                                                  Non-U.S. fixed income       4%
*Multiple responses allowed                                                                     14%

                                                                                                                                                  25
Conclusions

U.S. ESG Adoption Continued: An increasing          ‒   Since 2013, Callan’s survey has observed a steady increase in the portion of funds adopting ESG.
number of investors incorporated ESG into the           This trend varies from year to year, climbing more at times and leveling off in other years (as from
investment process in the U.S. in 2019.                 2018 to 2019).

                                                    ‒   ESG adoption is relatively new for many U.S. investors—62% of those surveyed in 2019 began
                                                        implementing ESG in the last five years.

                                                    ‒   The most frequently cited reason for incorporating ESG among respondents was to align the
                                                        portfolio with the organization’s values.

                                                    ‒   Conversely, the most frequently cited reason for not incorporating ESG among respondents was
                                                        the fund’s decision not to consider any factors that are not purely financial.

ESG Integration Rose as Preferred                   ‒   Callan’s surveys consistently find a portion of investors (around 10-20%) not yet incorporating
Implementation: ESG integration is the systematic       ESG factors, but they are actively considering doing so in the future. This brings the ratio of those
inclusion of financially material ESG factors in        either currently incorporating or thinking about incorporating ESG to about half of the respondent
investment analysis and decision-making.                pool of U.S. institutional investors (49%) in 2019.

                                                    ‒   Thematic ESG funds, divestment, and negative screens play a role in ESG implementation, but a
                                                        growing percentage of investors—particularly the early ESG adopters—have integrated ESG
                                                        across investment strategies. Survey respondents considered ESG factors with every investment
                                                        selection, communicated the importance of ESG to investment managers, and hired managers
                                                        that incorporate ESG into the investment strategy.

Investors implementing ESG would also like to       ‒   Private equity and real estate (38%) topped the list of strategies respondents would like to see more
see more ESG-focused products in alternatives,          of as related to ESG.
alongside publicly traded asset classes.
                                                    ‒   U.S. equity and infrastructure (35%) were close behind.

                                                    ‒   Hedge funds (30%), global equity (30%), emerging market equity (27%), and U.S. fixed income
                                                        (27%) were also areas of interest.

                                                                                                                                                           26
About the Survey

                   Survey Methodology

                   Callan’s 2019 ESG Survey is the seventh edition highlighting current practices and opinions surrounding
                   environmental, social, and governance (ESG) factors among various types of U.S. institutional investors.
                   Respondents provided input via online questionnaires.

                   We broke respondents into two primary groups for analysis: those that had and had not incorporated ESG
                   factors into the investment decision-making process. Organizations incorporating ESG factors answered
                   different questions than those not incorporating ESG factors. In most instances, statistics were calculated
                   using this subset of respondents as the denominator. In a few cases, the denominator was smaller, as a
                   subset of the primary group (e.g., only the defined contribution plans implementing ESG). In these situations,
                   we describe the specific respondent group upon which statistics are calculated in the text that accompanies
                   the particular exhibit. Multiple responses were allowed for many questions, as described in relevant footnotes.

                                                                                                                                 27
About the Survey

                   About the Authors

                   Shane Blanton is an assistant vice president in Callan's Published Research Group, covering business
                   analytics. He is responsible for data analysis and visualization to support Callan's research endeavors.
                   Previously Shane was a member of the Analytical Solutions Group for three years, training Callan's clients to
                   use PEP software.

                   Prior to joining Callan in 2012, Shane worked as an account manager for an integrated circuits packaging
                   manufacturer and as a trading assistant to a proprietary options firm. Shane attended Carnegie Mellon
                   University, where he earned a BS in business administration.

                   Anna West is a Senior Vice President and the ESG Practice Leader at Callan. She oversees the firm’s efforts
                   to address clients’ educational interests and needs in environmental, social, and governance (ESG) thought
                   leadership, research, education, implementation, and related consulting work. And as chair of Callan’s ESG
                   Committee, she works with colleagues across disciplines to assist clients and implement best practices. Anna
                   is also a member of Callan’s Inclusion and Institute Advisory Committees. She is a shareholder of the firm.

                   Anna joined Callan in August 2006 and was previously co-manager of its Published Research Group and, until
                   2018, director of the Callan Institute, the firm’s platform for research, education, and dialogue. Prior to Callan,
                   she worked for Vail Resorts. She earned an MBA from the University of San Francisco and a BA in
                   international business and French from Washington University.

                                                                                                                                    28
About Callan
Callan was founded as an employee-owned investment consulting firm in 1973. Ever since, we have
empowered institutional clients with creative, customized investment solutions that are backed by proprietary
research, exclusive data, and ongoing education. Today, Callan advises on more than $2 trillion in total fund
sponsor assets, which makes it among the largest independently owned investment consulting firms in the
U.S. Callan uses a client-focused consulting model to serve pension and defined contribution plan sponsors,
endowments, foundations, independent investment advisors, investment managers, and other asset owners.
Callan has six offices throughout the U.S. For more information, please visit www.callan.com.

About the Callan Institute
The Callan Institute, established in 1980, is a source of continuing education for those in the institutional
investment community. The Institute conducts conferences and workshops and provides published research,
surveys and newsletters. The Institute strives to present the most timely and relevant research and education
available so our clients and our associates stay abreast of important trends in the investments industry.

For more information about this report, please contact:
Anna West at westa@callan.com

© 2019 Callan LLC

Certain information herein has been compiled by Callan and is based on information provided by a variety of sources believed to be reliable for
which Callan has not necessarily verified the accuracy or completeness of or updated. This report is for informational purposes only and should
not be construed as legal or tax advice on any matter. Any investment decision you make on the basis of this report is your sole responsibility.
You should consult with legal and tax advisers before applying any of this information to your particular situation. Reference in this report to any
product, service or entity should not be construed as a recommendation, approval, affiliation or endorsement of such product, service or entity by
Callan. Past performance is no guarantee of future results. This report may consist of statements of opinion, which are made as of the date they
are expressed and are not statements of fact. The Callan Institute (the “Institute”) is, and will be, the sole owner and copyright holder of all
material prepared or developed by the Institute. No party has the right to reproduce, revise, resell, disseminate externally, disseminate to
subsidiaries or parents, or post on internal web sites any part of any material prepared or developed by the Institute, without the Institute’s
permission. Institute clients only have the right to utilize such material internally in their business.
Corporate Headquarters    Regional Offices

600 Montgomery Street     Atlanta            Denver         Portland
Suite 800                 800.522.9782       855.864.3377   800.227.3288
San Francisco, CA 94111
800.227.3288              Chicago            New Jersey
415.974.5060              800.999.3536       800.274.5878

www.callan.com               @CallanLLC         Callan
You can also read