2019 FULL-YEAR RESULTS - MARCH 25, 2020 - Guerbet

Page created by Rene Hudson
 
CONTINUE READING
2019 FULL-YEAR RESULTS - MARCH 25, 2020 - Guerbet
2019 FULL-YEAR RESULTS
MARCH 25, 2020
2019 FULL-YEAR RESULTS - MARCH 25, 2020 - Guerbet
Disclaimer

    Certain information included in this presentation and other statements or materials published by Guerbet (the “Company”) are not historical facts but are forward-looking
    statements. These forward-looking statements refer in particular to the Company’s management’s business strategies, its expansion and growth of operations, future
    events, trends or objectives and expectations, which are naturally subject to risks and contingencies that may lead to actual results materially differing from those
    explicitly or implicitly included in these statements.
    Forward-looking statements speak only as of the date of this presentation and, subject to any legal requirement, the Company does not undertake to update or revise
    the forward-looking statements that may be presented in this document to reflect new information, future events or for any other reason and any opinion expressed in this
    presentation is subject to change without notice. Such forward looking statements are for illustrative purposes only. Forward-looking information and statements are not
    guarantees of future performances and are subject to various risks and uncertainties, many of which are difficult to predict and generally beyond the control of the
    Company. These risks and uncertainties include among other things, the uncertainties inherent in research and development of new products, including future clinical trial
    results and analysis of clinical data (including post-marketing data), decisions by regulatory authorities, such as the Food and Drug Administration or the European
    Medicines Agency, regarding whether and when to approve any drug, device or biological application that may be filed for any such product candidates as well as
    their decisions regarding labelling and other matters that could affect the availability or commercial potential of such product candidates. A detailed description of risks
    and uncertainties related to the Company’s activities is included under Chapter 4.3 “Risk factors” in the Registration Document (Document de Référence) of the
    Company which has been filed with the French Financial Markets Authority on April 5, 2017 under the number n°D-17-0323 and is available on the Company’s website
    (www.guerbet.com).
    This presentation contains statistics, data and other information relating to markets, market sizes, market shares, market growth, market positions and other industry data
    pertaining to the Company’s business and markets. Such information is based on the Company’s analysis of multiple internal and third party sources, including information
    extracted from market research, governmental and other publicly available information, independent industry publications and information and reports. The Company,
    its affiliates, shareholders, directors, officers, advisors, employees and representatives have not independently verified the accuracy of any such market data and industry
    forecasts. Such data and forecasts are included in this presentation for information purposes only.
    Some of the financial information contained in this presentation is not directly extracted from the Company’s accounting systems or records and does not constitute
    International Financial Reporting Standards (IFRS) accounting measures, including in particular EBITDA. The Company calculates EBITDA as operating income, with the net
    allowance for amortization, depreciation and provisions added back in. EBITDA is not a measure of financial performance under IFRS and the definition of the term used
    by the Company may not be comparable to similar terms used by other companies. Such information has not been independently reviewed or verified by the
    Company’s auditors.
    This presentation does not contain or constitute an offer of securities for sale or an invitation or inducement to invest in securities in France, the United States or any other
    jurisdiction.

2
2019 FULL-YEAR RESULTS - MARCH 25, 2020 - Guerbet
Welcome

                   DAVID HALE
                   Chief Executive Officer

              2018 - 2020   Guerbet – Chief Commercial Officer
              2003 - 2018   GE Healthcare – VP Services; VP CT; VP Digital;
              2000 - 2003   GE Corporate Initiatives Group - Director
              1998 - 2000   Boston Consulting Group – Project Manager

                   JÉRÔME ESTAMPES
                   Chief Financial Officer

              2017 - 2019   Coty - Integration Project Leader - North America
              2015 - 2017   Pat McGrath Cosmetics - Senior VP, Finance and Operations
              2002 - 2014   Coty - Business controller, Divisional CFO, Head of FP&A and Strategic Planning
              1999 - 2002   Crown Holdings, Inc. - Finance Director Health and Beauty Care

3
2019 FULL-YEAR RESULTS - MARCH 25, 2020 - Guerbet
Precautionary measures taken in regards of COVID-19

          How we are responding

                                                                                           Guerbet products are
      •   Constant monitoring of the situation to address health & safety guidelines    indispensable to diagnosis,
          and potential sources of disruption                                             follow-up & treatment of
                                                                                                  patients
      •   Specific protection plans for plants and distribution centers which are all
          still operating
                                                                                              Our priorities:
      •   Protection measures for Technical services teams maintaining equipment
          in hospitals and clinics                                                      1. Employee health &
                                                                                                 safety
      •   Commercial teams still connected to customers via phone & digital tools
                                                                                        2. Business continuity
      •   Office-based employees working remotely

4
2019 FULL-YEAR RESULTS - MARCH 25, 2020 - Guerbet
Coronavirus – first estimation of impact

             LIMITED IMPACT TO Q1 SALES - ACTUAL SCENARIO RUNNING TO END OF JUNE

                All plants and distribution centers operating with appropriate protective
                measures in place based on current level of risk

                Logistics flows slowed down but not interrupted

               Commercial teams focused on remote contacts with customers, training and CRM

                Office workers in remote mode and team rotations for the remaining
                business critical activities

               Dramatic reduction of all non essential spendings (OPEX and CAPEX)

5
2019 FULL-YEAR RESULTS - MARCH 25, 2020 - Guerbet
Summary
1. Key highlights
2. Strategic Update
3. Financial results
4. Wrap-up
5. Appendices
2019 FULL-YEAR RESULTS - MARCH 25, 2020 - Guerbet
KEY INDICATORS                            GROWTH DRIVERS

      SALES (at CER)                             CT CATH LAB1
        €805.6m ; +2.0%         +€22m of additional revenues vs 2018 (at CER)
                                            +5.2% vs sales 2018

                                              INTERVENTIONAL
           EBITDA
    €111.5m ; 13.7% of sales
                                                  IMAGING
                                 +€8m of additional revenues vs 2018 (at CER)
                                            +12.5% vs sales 2018

    FREE CASH-FLOW                            JAPAN AFFILIATE
    +€28m vs €(30)m in 2018     +€13m of additional revenues vs 2018 (at CER)
                                           +60.5% vs sales 2018

                               1 : Including Digital, Technical Services and other DI

7
2019 FULL-YEAR RESULTS - MARCH 25, 2020 - Guerbet
Significant events 2019

    CSR: Guerbet awarded A++              Indications newly approved for                CSR: Gaïa Index :                Launch of UNIK offerings
     green label from CAHPP                    Lipiodol® & Vectorio®                    Guerbet in Top 15

                                                                   2019

                   CE mark approval for                      Expansion of AI Portfolio with          Gadopiclenol industrialization kick-off
                  SeQure® and DraKon™                       IBM Watson Health & Icometrix
                                                            & partnership with Intersystems        FDA approval for thecommercialisation of
                                                                                                   Dotarem® PFS & Vials produced in Raleigh

8
2019 FULL-YEAR RESULTS - MARCH 25, 2020 - Guerbet
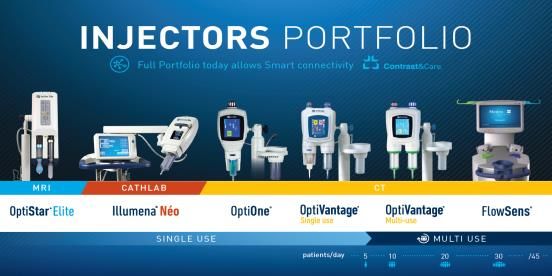
DIAGNOSTIC IMAGING (DI)                                               INTERVENTIONAL IMAGING (II)
                               €711,0 m ; +3,0%                                                  €73,5m ; +12.5%

                           Illumena Neo®
    Optiray®
                                                Dotarem®              OptiStar Elite®

                                                                                                                             Microcatheters
                           OptiVantage®                    Artirem®                               Lipiodol® Ultra-Fluid   SeQure® and DraKonTM
    Xenetix® Consumables

                                                                                                     Patent Blue V              Vectorio®

9                                          Excluding Revenue from third party : €21.1m at CER ; (38.4%)
2019 FULL-YEAR RESULTS - MARCH 25, 2020 - Guerbet
Sales 20191 : €784.5m ; +3.7% at CER

                               DIAGNOSTIC IMAGING (DI) 2                                                     INTERVENTIONAL IMAGING (II)
                                        (At CER)                                                                          (At CER)
                                                                                                                          9%
                                                                            35%

                     56%

                       +5.2%                                        -0,2%                                                 +12.5%

             417.9              439.5
                                                            272.0              271.5                               65.3              73.5

             2018               2019                       2018                2019                               2018               2019

                                         1 : Excluding revenues from third party : €21.1m at CER ; (38.4%)
10                                       2 : Including Digital, Technical Services and other DI
CT Cath Lab: strong performance of Optiray®

                                                                                                   Optiray® & Xenetix®
        Optiray®                                                       120
                                                                                        Global - Sales Evolution (base 100) at CER
             +15% growth
                                                                       110
             Contribution of Japan, competitor’s shortage in US                                                                                    108
                                                                       100                                                          105
             Direct sales in Turkey after termination of distributor                            99           99
                                                                       90       Base                                    97
             agreement
                                                                                 100
             Ongoing COGS reduction                                    80
                                                                                H1 2017      H2 2017       H1 2018   H2 2018       H1 2019     H2 2019

                                                                                     Split Sales & evolution by Zones (Optiray® & Xenetix®)

        Xenetix®
                                                                              11 %                   44%                  23%                22%
             Volume & sales increase
                                                                                US              Europe                    Asia            Other*
                                                                              +9%                +7%                      +12%             +9%
                                                                             vs 2018            vs 2018                  vs 2018          vs 2018

                                                                       * : Other includes, South America, Latin America, Canada, Middle East and Africa

11
MRI Contrast Media: growth (0.6%) with Dotarem® sales increasing +1.2%
     at CER offseting the planned impact of Optimark® withdrawal (€5.0m)
     all numbers at CER
                          MRI Contrast Media                                           Dotarem® : price & volume impacts by zones
                              information by zone
                                                                                      Vol.       Price     Sales (CER)
                                                                                                                          Comments
                                                                                      2019       2019        2019

                          Sales have generally stabilized, except Germany, despite
                          presence of generics in each market
                                                                                     +€3.9m   €(11.2)m     €(7.3)m
       Europe             Strong growth in Turkey after linears ban decided end of
     €146.3m ; (4.6)%     2018                                                        +2.6%     (7.4)%       (4.8)%

                          Moderate sales erosion in Europe

                          Solid Dotarem® growth of +10.3% sales (At CER ) vs 2018    +€9.4m     (4.2)m      +5.2m        Price offset
           US                                                                                                            by Volume
      €55.2m ; +5.5%      Optimark® withdrawal completed (Sales 2018 > €2m)          +18.8%     (8.5)%      +10.3%

                                                                                     +3.2m      +2.0m       +5.2m
         Asia             Strong double digit sales growth across almost every
     €34.2m ; +17.8%      region
                                                                                     +11.0%      +6.8%      +17.8%

12
MRI: Gadopiclenol on track with key milestones at end of 2019

                                                                              +

                                            Clinical   study phase 2b
                                            demonstrated a good safety
                                            profile and a greater contrast
                                            enhancement       than    the
                                            competitor at the same dose,
                                            allowing to continue the
                                            development plan in Phase III

                                                          PHASE III ON TRACK - GADOPICLENOL
                                                         Test effectiveness and tolerance vs. relevant
                                                          comparator on a large sample of patients

                                              Recruitment started in June 2019 as anticipated
                                              Patients recruitment on track in Europe, Americas and
                                              Asia at end of 2019
                                              Results Q1 2021 - Launch 2023
                                              Phase III full costs of €17m: 10% on 2018 - 40% in 2019 &
                                              50% in 2020

13
Interventional: Lipiodol® +13.0% growth at CER

          cTACE: registration in                     HSG in women
          new countries as India,                    undergoing infertility
          Switzerland & Denmark                      work-up registration in
                                                     Ireland, Netherlands,
          Vectorio® approved in                      Hungary
          India & Canada
                                    INTERVENTIONAL   12 other countries                        WOMEN’S
          Microcatheters                             approved including
          registered in LatAm            ONCOLOGY    USA, UK, Japan,
                                                     Canada, Australia
                                                                                                HEALTH

                            Market Attractiveness                      Market Attractiveness

                                     Registration                               Registration

                                      Awareness                                  Awareness

14
Accurate microcatheters (DraKonTM, SeQure®): action plan strengthened

        Key actions taken in 2019 (versus 2018)                                      Acceleration of sales on late H2
                                                                                                In % of sales
           •   Strengthen medical awareness
               • 5 New medical studies (IIS) initiated in 5 countries
               • 15 new prime KOLs endorsement on international podium

           •   Boost marketing expenses
               • Marketing investments increased by 40%
                                                                                                                    33%
               • Multichannel digital approach with website & social media

           •   Encourage early adoption                                                                    32%
               • 590 Evaluations in 210 accounts, +1000%, in key institutions
               • 1 500 HCPs leads generation through major congresses
                                                                                              22%
           •   Extend sales force                                                13%
               • Commercial team increased by 18 FTE in 2019
                                                                                Q1 2019     Q2 2019      Q3 2019   Q4 2019
               • Dedicated team of 30 members worldwide selling in 80
                 accounts in US, EMEA, APAC – all ex direct competitors
                                                                                          €0.4m on 2019 (at CER)
           •   Foster procedural cross selling strategy
               • Pull-thru packaged solutions to maximize penetration

     Great teams & organizational base installation in 2019; total investments increased by 37% vs 2018
15
2019 Industrial relevant facts

                                             Inventory reduction
                                                                                          Dublin
                                      1. Industrial footprint optimization
                                         : direct flow to Asia,
                                         production transfer to LATAM        1. November incident now
                                                                                resolved
                                      2. Implementation of a new
                                         planning system aiming at           2. Dublin factory running
                                         optimizing API inventory across        consistently
                                         the network
                                                                             3. Impact on H1 sales, replace
                                      3. lead-time reduction in all             with Xenetix® when possible
                                         factories

                                                 Gadopiclenol                            Raleigh
                                                Industrialization
                                                                             1. Startup of Dotarem® Plastic
                                      1. Project launched in Marans,            Prefilled Syringes production
                                         Lanester, Aulnay & Raleigh
                                                                             2. Raleigh now able to
                                      2. Equipment installed in Marans,         manufacture Dotarem® vials
                                         ongoing in Lanester                    for the US and prefilled
                                                                                syringes for most market
                                      3. First batches in Marans &              worldwide
                                         Lanester, end 2020, in Aulnay
                                         & Raleigh in 2021                   3. Reduction of inventory and
                                                                                sub-contractors activity

16
Industrial synergies:

                             2015-2017                                                      2018-2019

            Reduction of regional logistics costs by merging             Cost reduction program (“Cost to Win”) across the
                          distribution centers                                               network

                Reduction of international transport costs:          •     Productivity improvement in Aulnay

            •   Reduced air flows thanks to better planning          •     Yield improvement in both API and fill & finish sites
                / organization of production                               including contractors

            •   Better pricing conditions thanks to a                •     Establishment of low-cost sourcing on disposable
                globalized call for tenders
                                                                     •     Energy efficiency / recovery program in API
             Optimization of service and costs linked to the               plants
            regionalization of filling sites for finished products
                                                                     •     Pursued optimization of the logistic footprint

17
Summary
1. Key highlights

2. Strategic Update
3. Financial results
4. Wrap-up
5. Appendices
Strategic review: 3 businesses to build on our success

                               Key Attributes               What we will do                Impact

                     ›   Majority of GBT Margin       ›   Products → solutions
                     ›   Slow / limited growth        ›   Lean the portfolio                 GENERATE
                     ›   High Price Sensitivity       ›   Actively manage costs               CASH
                     ›   Generics abundant            ›   Adapt our Go-to-Market

                     ›   Growing part of GBT Margin   ›   Open new markets                    DRIVE
                     ›   DD growth @great SCM         ›   Expand Indications                PROFITABLE
                     ›   High “feature” sensitivity   ›   Inorganic bolt-ons
                     ›   Market moves quickly         ›   Dedicated Sales
                                                                                             GROWTH

                     ›   Limited part of GBT Margin   ›   Grow our IT skill sets… Sales,
                     ›   DD growth @strong SCM            Marketing, Development               BUILD
                     ›   Guerbet differentiator       ›   Drive service operational           BUSINESS
                     ›   Added value for Customers        & commercial excellence

19
Solid fundamentals driving a €5bn mature contrast media and injectors
     market with single digit growth expected over the coming years

                GLOBAL MR CM MARKET                            GLOBAL CT CM MARKET               GLOBAL INJECTOR SOLUTIONS MARKET
                     IN M LITERS                                    IN M LITERS                               IN €BN

                          CAGR +4%                                     CAGR +3%                                   CAGR +8%

            0,49                0,51      0,53   0,57                                                                                    1,7
                       0,5                                                13,0    13,3    13,7                      1,5       1,6
                                                        12,2    12,6                              1,2      1,3

                                                        2019    2020      2021    2022    2023   2019     2020      2021      2022       2023
            2019      2020      2021      2022   2023

                MRI – Contrast Media                            CT – Contrast Media                         Injector Solutions

                    c.€1.0bn market                             c.€2.6bn market                            c.€1.0bn market
       #1                          c.46% share          #1                  c.33% share           #1                       c.45% share

                                                                                                  #2                       c.25% share
       #2          Guerbet         c.22% share          #2                  c.22% share
                                                                                                  #3    Guerbet            c.9% share
       #3                          c.16% share          #3                  c.17% share
                                                                                                  #4                       c.7% share
       #4                          c.9% share           #4     Guerbet      c.16% share           #5                       c.5% share
       #5          Generics        c.7% share           #5     Generics     c.12% share           #6                       c.4% share
            Source : Guerbet internal analysis                                                    #7    Others             c.6% share

20
Strategy & Action plan for Diagnostic Imaging - CT/Cathlab

                             Strategy                                    Key Actions

                                 Drive targeted           • Portfolio management: Pricing Policy, Pruning &
                      1          profitable growth
                                                            Core offers
                                                          • Leverage new sourcing disposables & pricing

                                                          • Increase disposables penetration rate on injectors
                      2          Accelerate growth          leveraging new supplier (actual CR ~ 9%)
                                                          • Expand OptiVantage® multi-use solution
      CT CATH LAB

                                                          • UNIK offering in CT, Cath Lab & Mammography
                                 Expand Differentiation   • Strengthen OEM relationships
                      3                                   • Leverage Contrast & Care to pull through
                                                            injector & consumables business

21
Strategy & Action plan for Diagnostic Imaging - MRI

                             Strategy                                        Key Actions

                                                          •   Adapt price strategy where necessary to maintain
                                                              customers
                       1       Defend Dotarem® position   •   Leverage 30 years track record (safety & efficacy)
                                                          •   Portfolio optimization (plastic PFS and upgraded injector
                                                              in 2021)

                                                          •   Vs. Linears → Continue to educate on Linears Gd
                                                              retention … congresses, papers, symposia
                       2       Gain market share
                                                          •   Re-positioning of OptiStar Elite® with UNIK and new value
          MRI                                                 proposition

                                                          •   Phase 3 trials on track
                               Preparation for            •   Industrialization capabilities in process and on schedule
                       3       Gadopiclenol               •   Finalizing naming, publication and clinical studies
                                                              schedules

22
Diagnostic imaging : Two different growth strategies for contrast media
     linked by a common medical device socket

                                              Contrast Media
                               CT                                        MRI
           "Commodity Market"                                             "Room for Differentiation"

                                                                        Differentiate on Safety Record
           Drive down Costs

            Fight for Volume                                                    Fight for Price
                                            Drive Differentiation and
                                                   Stickiness

                                    INJECTION SOLUTIONS & DISPOSABLES
                                       TECH SERVICES & DIGITAL & AI
23
Guerbet Diagnostic Imaging : a « complete value » ecosystem

                                                                                       •   Top Quality products
                                                                                       •   Diagnostic performance
                                                         Contrast
                                                          Media

               •   Key differentiation                                                 •   Wide flex portfolio
           •  Continum in innovation          Inter-                                       High performances
                                                                        Injection      •
                 •  Flex & modularity       connected                                  •   High reliability
       •   Long term partnership (Key                                   Solutions
                                             Solutions
              Account retention and
                         penetration)

                    Smart Solutions:
                •     Digital integration     Digital                                  •   Safety
                       •   Connectivity      Services               Disposables        •   Single vs Multi
                         •   Traceability                                              •   Efficiency & optimization
                •     Dose optimization

                                                          Tech      •    Tech & Customer Support
                                                                    •    Extended worranty
                                                         Services
                                                                    •    Workflow continuity
                                                                    •    Upgrades
24
Digital Solutions Portfolio

                                                                                       OUTCOMES FOR OUR CUSTOMERS

                                                                                      Productivity
                  Monitors patient    Patient Information   Radiologist-trained AI
                                                                                        Reduce admin time
                  radiation                                 tool that aims to
                                        Injection History
                  exposure                                  efficiently inform conf     Simplify protocol management
                                        Red-Flag Patients   ident care decisions
                  Collects data                                                       Compliance Adherence
                  from all ionizing   Traceability          Provides patient            Traceability
     Features/    equipment                                 context from a
                                        Batch Recalls
                                                            comprehensive list of       Regulatory reporting
     Functions    Tracks patient        Adverse Events      data sources
                  exposure history
                                      Save admin. Time      Projects data via a
                  Statistical
                                        Barcode / RFID      single-view summary
                  analysis of dose
                                                            in sync with PACS
                  data                  Injection
                                        Analytics

        Software Solutions to address key customer pain points

25
A distribution partnership with icometrix for icobrain artificial intelligence and
     cloud-based software to used to quantify brain scans (MR and CT)

                            • Founded in 2011 in Leuven Belgium
                            • Interdisciplinary team of 35 people
                            • Icobrain used in 100+ hospitals
                            • Exclusivity for Guerbet in France, Italy and Brazil
                            • Guerbet Commercial launch : January 1st 2020
                            • Two customers already in trial
26
Guerbet grown to 6% in the €850m market currently playing in and room to grow with
     products already in process … product expansion focus areas doubles the playing space

           Market segments                        Guerbet plays                                    In progress                       GUERBET SHARE IN CURRENT €850m Euro MARKET

                                                                                                                                                                         Guerbet
     Iodized oil HCC                          ✓ LUF HCC                                                                                   Others 29%
                                                                                                                                                                           6%
     Y90                                                                                   ✓ TARE De-Liver                                                               BTG 26%
                                                                                                                                                                       (now part of
     DEBs                                                                                  ✓ Occlugel
                                                                                                                                                         €0,85B         Boston Sci)

     Microspheres                                                                          ✓ Occlugel
     Liquid Embolics/Iodized oil VE           ✓ LUF VE                                                                                Terumo 11%
                                                                                                                                                                  Sirtex 16%
     PV Microcatheters                        ✓ Accurate                                   ✓ Accurate extension                         Boston Sci 12%

      Additional Market Segments                                                                                                            GUERBET SHARE IN EXTENDED MARKET
        Actively investigating
                                                                                                                                                                          Guerbet
      Guidewires                                                                                                                                                            3%
                                                                                                                                     Others 48%
                                                                                                                                                                           BTG 14%
      Plugs                                                                                                                                                              (now part of
                                                                                                                                                                          Boston Sci)
      PV Coils                                                                                                                                           €1,6B
      Ablation                                                                                                                                                          Medtronic 13%

                                                                                                                                                                     Boston Sci 13%
                                                                                                                                          Terumo 9%
                           Market value:
                           - Current competition market from Guerbet II Country Market Data Survey (CMDS)/II Commercial Excellence
27                         - Other segments Ablation, Plugs, Coils & Guidewires from external sources: IO & TEO reports DRG
Interventional Imaging : Strategy & Action plan

                              Strategy                                           Key Actions

                                                             • Continue to position LUF HCC Standard-of-Care status @
                                                               IR/IO congresses
                       1        Boost leadership in          • Drive liver portfolio with One 3 One strategy
                                Interventional Oncology        (LUF+Vectorio®+DraKon™)
                                                             • Establish SeQure® in DEB TACE believer accounts

                                Drive adoption in            • Maximize accounts synergies with total II portfolio
                       2        Interventional Radiology     • Promote LUF VE & Lymphography @ IR congresses
                                                             • Elevate clinical & technical skills through internal & external
                                Embolization
                                                               trainings

                                                             • Drive liver portfolio with One 3 One strategy
     INTERVENTIONAL             Install our Interventional     (LUF+Vectorio®+DraKon™)
                       3        Delivery solutions           • Establish SeQure® in UFE, PAE & DEB TACE accounts
                                                             • Increase NTE clinical unmet need awareness
                                                             • Leverage SeQure® to establish DraKon™

                                Strengthen our position as   •• Boost brand
                                                                  Phase         equity
                                                                          3 trials      in Human Reproduction
                                                                                   on track
                                                             •• Execute   G-t-M plans
                                                                  Industrialization  capabilities in process and on schedule
                       4        valued player in Women’s
                                                             •• Explore  partnership
                                                                  Finalizing  naming,&publication
                                                                                           licensing Ops
                                                                                                      and clinical studies
                                Health                            schedules

28
M&A focus areas

              FIELDS OF                  MEDICAL
                                                                SOFTWARE
                                                                                       EXPAND
              INTEREST                  DISPOSABLES                                   PORTFOLIO

                            DIRECT               DISTRIBUTION          TECHNOLOGY
        COMMERCIAL        ACQUISITION                DEAL               ACQUISITION
                                                                                                  WHITE
                                                                                                  BRAND
       ORGANIZATION
         HOW WE DO IT ?

29
Summary
1. Key highlights
2. Strategic Update

3. Financial results
4. Wrap-up
5. Appendices
Slight increase, on track with Guidance 2019

                                        Sales evolution at constant &
                                       current exchange rates (in €m)

                                                 +3.5%

                                                 +2.0%       816.9
                                                                           2019 Growth:
                                                         805.6
                                                                             On track with 2019
                                         789.6                               guidance

                                                                             3.7% growth (at CER)
                                                                             excluding Third party

                                                                             Strong growth of CT
                                                                             Cath/Lab

                                                                             Strong progression of Asia

                                         2018            2019

                                          At CER           At Current FX

31
Favorable dynamics in all of our areas of development

               Evolution of 2019 sales by geographical area
                               (in % at CER)

                                                                               €249.5m
                                                                               +3.0%
                                 EMEA

                                                                               €374.9m
                  NA &                                                         +1.9%
                                                              APAC
                 LATAM

                                                                               €160.1m
                                                                               +10.3%

                                                                     Excluding « Revenue from third party »

32
IFRS 16 impacts

     Income statement                                                                 Impact                                               Amount

     EBITDA                            Favourable impact with lower lease payments reclassified in depreciation and financial costs        €9.7m

     Depreciation and amortization Percentage of rents paid booked to depreciation and amortization                                        €(9.6)m

     Financial result                  Part of lease payments recorded as a financial cost                                                 €(0.4)m

     Balance sheet                                                                   Impact                                               Amount

     Non-current assets                Right-of-use assets booked as non-current assets                                                   +€15.7m

     Financial liabilities (ST & LT)   Offset by the recognition of future lease payments as a liability (non-cash)                       +€16.0m

     Equity                            Reflects the delta between Non-current asset and Liabilities, equivalent to impact on Net Result   €(0.3)m

33
EBITDA

                                                                                                                              2019                                             2019
                                                                          2018
                             IFRS €m                                                             % revenue               As published               % revenue              Comparable                 % revenue
                                                                      As published
                                                                                                                        Incl. IFRS 16 (1)                                 without IFRS 16

       Net sales                                                           789.6                   100.0%                   816.9                    100.0%                    816.9                   100.0%

       Other revenue                                                         6.1                     0.8%                     2.2                     0.3%                       2.2                      0.3%

       Supplies used in operations                                        (189.6)                  (24.0)%                 (199.8)                  (24.5%)                   (199.8)                  (24.5%)

       Staff costs                                                        (235.1)                  (29.8)%                 (241.9)                  (29.6%)                   (241.9)                  (29.6%)

       External expenses                                                  (246.5)                  (31.2)%                 (246.3)                  (30.1%)                   (256.0)                  (31.3%)

       Taxes other than on income                                          (16.1)                   (2.0)%                  (18.4)                   (2.2%)                    (18.4)                     (2.2%)

       Other operating income and
                                                                             2.2                     0.3%                    (1.4)                   (0.2%)                     (1.4)                     (0.2%)
       expenses

       EBITDA                                                              110.6                    14.0%                    111.5                   13.7%                     101.8                      12.5%

       (1) International accounting standard IFRS 16, concerning the treatment of leases in the consolidated financial statements, came into force on 1 January 2019. The Group chose to apply this standard using
       the simplified retroactive approach, in which there are no adjustments for the previous year. Note that the implementation of this standard requires a change in the presentation of the consolidated financial
       statements as at 31 December 2019, on the income statement, the lease expense previously recognized under operating costs is now to be recognized partly as a depreciation charge and partly as a
       financial cost.

       In the above table, the “2018 As published” information are related to the published information in the financial report for the full-year ended December 31, 2018 before IFRS 16 implementation
34
Operating Income

                                                                                                                2019                                        2019
                                                                 2018                     %                                             %                                            %
                           IFRS €m                                                                         As published                                 Comparable
                                                             As published              revenue                                       revenue                                      revenue
                                                                                                          Incl. IFRS 16 (1)                            without IFRS 16

           EBITDA                                                 110.6                  14.0%                  111.5                 13.7%                  101.8                  12.5%

           Allowances for depreciation                            (47.1)                 (6.0)%                 (58.7)                (7.2%)                 (49.1)                 (6.0%)

           Provisions                                               6.4                   0.8%                  (1.0)                 (0.1%)                  (1.0)                 (0.1%)

           Operating Income                                        69.9                   8.9%                   51.7                  6.3%                   51.6                   6.3%

        (1) International accounting standard IFRS 16, concerning the treatment of leases in the consolidated financial statements, came into force on 1 January 2019. The Group chose to apply
        this standard using the simplified retroactive approach, in which there are no adjustments for the previous year. Note that the implementation of this standard requires a change in the
        presentation of the consolidated financial statements as at 31 December 2019, on the income statement, the lease expense previously recognized under operating costs is now to be
        recognized partly as a depreciation charge and partly as a financial cost.

         In the above table, the “2018 As published” information are related to the published information in the financial report for the full-year ended December 31, 2018 before IFRS 16
        implementation

35
Net Income

                                                                                                                             2019                                                 2019
                                                                    2018
                          IFRS €m                                                             % revenue                 As published                 % revenue                Comparable                   % revenue
                                                                As published
                                                                                                                       Incl. IFRS 16 (1)                                     without IFRS 16

     Operating Income                                                  69.9                       8.9%                        51.7                       6.3%                        51.6                      6.3%

     Net interest expense                                              (6.9)                     (0.9)%                       (7.6)                     (0.9)%                       (7.1)                    (0.9)%

     Net currency gains/losses & Other
                                                                        3.4                       0.4%                         7.0                       0.9%                         7.0                      0.9%
     Financial income/loss

     Income tax                                                       (19.6)                     (2.5)%                      (13.9)                     (1.7)%                      (14.0)                    (1.7)%

     Net Income                                                        46.8                       5.9%                        37.3                       4.6%                        37.6                      4.6%

     (1) International accounting standard IFRS 16, concerning the treatment of leases in the consolidated financial statements, came into force on 1 January 2019. The Group chose to apply this standard using the simplified
     retroactive approach, in which there are no adjustments for the previous year. Note that the implementation of this standard requires a change in the presentation of the consolidated financial statements as at 31
     December 2019, on the income statement, the lease expense previously recognized under operating costs is now to be recognized partly as a depreciation charge and partly as a financial cost.

     In the above table, the “2018 As published” information are related to the published information in the financial report for the full-year ended December 31, 2018 before IFRS 16 implementation

36
Balance sheet

                                                                                              December 31,                                                                                                      December 31,
                                                                    December 31,                                                                                                            December 31,
                                                                                                  2019                                                            December 31                                       2019
                                     December 31 2018                     2019                                                                                                                    2019
              ASSETS                                                                          Comparable                      EQUITY & LIABILITIES                    2018                                      Comparable
                                       As published                  As published                                                                                                            As published
                                                                                                 without                                                          As published                                     without
                                                                    Incl. IFRS 16 (1)                                                                                                       Incl. IFRS 16 (1)
                                                                                                 IFRS 16                                                                                                           IFRS 16

     Non-current assets
                                              474                         494                        478
     of which fixed                                                                                                        Shareholders’ equity                         367                        389               389
                                              437                         463                        447
     assets
                                                                                                                           Non-current liabilities
                                                                                                                                                                        265                        404               396
     Inventories                              281                         237                        237                   of which financial
                                                                                                                                                                        193                        341               333
                                                                                                                           debt

     Trade receivables                        146                         140                        140                   Trade payables                                82                        68                 68

     Other current                                                                                                         Other current
                                              180                         138                        138                   liabilities                                  368                        148               140
     assets
                                              107                          81                         81                   of which financial                           223                         37                29
     of which CCE
                                                                                                                           debt

     Total Balance sheet                     1 081                       1 009                       993                   Total Balance sheet                         1 081                     1 009               993

     (1) International accounting standard IFRS 16, concerning the treatment of leases in the consolidated financial statements, came into force on 1 January 2019. The Group chose to apply this standard using the simplified
     retroactive approach, in which there are no adjustments for the previous year. Note that the implementation of this standard requires a change in the presentation of the consolidated financial statements as at 31 December
     2019, with the balance sheet showing a liability in respect of future lease payments and an asset in respect of rights-of-use.

     In the above table, the “2018 As published” information are related to the published information in the financial report for the full-year ended December 31, 2018 before IFRS 16 implementation

37
Free cash-flow

        IFRS €m                                          FY 2018   FY 2019

        Cash flow from operations                         109.0     112.0
        Change in WCR                                     (16.1)    33.3
        Net capital expenditure                           (38.5)    (48.5)
        Investment in intangible assets (acquisitions)    (33.2)    (16.6)
        Dividends                                         (10.7)    (10.7)
        Capital increase                                   0.3       0.0
        Interests paid                                    (10.1)    (6.8)
        Income tax paid                                   (25.3)    (24.0)
        Exchange                                          (5.5)     (10.4)
        Free Cash Flow                                    (30.3)    28.3

38
EBITDA Evolution

                                                           -8.9
                     -0.2
                                             14.0
                                                                                                                9.7
                                -9.8

                                                                        -11.9
                                                                                       8.0
          110.6                                                                                                             111.5

                                                                                                    101.8

       EBITDA 2018   FX       One Off   Gross margin    One off     Invest in the Savings SG&A EBITDA 2019     IFRS 16   EBITDA 2019
        published           impact 2018              impact 2019      Future (II,              excl. IFRS 16              published
                                                      (Litigation, Gado, Japan)
                                                      indemnity,
                                                        Dublin)

39
Net debt evolution

                 Net debt                                  Net debt / EBITDA                       Net debt / Shareholder Equity
                                                    2.8                             2.8
       308.7                                                      2.7
                    296.5
                                      280.5                                                      0.8            0.8
                                                                                                                                  0.7

       2018       2019 as         2019 restated     2018       2019 as         2019 restated     2018        2019 as         2019 restated
               published (incl.   (excl. IFRS 16)           published (incl.   (excl. IFRS 16)            published (incl.   (excl. IFRS 16)
                  IFRS 16)                                     IFRS 16)                                      IFRS 16)

40
Summary
1. Key highlights
2. Strategic Update
3. Financial results

4. Wrap-up
5. Appendices
2020 head winds and tail winds

               Industrial synergies:             Incentive for generic substitution                 “HSG in women undergoing
         Effects to come in 2020 & 2021                      in France                              infertility workup” indication
                                                                                                      approved for Lipiodol® in
                                                (Implementation as of Jan, 1st 2020 of Article 66
     •   Internalization ofDotarem®                from 2019 Social Security Financing Act)             additional countries
         production in Raleigh (Fill & finish
         operations)
     •   Optimized fixed cost structure in       Article 66 of the 2019 Social Security
         Lanester with the internalization of    financing law states that “the
         an intermediate                         reimbursement of an insured person
                                                 who does not wish, without medical
     •   Pursue the optimization of Optiray®
                                                 justification, the substitution will be
         (Fill & finish operation)
                                                 made on the basis of the price of the
     •   Outsourcing of European distribution    generic.”
         to 3PL
     •   Extend low cost sourcing strategy to
         additional medical device
         consumables

42
Strategic review: 3 businesses to build on our success

                               Key Attributes               What we will do                Impact

                     ›   Majority of GBT Margin       ›   Products → solutions
                     ›   Slow / limited growth        ›   Lean the portfolio                 GENERATE
                     ›   High Price Sensitivity       ›   Actively manage costs               CASH
                     ›   Generics abundant            ›   Adapt our Go-to-Market

                     ›   Growing part of GBT Margin   ›   Open new markets                    DRIVE
                     ›   DD growth @great SCM         ›   Expand Indications                PROFITABLE
                     ›   High “feature” sensitivity   ›   Inorganic bolt-ons
                     ›   Market moves quickly         ›   Dedicated Sales
                                                                                             GROWTH

                     ›   Limited part of GBT Margin   ›   Grow our IT skill sets… Sales,
                     ›   DD growth @strong SCM            Marketing, Development               BUILD
                     ›   Guerbet differentiator       ›   Drive service operational           BUSINESS
                     ›   Added value for Customers        & commercial excellence

43
QUESTIONS
& ANSWERS
Summary
1. Key highlights
2. Financial results
3. Outlook

4. Appendices
External recognition for our CSR performance

                                                       14th in 2019 Gaïa ** ranking                 Guerbet obtained a score
          Guerbet received “B” rating
                                                       of 230 SMEs and mid-cap                      of 87.5 out of 100 and the
          from the CDP * for its first
                                                       companies, +20 places vs                     green A ++ index, the
          participation in the Climate
                                                       2018, and 12th out of 85 in                  highest of the CAHPP ***,
          Questionnaire.
                                                       the category of companies                    which attests to its maturity
                                                       generating +€ 500 M of                       on sustainable
          This encouraging score
                                                       revenue, +13 places.                         development.
          demonstrates the Group’s
          determination to take action
                                                       Improved ranking,                            In its reference category,
          against global warming
                                                       reflecting maturity of                       “pharmaceuticals”, the
          actions.
                                                       Guerbet’s environmental,                     average score for
          auprès des investisseurs.                                                                 companies is 39.1 out of 100.
                                                       social and governance
                                                       policy and the efforts the
                                                       company has undertaken in
                                                       this area.

         * CDP: formerly known as Carbon              ** Gaïa index is the socially responsible   ***CAHPP: Centrale d'achats de l'hospitalisation
         Disclosure Project, is a global non-profit   investing stock market index for mid-cap    publique et privée is a group purchasing
         organization that singles out the world’s    stocks that distinguishes French stocks     organization for public and private hospitalization in
         most active companies in the fight           according to their corporate social         France.
         against climate change.                      responsibility (CSR) performance.
46
Guerbet’s CSR policy is structured around 4 pillars with key objectives and
     actions

       Our CSR policy is structured around 4 pillars
           Imaging products and services designed to improve patient prognosis and quality of life
           A responsible social policy developed around five main themes: diversity, prevention, recognition, commitment and
           accountability
           An HSE policy that gives absolute priority to safety of people while also minimizing environmental impacts at all levels
           Business ethics to promote the fight against corruption, prevention of conflicts of interest and anti-competitive practices
           as well as respect for the medical code of ethics.

       Guerbet has substantially improved its position in the field of business ethics and CSR policy,
       receiving support at the highest level
       Actions taken by Guerbet to improve its responsible purchasing policy are also recognized in the
       ratings
       With respect to labor policy, the indicators for work conditions, health & safety and skills
       development have significantly increased.

47
Financial communication calendar

          1st quarter 2020 revenue: April 23, 2020 after trading

          2nd quarter 2020 revenue : July 23, 2020 after trading

          2020 Half-year results: September 23, 2020 after trading

48
Underlying fundamentals and drivers of the diagnostic imaging market
     very solid despite a few areas of concern

     KEY GROWTH DRIVERS                                       KEY TRENDS IN THE MARKET                               KEY GROWTH DRIVERS

                                      MR / CT machine and exam volume increasing globally
      Diagnostic Imaging
                                      Increased demand for diagnostic image-guided procedures
          procedures
                                      New imaging centres being built… Hospital beyond 4 walls

                                      19m to 20m new cancer cases p.a. by 2025
     Demographics / Aging             By 2030, senior population to represent 20% of the total U.S. population and
         population                   to double in China to 178m people
                                      +70% of people suffering dementia by 2030

                                      China - targeting a $1.3 trillion Healthcare industry by 2020
      Healthcare spend in
       emerging markets               India Healthcare Market growing 18% CAGR through 2022 with a 10 times
                                      increase in disposable income for middle class

                                      Increased presence of generics (e.g.. Clariscan in MR)
      Regulation of use of
                                      Some safety concerns on MR contrast agents drive down tendency to inject
        Contrast Media
                                      Reimbursement rates being driven down

 Source : Guerbet internal analysis

49
Performance of the Guerbet share

       At March 20th, 2020
             Price                                  € 30

             Capitalization                         € 378 m
                                                                            Historical performance since March 2019
                                                                80
             High since March, 2019                  € 57
                                                                70
             Low since March, 2019                   € 27

             Perf. since March 2019                - 38.65 %    60

       Indexes                                                  50

             CAC Mid &Small, CAC All-Share
                                                                40
       Securities trading info
                                                                30
             Code ISIN           FR0000032526

             Symbol                         GBT                 20
                                                               22-mars-19      21-juin-19   17-sept.-19   12/12/2019   12/03/2020
             Reuters Code              GRBT.PA

             Bloomberg Code              GBT:FP

             Number of shares         12 598 621
                                                                      Dividend of €0.70 per share proposed to the General
             Market segment           Euronext B
                                                                            Shareholders’ meeting on May 29, 2020
50
You can also read