2019 HALF YEAR RESULTS - Indigo
←
→
Page content transcription
If your browser does not render page correctly, please read the page content below
2019 HALF YEAR RESULTS

September 2019

Disclaimer

         The information in this presentation has been included in good faith but is for general informational purposes only. All reasonable
         care has been taken to ensure that the information contained herein is not untrue or misleading. It should not be relied on for any
         specific purpose and no representation or warranty is given with regard to its accuracy or completeness.
         This document does not constitute or form part of any offer or invitation to sell or issue, or any solicitation of any offer to
         purchase or subscribe for any securities. The making of this document does not constitute a recommendation regarding any
         securities. Nothing herein may be used as the basis to enter into any contract or agreement.
         This presentation may contain forward-looking objectives and statements about Indigo Group’s financial situation, operating
         results, business activities and expansion strategy. These objectives and statements are based on assumptions that are
         dependent upon significant risk and uncertainty factors or may prove to be inexact. The information is valid only at the time of
         writing and Indigo Group does not assume any obligation to update or revise the objectives on the basis of new information or
         future or other events, subject to applicable regulations. Additional information on the factors that could have an impact on Indigo
         Group’s financial results is contained in the documents filed by the Group with the French securities regulator (AMF) and available
         on the Group’s website at www.group-indigo.com.
         Neither Indigo Group S.A.S. nor any affiliates nor their or their affiliates’ officers or employees shall be liable for any loss, damage
         or expense arising out of any access to or use of this presentation, including, without limitation, any loss of profit, indirect,
         incidental or consequential loss.
         This distribution is addressed to analysts and to institutional or specialized investors only. No reproduction of any part of the
         presentation may be sold or distributed for commercial gain nor shall it be modified or incorporated in any other work,
         publication or site, whether in hard copy or electronic format.

Page 1                                                                                            2019 Half Year Results – September 2019
Reported financial figures

         Global Proportionate
         To make its performance easier to understand and to improve its presentation, the Group presents operational figures (Revenue,
         EBITDA, operating income) on a “Global Proportionate” (GP) basis, including the Group’s share of joint ventures (mainly in the USA,
         Colombia, Panama and Smovengo) as if they were consolidated proportionately and not under the equity method applied in
         accordance with IFRSs when preparing the consolidated financial statements.
         Free Cash Flow
         For the same reason, the Group uses Free Cash Flow – which is a measure of cash flow from recurring operating activities – as
         a performance indicator. It equals EBITDA less disbursements related to fixed fees as part of concession and lease contracts, the
         change in the working capital requirement and current provisions, maintenance expenditure and any other operating items that
         have a cash impact but that are not included in EBITDA.
         A reconciliation with the figures in the consolidated cash flow statement is presented in Note 8 “Notes to the cash flow
         statement” of the consolidated financial statements ended 30 June 2019.
         Cash Conversion Ratio
         The Cash Conversion Ratio provides useful information to investors to assess the proportion of EBITDA that is converted into Free
         Cash Flow and therefore available for development investments, the payment of tax, debt servicing and the payment of
         dividends to shareholders.
         IFRS 15
         The Group adopted IFRS 15 “Revenue from contracts with customers” on 1 January 2018, the date on which the standard came
         into force in the European Union. IFRS 15 is the new IFRS accounting standard governing revenue recognition. It replaces IAS 11
         “Construction Contracts” and IAS 18 “Revenue” and the corresponding interpretations, particularly IFRIC 15 “Agreements for the
         Construction of Real Estate”.
         The Group has decided to apply IFRS 15 according to the “full retrospective” transitional approach.
         This change of method has no impact on EBITDA or net income, only on the presentation of the income statement.
         IFRS 16
         On 1 January 2019, the Group applied IFRS 16 to leases in existence on the transition date according to the “simplified
         retrospective” approach. The 2018 figures, presented for comparison purposes, have therefore not been adjusted to reflect the
         transitional provisions of IFRS 16.
         The impact of applying IFRS 16 “Leases” from 1 January 2019 is described in Note 4 “Change in accounting method” of the
         consolidated financial statements ended 30 June 2019.

Page 2                                                                                          2019 Half Year Results - September 2019
Contents

         1.   Strategy                                                                     4

         2.   Key developments                                                            16

         3.   Highlights                                                                   21

         4.   Indigo Group: An infrastructure asset                                       24

         5.   Financial performance                                                       27

         6.   Financial policy                                                            36

         7.   Appendix                                                                    41

Page 3                                                2019 Half Year Results - September 2019
1.   Strategy
     1.1.   Positive macro trends in the car
            industry…
                                               5   1.6. Infrastructure as the core strategic focus…
                                                                                                            4    10

                                                   1.7. … supported by a new asset acquisition                   11
     1.2. …along with the rise of multimodal   6        strategy
          transportation
                                                   1.8. …leveraged by innovative mobility                        12
     1.3. Indigo Group: A global parking       7        platforms…
          player…
                                                   1.9. …with adjacent services delivering added                 13
     1.4. … in off-street and on-street        8        value
          parking…
                                                   1.10. Goal 2025: a strategic roadmap well on track            14
     1.5. …. developing activities in China    9

                                                                       2019 Half Year Results - September 2019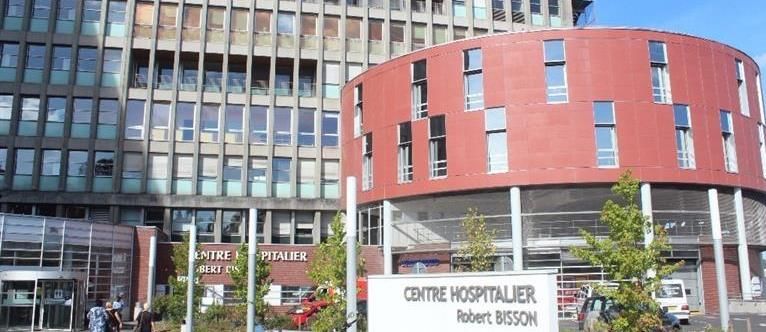
Strategy

                      1.1. Positive macro trends in the car industry…
                      Car will remain the principal transportation mode

                                 Citizens
                                 • Desire for increased geographical flexibility
                                 • Focus on offers to comply with the demand for freedom
                                 • Search for proximity services                                           +100M vehicles / year
                                 • Alliance of car ownership and shared solutions
 INCREASE IN

                                 Mobility                                                                  +3BN vehicles by 2050
                                 • Cars: issues solved with technological disruptions (pollution,
         GDP per capita            costs, congestion, low usage)
                                 • Other individual mobility: a complementary solution to their
                                   journey
                                 • Collective transportation: cost-effective solution but
                                                                                                           +2BN potential
                                   efficiency to be improved                                               customers by 2050
         Worldwide
         population
                                 Cities
                                 • Type of cities: Compact | Multicentric
                                                                                                           80% of people
                                 • Level of infrastructure                                                 commuting to work by
         Urban population        • Political steering                                                      using cars by 2050

                                 Technologies
                                 • Artificial Intelligence & Blockchain driving autonomous                 82% of households in
                                   mobility
                                                                                                           France have a car
                                 • Internet of things driving connectivity
                                 • Multiple interfaces providing access

Page 5                                                                                              2019 Half Year Results - September 2019
Strategy

                     1.2. …along with the rise of multimodal transportation
                     The circles of mobility

                      0-10 Kms                                               10-100 Kms                                           >100 Kms
   Trip Distance

                                                                         Individual car                         Collective
                                   Shared mobility
                                                                                                                transportation

Global Platform      Transit, Citymapper, Moovit, MaaS2         Transit, Citymapper, Moovit, MaaS 2       Transit, Citymapper, Moovit, MaaS2

 Offer Platform                                                                   &                        Urban Pulse, ViaNavigo…

  Offer Portfolio                Bike | Scooter | Cars | E-             On-street | Off-street |                 Massive (Keolis, RATP, etc.)
                                 hailing (Taxi, Uber…)                  Adjacent services                        | Light (Navia, etc.)

                       4%                                                                 84%                 12%
         Toulouse1

                        6%                                             32%                                                  62%
            Paris1

                     Notes:
                     1. % of usage by means of transportation
Page 6               2. Mobility as a Service                                                         2019 Half Year Results - September 2019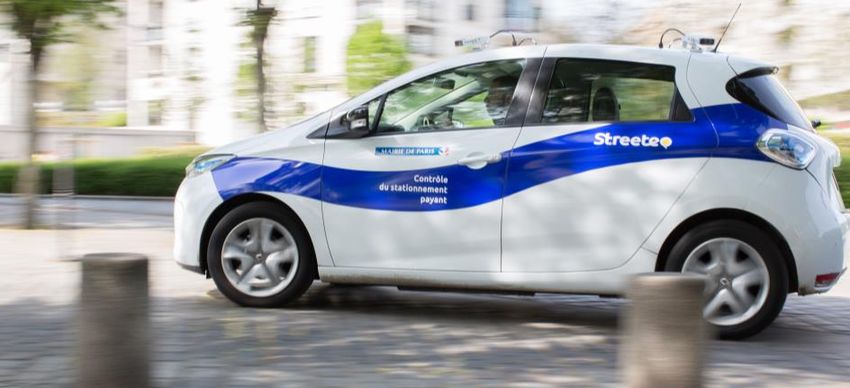
Strategy

                                1.3. Indigo Group: A global parking player…

                                                   North America

          11 countries2
                                       Canada                                                    Europe                                                      Asia

                                                                                              Belgium
                                                                                          Luxembourg
           +5,050 car                  United
                                       States1                                                 France
           parks3                                                                                Spain
                                                                                           Switzerland

                                                                                                                                                                      China4
          +2.3 million                                         Latin America
          managed                                                         Colombia1
          parking                                      Panama1
          spaces3

                                                                                      Brazil

         Top 3 leaders

         Infrastructure and
         diversity business
         No infrastructure
         business                    The Group continues to focus on priority markets in which it holds a leading position or sees
         Newly opened
                                     opportunities to become a leading operator.
             Notes:
             1.   USA, Colombia, Panama are operated under joint ventures
             2.   Qatar was sold in February 2018 and Russia in April 2018. UK, Germany, and Slovakia were sold in December 2018 and Czech Republic in January 2019
             3.   Figures based on a 100% share of operations including countries where the Group operates through Joint-Ventures as of 31 December 2018
             4.   Indigo Group signed an agreement on 25 March 2019 with Sunsea Parking Holdings to establish a joint venture in China
Page 7                                                                                                                                      2019 Half Year Results - September 2019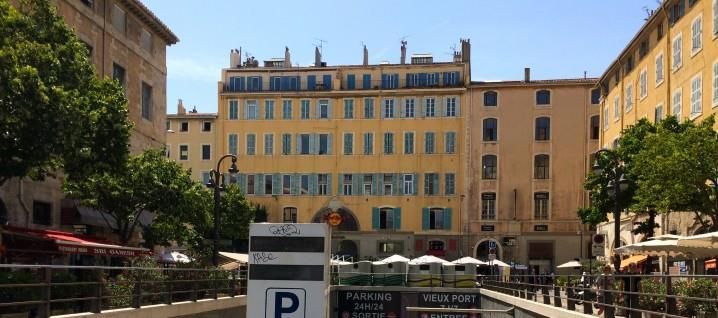
Strategy

                             1.4. … in off-street and on-street parking…
                             Strong expertise on off-street and on-street parking across all business
                             segments
Expertise in off-street operating models across all segments                             Expertise in on-street parking management

      Design, build,                Simplify the                 Offer innovative and          Cash                Maintenance              Control                Street
       finance and                customer journey                digitalised services       collection                of parking             and             management
          operate                   and optimise                    to offer greater                                   equipment         enforcement
                                        flow                            mobility
                                    management

     Full                 Concession                 Lease                  Service         154               5              50        More than      3,000 km       13 million
   Ownership                                                               Contract      on-street        countries1      contracts    1,000 civil    of streets       users
                                                                                          parking                           incl.     enforcement     operated
                                                                                         contracts                         parking       officers
                                                                                                                           control

Airports Shopping Events, Hospitality Railways Hospitals Universities Offices and
          Centres tourism             stations                        residences
                 and leisure

               Notes:
Page 8         1.   Including Belgium, Luxembourg, France, Spain, USA                                                          2019 Half Year Results - September 2019
Strategy

                        1.6. Infrastructure as the core strategic focus…
                        Add-on businesses highly synergetic with the Group’s car park platform

                             Drive traffic,                                                                 Improve user
On-street                     strengthen                                                                  experience, drive    Adjacent services
enforcement                relationship with                                                              traffic and length   _____
_____                        municipalities                                                                     of stay
                                                                                                                               Enrich car parks
                                                                                            PUBLIC
                                                                                            PARKING
                                                                                                                               with value-added
                                                                                                                               services (EV
                            Benefit from                                                                 Benefit from Indigo
Optimize flows of                                                                                           Group’s unique     charging, car
                           Indigo Group’s
cars between on-                                                                                         footprint and brand   maintenance, car
                          expertise in on-
street and off-street           street                                                                    image to establish   wash, last-mile
                                                                                                               blue-chip       operations and
                                                                                                             partnerships      services)
                                      PRIVATE PARKING
                                      (office, hotel, residence…)

                          Drive traffic, position                                                     Drive traffic, manage
                                                                                          ON-STREET
                         car parks as integrated                                                      flows, sell additional
Mobility solution                                                                         PARKING
                                                                                                      services, personalize
                                                                                                                               Digital platform
                            multimodal hubs,
_____                    strengthen relationship                                                      offering, improve car    _____
                           with municipalities                                                           park experience
                                                                    Unrivalled Car Park
                                                                      Infrastructure
                           Benefit from Indigo                                                                                 Leverage digital
                                                                                                        Benefit from Indigo
Turn car parks into       Group’s expertise in                                                                                 solutions to drive the
                                                                                                        Group’s expertise,
urban city mobility        urban mobility and                                                            unique footprint      right person to the
hubs                          unparalleled                                                                and innovation       right car park at the
                             infrastructure                                                                capabilities        right time & cost
                          footprint in both city
                          centers and suburbs

Page 9                                                                                                     2019 Half Year Results - September 2019
Strategy
1.7. … supported by a new asset acquisition strategy
Indigo Group has engaged in a strategy to acquire fully-owned car parks to take advantage of the
strengths of this operating model :
Managing tariffs: Full ownership model provides freedom to set tariffs to maximize revenue by implementing
dynamic pricing for hourly parkers based on customer demand peaks, patterns and occupancy rate as well as
adjusting subscribers tariffs considering competitive environment without constraint.
Optimizing operations: High flexibility to organize operations in the most efficient way leading to better control over
the cost structure.
Providing attractive in-house services: Indigo is not limited with a contract end and can invest over the long term
in smart and digital services, facilitating customer experience and urban mobility to develop car parks’ attractivity.
Increasing infrastructure portfolio duration with assets located in prime locations and generating recurrent cash
flows without any risk of non-renewal or early termination of contracts.
Taking away the uncertainty of contract renewal and usual loss of margin at renewal.
Page 10Strategy
1.8. …leveraged by innovative mobility platforms…
Digital Services Mobility Services
The app revolutionizing parking A new vision for mobility The most comprehensive
at the heart of cities bike-sharing solution1
The entire range of parking services in just The only French operator offering a The world’s largest bike-sharing contract
one app dockless sharing service for bicycles, in terms of bikes and stations
A seamless customer experience scooters and, soon, electric cars
4 countries 7 cities launched 1,313 docking points
183 cities
14,200 bikes deployed 11,828 bikes deployed
549 car parks
1.9m rides
350k rides in 2019
284,430 spaces in June 2019
+1.3m rides since
55 on-street contracts 195k subscribers
beginning of activity
Notes: KPIs as of 30 June 2019
1. Indigo holds 38.21% of the share capital of Smovengo as of 30 June 2019
Page 11 2019 Half Year Results - September 2019Strategy
1.9. …with adjacent services delivering added value
Indigo Group has developed several highly-relevant add-on businesses with blue-chip partners, servicing the infrastructure platform,
strengthening the Group’s relationship with municipalities and promoting its ability to renew and win new contracts
Vehicle services Mobility services
ECO WASH/ TOTAL WASH SHUTTLING VALET CHARGING STATIONS DIGITAL CAR SHARING
Shuttling opportunities Partnership with Izivia1 to
Additional service Pilot experiment in Paris Rental partnerships with
alongside parking in critical deploy charging stations in
proposed by City Parking in car parks – Ternes, Porte Virtuo, Ubeeqo and Renault
segments such as airports, car parks
Colombia and in many car Maillot and Vendôme in
hospitals, universities and and planned integration
parks in France Paris Gare de Lyon
events within the OPnGO solution
Personal services Neighbourhood services
KITCHEN HUB STORAGE DELIVERY L'ALTERNATIF GRAND FRAIS
Partnership with Muncher
Rental of spaces for Agreement with Correos to Event venue built Last mile logistic platform
to cook and deliver food
individual storage in our install CityPaq in car parks in the underground car
from our car parks in
Paris car parks in Spain park at La Défense
Colombia
Page 12 Notes: 2019 Half Year Results - September 2019
1. Sodetrel became Izivia on 18 October 2018Strategy
1.10. Goal 2025: a strategic roadmap well on track
Achievements since 2017 bringing the group closer to its global mobility
leadership ambition
Goal 2025 Achievements
▪ Focus on concessions and ownerships ✓ Disposal of non-core countries (GE, UK, CZ, SK)
Strengthen ▪ Maintain operational excellence ✓ Acquisition of companies in core countries (Besix
infrastructure ▪ Increase portfolio duration Park in Belgium, Spie Autocité in France)
business model ▪ Improve our efficiency ✓ Acquisition of car parks in full ownership in core
countries (France, Spain, Belgium) +12 since 2017
▪ Focus on countries where Indigo is a leader
▪ Keep focusing on new business ✓ Dynamic pricing based on Business Intelligence
Focus on clients ▪ Digitize our core business and personalise ✓ Adjacent services
offers to B2C clients
and markets to ✓ Pilot on ticketless solutions
grow organically ▪ Be city centric
✓ Automatic detection of abnormal situations and
▪ Develop new uses for our infrastructure behaviour in parking lots (Deepomatic)
▪ Continue to target tuck-in acquisitions
✓ Acquisition of Spie Autocité, Besix Park and
Expand our ▪ Leverage on strong platforms to penetrate the
Professional Parking
footprint Asian market
✓ Joint Venture with Sunsea in China
▪ Consider platform consolidation
▪ Improve our Group practices +120,000 training hours
▪ Grow our talent ✓ On boarding since 2017
Grow our talent ✓ Career evolution
and Group culture ▪ Foster international culture +1,057 employees
▪ Create risk management culture ✓ Brand attractiveness since 2017
▪ Expand OPnGO as an independent global
digital parking platform ✓ Start up lab with partners
Make MDS1 a
leader in mobility ▪ Offer a mobility alternative in city centers
and digital ✓ Search for new financial and / or strategic
▪ Develop synergies between activities
partners
▪ Develop alliances and partnerships
Note:
Page 13 1. Mobility & Digital Solutions 2019 Half Year Results - September 2019Strategy
1.11. New shareholding structure
New shareholding structure since 17 September 2019
Management Treasury shares
32.9% 14.2% 47.1% 5.2% 0.5%
Infra Foch
Topco S.A.S.
100%
Indigo Group
S.A.S.
▪ Investors dedicated to infrastructure, already benefiting from a good knowledge of the car park sector
▪ Long-term investment horizon
▪ Determined to maintaining a consistent financial policy in terms of investment, leverage and business profile
▪ Responsible investors, integrating CSR considerations into their investment strategies
▪ Full support to the Group's management team for the implementation of the new "Goal 2025" strategic plan
▪ Crédit Agricole Assurances keeps a substantial part of the shareholding capital of the company with a 47.1% stake
Page 14 2019 Half Year Results - September 20192. Key developments
2.1. Key company acquisitions in H1 2019
16 17
2.2. Key full ownership acquisitions in H1 2019 18
2.3. Key wins in H1 2019 19
2019 Half Year Results - September 2019Key developments
2.1. Key company acquisitions in H1 2019
France / USA / China
SPIE AUTOCITÉ PROFESSIONAL PARKING SUNSEA PARKING
Acquisition Acquisition with LAZ Parking
Joint Venture
20,000 spaces 50 shuttles
▪ Acquisition of Spie Autocité in June 2019, ▪ Acquisition of Professional Parking in March ▪ Joint Venture in which Indigo owns 40%
allowing the Group to develop its long-term 2019 with Sunsea, China's leading parking
concession portfolio and to increase the ▪ California-based shuttle company providing management company operating 200,000
density of its presence in France shuttle services to municipal accounts and parking bays in over 40 cities
▪ 29 car parks and 2 on-street contracts universities in Los Angeles and Orange
located in prime geographical locations in County
Paris and suburbs, Lille and Lyon ▪ 150 employees
▪ Integration well on track and operations
synergies in progress
Page 16 2019 Half Year Results - September 2019Key developments
2.2. Key full ownership acquisitions in H1 2019
France - International
LAS PALMAS DE GRAN CANARIA TRIANA LYON OPÉRA BORDEAUX VOLAILLERS
1,551 spaces 304 spaces 413 spaces
▪ Unique 12 floors multi-storey asset with a ▪ Operation of the car park Opéra located ▪ Construction and operation of a 413-space
prime location in the capital city of Gran steps away from Lyon Presqu'ïle subject to car park as part of a vast real estate
Canaria in the most commercial area of a large renovation project program (housing and offices)
the city ▪ Improves Indigo's positioning in the city ▪ Reinforces Indigo's positioning next to
▪ Most relevant operation reinforcing the centre of Lyon Bordeaux railways station
Group's position in Spain ▪ Ideally located close to the main roads ▪ Operations expected to start in September
▪ Acquisition in February 2019 serving the historic centre 2020
▪ Acquisition in July 2019
Page 17 2019 Half Year Results - September 2019 17Key developments
2.3. Key wins in H1 2019
France
STRASBOURG GARE MARSEILLE ESTIENNE D'ORVES PARIS MAGENTA
7-year concession contract 7-year concession contract 12-year concession contract
1,943 spaces 654 spaces 726 spaces
▪ Renewal of the car park contract managed ▪ Renovation and operation of the car park ▪ Renewal of the car park contract managed
by Indigo since 2007 ideally located steps away from the Old by Indigo since 2004
▪ New services included: carwash, valet Port, one of the most popular places in the ▪ Car park located steps away from Gare de
parking service, electric scooters, city l'Est and Boulevard Magenta and mainly
parcel/luggage lockers… ▪ Operations starting in July 2019 used by residents
▪ Operations starting in June 2019 ▪ Operations starting in August 2019
SAINT RAPHAËL GARE LISIEUX CENTRE HOSPITALIER CAMBRAI CENTRE HOSPITALIER
10-year concession contract 10-year concession contract 35-year concession contract
394 spaces 180 spaces 296 spaces
▪ Contract awarded by SNCF to renovate and ▪ Construction of the access controls of the ▪ Construction of a parking lot on two levels
operate the car park ideally located in the short-term (30 spaces) and visitor (150 for visitors and operation of the entire
city center and providing direct access to spaces) parking lots parking lot integrating more than 800 car
the station shops and platforms ▪ Equipment and renovation of the parking park spaces
▪ Operations starting in August 2019 area ▪ Operations expected to start in March 2021
▪ Operations expected to start in Jan 2020
Page 18 2019 Half Year Results - September 2019Key developments
2.3. Key wins in H1 2019
International
CALGARY INTERNATIONAL AIRPORT
JUAZEIRO JUÀ GARDEN SHOPPING BARCELONA PLAZA WAGNER & MERCAT LA MERCÈ
3-year management contract
15-year lease 13,000 spaces 41-year concession contract
1,055 spaces 812 spaces
▪ Management of the parking facilities and
▪ Operation of the car park of Juà Garden ▪ Operation of two car parks in Barcelona city
implementation of a complete range of
Shopping mall owned by Tenco center
related services
▪ Strengthens the existing relation Tenco x ▪ Launch of technological solutions (guidance
▪ Strengthen Indigo's #1 position in the
Indigo (11 car parks in Brazil) system with cameras) to improve
Canadian airport sector
▪ Start of operations in April 2019 operational and commercial services
▪ Start of operations in April 2019
▪ Start of operations in July 2019
LOS ANGELES INTERNATIONAL AIRPORT LUXEMBOURG NEIPPERG ANTWERP AIRPORT
3-year management contract 10-year lease contract 20-year concession contract
100 spaces 677 spaces 170 spaces
▪ Operation of LAX newly built Taxi and TNC ▪ Operation of a two-storey car park located ▪ New infrastructure deal
pick-up surface lot with LAZ Parking as in Luxembourg city center ▪ Duration extension against new investment
prime contractor and First Transit as ▪ Before launching the tender, the city made a to improve the parking infrastructure
shuttle sub €21m investment to enhance the
▪ Strengthen LAZ/Indigo presence at one of attractiveness of the car park
the largest airport hub in North America ▪ Start of operations expected in autumn 2019
▪ Start of operations expected in Oct. 2019
Page 19 2019 Half Year Results - September 20193. Highlights
3.1. Key corporate milestones
21 22
3.2. A strong performance in H1 2019 23
2019 Half Year Results - September 2019Highlights
3.1. Key corporate milestones
January 24th February 28th March 25th March 27th May 31st June 3rd June 19th
Sale of the Acquisition of Launch of a Exclusive negotiations Takeover of Closing of the Success of two
subsidiary in Aparcamientos joint venture with a view to an West Park acquisition of new issuances
Czech Republic Triana S.A. in with Sunsea evolution of the Parking Spie batignolles totaling 250
Spain Parking shareholding Services concessions million euros on
structure of Indigo parking the debt capital
Group activities markets
January February March April May June
In accordance with the strategy consisting of focusing its business in countries where the Group can become a leader or co-
leader, the Group completed the disposal of its subsidiary in Czech Republic following the disposal of its subsidiaries in the
United Kingdom, Germany and Slovakia in December 2018.
Acquisition of Aparcamientos Triana S.A. in Spain, a company owning a 1,551-space car park in Gran Canaria.
Launch of a joint venture with Sunsea Parking, China's leading parking management company, to drive investment in the next
generation of parking platforms in China which will be built to facilitate a range of vehicles including electric and autonomous
cars. The JV will focus initially on China before expanding into the broader ASEAN and central Asia market.
Announcement that Ardian, a 49.2% shareholder in Infra Foch Topco, which owns 100% of Indigo Group, had entered in exclusive
negotiation with a view to selling its stake to funds managed by responsible investment manager Mirova and Meag, the asset
manager of Munich Re and Ergo.
Acquisition of one share of West Park Parking Services in Canada by Indigo Park Canada that gives Indigo Park Canada sole
control over West Park Parking Services and the obligation to acquire all of the remaining shares in two tranches of 24.5% each
in 2020 and 2021.
Finalization of the acquisition of Spie batignolles concessions parking activities, operated under the Spie Autocité brand. This
acquisition, that is highly complementary to the Group activities, allows it to pursue the development of its long-term concession
portfolio and to increase the density of its presence in France by integrating car parks enjoying prime geographical locations.
Successful pricing of two new issuances on the debt capital markets:
• A 100 million euros tap on existing bond: the bonds issue of 100 million euros took the form of a tap on the 700 million euros
initial tranche maturing 19 April 2028 with a coupon of 1.625%
• A new 150 million euros private placement: the private placement amounting to 150 million euros has been arranged under a
German NSV format with a 20-year maturity (4 July 2039) bearing 2.250% annual coupon.
Page 21 2019 Half Year Results - September 2019Highlights
3.2. A strong performance in H1 2019
Revenue €459.0m
EBITDA pre IFRS16 €145.2m
EBITDA post IFRS16 €164.4m
Proportionate
Global
EBITDA margin pre IFRS 16 31.6%
EBITDA margin post IFRS 16 35.8%
Average remaining duration1 24.6 years
Financial leverage2 6.4x
Free Cash Flow3 generation €77.9m
IFRS
Cash Conversion Ratio 50.1%
Notes:
1. Weighted average residual maturity of infrastructure business based on Global Proportionate normative Free Cash Flow in 2018, assuming a 99-year duration for ownerships
and exercise of options for long-term leases with renewal at INDIGO’s discretion ; Germany, the UK, Slovakia and Czech Republic are excluded from the calculation
2. Financial leverage: Global Proportionate net financial debt (€2,121.0m) / Global Proportionate LTM EBITDA (€329.3m). GP LTM EBITDA restated : +€17.1m (major acquisitions of Spie
Autocité and Las Palmas car park restated on a full year basis) -€7.4m (H2 2018 EBITDA of the entities disposed of in UK/DE/CZ/SK) +€16.2m (no IFRS16 debt in H2 2018 /
estimation based on H1 EBITDA impact)
3. Free Cash Flow = EBITDA - other P&L cash items - change in WC - fixed royalties and fixed leases - maintenance capex
Page 22 2019 Half Year Results - September 20194. Indigo Group: An infrastructure asset
4.1. A robust infrastructure model…
24 25
4.2. …providing a strong predictable cash flow 26
2019 Half Year Results - September 2019Indigo Group: An infrastructure asset
4.1. A robust infrastructure model…
2018 EBITDA3 breakdown by contract type 2018 average remaining duration of infrastructure business1,5
12.0% of EBITDA comes
from short-term contracts,
i.e. short-term leases and
management 88.0% of EBITDA 25.7 FY2017
FY2018
contracts
comes 24.6
from infrastructure
business4
5.5
7.6
24.0
22.5
Long-term lease
6% Ownership 34.8
12%
33.0
36.0
24.6
years1,2,5 29.8
51.0
Concession 52.0
82%
€5.6bn2 of secured normative Free Cash Flow3 with 24.61 years of average remaining maturity at the end of 2018
Notes
1. Weighted average residual maturity of infrastructure business based on Global Proportionate normative Free Cash Flow in 2018, assuming a 99-year duration for ownerships and exercise
of options for long-term leases with renewal at INDIGO’s discretion, excluding car parks under construction but not yet operating ; Germany, the UK, Slovakia and Czech Republic are
excluded in the calculation
2. Excluding car parks under construction but not yet operating
3. Pre IFRIC 12 global proportionate EBITDA
4. 93% of the 2018 pre IFRIC 12 IFRS EBITDA is generated by the infrastructure business
Page 24 5. 2018 excludes Qatar, the UK, Germany, Slovakia and Czech Republic 2019 Half Year Results - September 2019Indigo Group: An infrastructure asset
4.2. …providing a strong predictable cash flow
Infrastructure1 run-off portfolio will generate c. €5.6bn of normative cash
flow
2018
2018 normative
normative Free
Free Cash Flow22 run-off
Cash-Flow run-off3 (Global
3
(Global Proportionate,
Proportionate) €m)
€5,624.8m on portfolio
5,624.8 duration
5,584.7 (42.3)
5,404.5 (42.0)
4
180.2 (41.7)
(159.8) (39.7)
(155.8) (39.2)
1,429.8 (147.4) (34.2)
1,544.2 1,364.0 (32.8)
(135.9) (32.5)
(127.5) (30.3)
(122.3) (29.5) 3,970.9
(116.9)
(112.1)
(108.3)
(103.9)
1,065.8
€1,653.9m between
4,195.0 2019 and 2028
4,040.4 4,040.4
2,905.1
Total Total Total 2019 2020 2021 2022 2023 2024 2025 2026 2027 2028 Post
2017 2017 PF 2018 2028
(reported
last year)
5
France International
Notes:
1. Infrastructure means ownerships, concessions and long-term leases (including 99 years duration for ownerships and exercise of options for long-term
leases with renewal at INDIGO’s discretion). Excluding car parks under construction but not yet operating
2. Normative Free Cash Flow = EBITDA - fixed royalties - normative maintenance capex
3. Based on FY 2018 normative Free Cash Flow and considering no change in volume and prices
4. €180.2m = The UK, Germany, Slovakia and Czech Republic
5. After 2018, International includes Belgium, Brazil, Canada, Colombia, Luxembourg, Spain and Switzerland
Page 25 2019 Half Year Results - September 20195. Financial performance
5.1. Revenue
27 28
5.2. EBITDA 30
5.3. Income Statement 32
5.4. Capital Expenditure 34
5.5. Cash Flow 35
2019 Half Year Results - September 2019Financial performance
5.1. Revenue 1/2
Growth in parking and Mobility & Digital activities
Global Proportionate – Revenue bridge H1 2018 to H1 2019 (in €m)
Parking activity at constant FX: +€15.6m (+3.6%)
6.0
(33.7) (3.1) 3.6
19.4
467.5 (7.6)
459.0
7.0
453.0
433.8
H1 2018 Subsidiaries H1 2018 France Europe North America Iberica & South Mobility & H1 2019 Forex H1 2019
Revenue disposed of 1 Revenue excl. America Digital Revenue Revenue
subsidiaries Solutions 2 before FX
disposed of
In H1 2019, Global Proportionate Revenue excluding disposal of subsidiaries increased by 5.8% at
constant FX, mainly driven by North America with a strong operational performance and the
integration of Professional Parking, specialized in shuttling in the US, the full year impact of the
acquisition of Besix Park in Belgium, and the growing contribution from MDS, with a negative
impact of France due to the yellow vest protests as well as contract variations.
Notes:
1. Disposal of subsidiaries in Russia in April 2018, in the UK, in Germany and in Slovakia in December 2018 and in Czech Republic in January 2019
2. Of which Smovengo, INDIGO® weel and OPnGO
Page 27 2019 Half Year Results - September 2019Financial performance
5.1. Revenue 2/2
Diversified and balanced portfolio
Global Proportionate Revenue per business unit (in €m)
459.0
433.8
Iberica & MDS 1% Iberica & MDS 2%
South 210.0 South
America 14% America 11%
217.6 France -3.5% France 46%
France 50%
30.9
H1 20181 H1 2019
€433.8m 23.8 Europe +29.1%2 €459.0m
155.0
128.2
North
America 30%
NA +14.3%2 North
America 34%
Europe 5% Europe 7%
IBSA -5.5%2
58.6 53.8
5.6 MDS +64.5% 9.2
H1 2018 H1 2019
1
excl. subsidiaries disposed of
France Europe North America Iberica & South America MDS
Strong growth in Europe and North America leading to geographical rebalancing of portfolio.
Notes:
IBSA = Iberica & South America; NA = North America; MDS = Mobility & Digital Solutions
1. H1 2018 Revenue excl. revenue from subsidiaries disposed of in Russia, in the UK, in Germany, in Czech Republic and in Slovakia
2. Growth rate at constant Fx
Page 28 2019 Half Year Results - September 2019Financial performance
5.2. EBITDA 1/2
Global Proportionate – EBITDA bridge H1 2018 to H1 2019 (in €m)
19.1
(7.9) Parking activity at constant FX: -€1.9m (-1.2%)
164.4
2.6 (1.8)
(7.6) 0.2
156.6 1.0
2.1
148.7 EBITDA growth -2.3% at current FX
145.0 145.2
H1 2018 Countries H1 2018 France Europe North Iberica & Mobility & H1 2019 Forex H1 2019 IFRS 16 H1 2019
EBITDA disposed of 1 EBITDA excl. America South Digital EBITDA EBITDA EBITDA
subsidiaries America Solutions 2 before FX pre IFRS 16 post IFRS 16
disposed of
In H1 2019, Global Proportionate EBITDA reached €164.4m after taking into account IFRS16 impact of
€19.1m that came into force in January 2019. Excluding disposal of subsidiaries, H1 2019 EBITDA
decreased by -2.5% at constant FX reflecting the lag in revenue in France and MDS activities still in
ramp-up.
Notes:
1. Disposal of subsidiaries in Russia in April 2018, in the UK, in Germany and in Slovakia in December 2018 and in Czech Republic in January 2019
2. Of which Smovengo, INDIGO® weel and OPnGO
Page 29 2019 Half Year Results - September 2019Financial performance
5.2. EBITDA 2/2
Attractive EBITDA margins across business units
Global Proportionate EBITDA per business unit (in €m)
EBITDA margin post IFRS 151
-2.5% at
148.7 145.2
H1 20185 constant FX3 H1 20195
H1 20182 H1 20194 Δ
IBSA IBSA
France 55.7% 54.1% 10% 11%
NA NA
4% 6%
Europe 121.2 113.6
Europe 48.9% 44.9% 8% France -6.3% Europe
9% H1 2019
H1 20182
EBITDA pre IFRS 16:
EBITDA: €148.7m
€145.2m
Margin: 34.3%
Margin: 31.6%
NAUK 5.4% 5.4%
Europe +18.3%3 13.9
11.6
8.3 France
France 7.0 NA +13.3%3 74%
78%
15.1 IBSA +17.7%3 17.5
IBSA 25.8% 32.5%
(6.2) (8.0)
H1 2018 excl. H1 2019 pre IFRS 16
2
subsidiaries disposed of
Total
34.3% 31.6% France Europe NA IBSA MDS
Group
High EBITDA margin despite a decreased in H1 2019 due to the impact of yellow vests protests in
France.
Notes:
IBSA = Iberica & South America; NA = North America; MDS = Mobility & Digital Solutions
1. EBITDA margin post IFRS 15 at current FX rates
2. H1 2018 figures excl. subsidiaries disposed of in the UK, Germany, Slovakia, Czech Republic and Russia
3. Growth rate at constant currency
Page 30 4. H1 2019 EBITDA pre IFRS 16 2019 Half Year Results - September 2019
5. Breakdown excluding MDSFinancial performance
5.3. Income Statement 1/2
Revenue GP to Revenue IFRS EBITDA GP to EBITDA IFRS
in €m H1 2018 H1 2019 Δ in €m H1 2018 H1 2019 Δ
Revenue - GP 467.5 459.0 (1.8%) EBITDA - GP 156.6 164.4 4.9%
Subsdiaries disposed of (33.7) - (100.0%) Subsdiaries disposed of (7.9) - (100.0%)
Revenue - GP excl subsidiaries disposed of 433.8 459.0 5.8% EBITDA - GP excl subsidiaries disposed of 148.7 164.4 10.5%
USA 91.3 113.7 24.4% USA 5.0 8.4 69.5%
Colombia & Panama 4.6 4.5 (2.4%) Colombia & Panama 0.3 0.5 40.2%
Smovengo 4.2 7.6 n.a. Smovengo (2.4) (1.6) n.a.
Other 3.7 3.6 (2.7%) Other 1.7 1.5 (9.3%)
Revenue - IFRS excl subsidiaries disposed of 329.9 329.6 (0.1%) EBITDA - IFRS excl subsidiaries disposed of 144.1 155.6 7.9%
From EBITDA to net income (IFRS) – H1 2019 (€m)
PPA amortization €15.2m
IFRIC 12 (fixed royalties) €28.7m
IFRS 16 (fixed lease) €16.4m
155.6 (106.7)
2
0.7 (6.5) 43.1 (22.5)
3
(0.3) 20.3 (19.7)
1
0.6
1
EBITDA Depreciation and Net provision Other items EBIT Cost of net Other financial EBT Income tax Net income
H1 2019 IFRS amortization charges and non- financial debt income/expenses expenses
current
depreciation
Note:
1. Net income attributable to non-controlling interest amounted to €0.4m for H1 2019. Net income attributable
Page 31 to owners of the parent amounted to €0.2m 2019 Half Year Results - September 2019Financial performance
5.3. Income Statement 2/2
From EBITDA to net income (IFRS)
1 PPA impact 2 Cost of net financial debt 3 Income tax expenses
▪ Purchase Price Allocation impact ▪ Cost of net financial debt1 ▪ Consolidated income tax expenses
mainly reflects the recognition of amounted to €22.5m in H1 2019 amounted to €19.7m in H1 2019
the amortization charge relating to compared to €38.7m in H1 2018 against €23.8m in H1 2018.
valuation differences allocated to (€19.1m2 after restatements of H1 ▪ Effective tax rate across Indigo
assets’ fair values for long-term 2018 one-off costs related to the Group amounted to 65.0% in H1
contracts and management or refinancing of the 2020 bond). 2019 against 112.3% in H1 2018. This
service contracts. This valuation ▪ The average cost of debt includes for both periods negative
was performed following the (excluding IFRIC12 and IFRS16) impacts of the non activation of
acquisition of Indigo Infra by Indigo decreased to 2.0% in H1 2019 fiscal deficit in certain countries
Group in June 2014. compared to 2.6% in H1 20182. where the Group operates,
▪ H1 2019 total PPA amortization especially in Brazil and in Mobility &
amounts to €15.2m which includes Digital Solutions, share of costs
€9.8m related to the acquisition of and charges on dividends in
Indigo Infra by Indigo Group, €1.7m France and tax loss carry forward
amortization charge on valuation not indemnized by Infra Foch
differences resulting from the Topco (mother company).
takeover of the Brazilian business ▪ The evolution of effective tax rate
in the second quarter of 2016 and is mainly due to decrease in the
€2.1m historical PPA from Indigo non activated fiscal deficit of Indigo
Infra. Group which was impacted in H1
2018 by the refinancing of the
2020 bond.
Notes:
1. Reported cost of net financial debt (including cost relating to IFRIC12 and IFRS16)
2. H1 2018 restated from one-off costs related to the refinancing of the 2020 bond (impact of the exercise of the make-whole call for €19.8m, early termination of a swap
-€2m, amortized cost on the 2020 bond for €1.9m)
Page 32 2019 Half Year Results - September 2019Financial performance
5.4. Capital Expenditure
Continuous investments in parking infrastructure
Capex evolution 2013 – 2018, incl. IFRIC 12 / IFRS 16 impacts
Capex breakdown (Development and Maintenance)
(€m)
MDS 184 73
173 160
The €37.7m of IFRIC 8%
145 13 59 4.7
12 impacts were 62 26 135
37.7
mainly related to 105 33
25
84 31 54.4 9.4
new concessions in IBSA 21 28 57.1
8.5 47.7
France and Belgium 24% 22 123
74 75 107
40 85 71.7 60.9
H1 2019 21 10 (1) 16 11 (0.1)
The €4.7m of IFRS 16 €57.1m France
impacts were 53%
mainly related to NAUK (118)
new leases in 1%
France and Spain
Europe
14%
2013 2014 2015 2016 2017 2018 H1 2018 H1 2019
Financial c apex Devel opment c apex Maintenance capex Fixed royalties (IFRIC 12) Fixed leases (IFRS 16)
Financial Capex amounted to €60.9m in H1 2019 including the acquisition cost of Las Palmas de
Gran Canaria car park in Spain and the acquisition of Spie autocité partly offset by the cash
proceeds received from the disposal of the subsidiary in the Czech Republic.
Main development Capex in H1 2019 include:
▪ Construction work in car parks in Paris, Bordeaux and Brussels
▪ New lease contracts in Brazil (mainly shopping malls)
▪ Digital and Mobility capex
Page 33 2019 Half Year Results - September 2019Financial performance
5.5. Cash Flow
Indigo Group cash flow bridge (IFRS) – H1 2019 (€m)
Application of
IFRS 16 in Jan 19 o/w €14.0m related to the
to the integration of Spie
Autocité (mainly annual Including €103m
fixed royalties paid at the proceeds from
(16.2) end of June) the €100m tap of
155.6
139.4
the 2028 bond Acquisition of
(23.5)
Spie Autocité
and Triana
(30.3)
Aparcamientos
(7.7) 70.2 (49.6)
77.9
Compared
(26.0)
to -€80.6m
in H1 2018
(31.2)
(61.1)
1.9 (5.7)
17.0
(116.7)
Cash Conversion Ratio (93.1)
excl. IFRS16: 55.9%
excl. IFRS16 & Spie Autocité: 66.3%
Cash Conversion Ratio
post IFRS 16: 50.1%
EBITDA IFRS Fixed leases EBITDA IFRS Change in Fixed Car park Free Cash Interests Taxes paid Dividends Other Free Cash- Net Development Financial Dividends Change in
post IFRS 16 pre IFRS 16 WCR and royalties maintenance Flow paid received financial Flow before borrowings capex1 capex paid net cash
current capex from JV elements dividends, position
provision dev and fin
capex and
financing
Notes:
1. Development capex include other maintenance capex non relating to car parks
Page 34 2019 Half Year Results - September 20196. Financial policy
6.1. Successful issuances on debt capital market
36 37
6.2. Enhanced financial firepower 38
6.3. Strong financial structure 39
6.4. “European leader of its sector” by VIGEO 40
2019 Half Year Results - September 2019Financial policy
6.1. Successful issuances on debt capital market
Context
▪ On 19 June, Indigo Group initiated a debt raising on the capital markets in a context of strong decrease in rates
and spreads, for a total amount of €250m with a combination of both a €100m tap of the €700m 1.625% April
2028 bond (closed in June) and a €150m German NSV private placement with a 20y maturity (closed in July).
▪ These two transactions allow Indigo Group to increase its liquidity with a view to continuing the development of
its long-term infrastructure portfolio. With these new issues the group diversifies its funding and extends its
debt maturity profile with long-dated placements while benefiting from attractive market conditions.
€100m tap of the the €700m 1.625% April 2028 bond €150m German NSV private placement
Issuer: Indigo Group SAS Issuer: Indigo Group SAS
Issuer rating: BBB Stable (S&P) Issuer rating: BBB Stable (S&P)
Notional: €100m Notional: €150m
Coupon: 1.625% Coupon: 2.250%
Type: Senior unsecured Format: Namensschuldverschreibung
Trade date: 19 June 2019 Governing law: German law
Settlement date: 26 June 2019 Instrument type: Senior unsecured
Maturity: 19 April 2028 Trade date: 19 June 2019
Initial price thoughts: MS + 120 bps area Issue date: 4 July 2019
Revised guidance: MS + 105-110 bps (WPIR) Maturity: 4 July 2039
Final pricing: MS + 105 bps Re-offer spread: MS+105 bps
Oversubscription: c.3.0x at final terms Arranger: Goldman Sachs International
Joint Bookrunners: CACIB & SGCIB Initial investor: Goldman Sachs International
Page 36 2019 Half Year Results - September 2019Financial policy
6.2. Enhanced financial firepower
Debt maturity profile as of June 30, 2019 (in €m)
800
A cash position of
c. 213m as of 30 650
June 2019
300 300 300 300 300
No refinancing
125
need before 2025 100
2019 2020 2021 2022 2023 2024 2025 2026 2027 2028 2029 2030 2031 2032 2033 2034 2035 2036 2037
A €300m RCF Bond 2028 Bond 2025 Bond 2029 Bond 2037 Available RCF (unused)
fully unused to
date and
maturing in Oct S&P rating “BBB stable” Optimize financing costs
2023 ▪ On 20 September 2019, S&P confirmed Indigo ▪ A decreasing net debt cost (incl. shareholder loan):
Group’s credit rating of BBB and its stable outlook 3.9%
A demonstrated ▪ To maintain this credit rating, Indigo Group: 2.9%
2.6%
access to bond ✓ targets adjusted FFO/Debt ratio to remain 2.4% 2.4%
2.0%
markets, with a comfortably above 10% at all times
confirmed BBB ✓ calibrates dividend policy to commensurate
rating with target credit ratios
✓ ensures that the share of infrastructure 1
2014 2015 2016 2017 2018 H1 2019
businesses will continue to represent the great
majority of EBITDA (>70% of IFRS EBITDA) ▪ Limited exposure to interest rate risk
✓ maintains at least an “adequate” liquidity level
✓ Maintain at least 60% of fixed or capped rate
(current liquidity level is strong)
debt as per the group financing policy
▪ Indigo Group will be maintained as the main group
funding vehicle to limit structural subordination in ✓ As of June 30, 2019, c.90% of the Group’s debts
line with S&P’s guidelines bear fixed rate (after hedging)
▪ Positive impact of variable-rate derivatives
entered into in November 2018
Note:
1. 2018 restated from one-off costs related to the refinancing of the 2020 bond (impact of the exercise of the
Page 37 make-whole call for €19.8m, early termination of a swap -€2m, amortized cost on the 2020 bond for €1.9m)2019 Half Year Results - September 2019Financial policy
6.3. Strong financial structure
Simplified structure chart as of June 30, 2019 Indigo Group’s net financial debt (IFRS)
New funding In €m 31/12/2018 30/06/2019
30/06/2019
Restated2
∆
vs 31/12/18
raised in 26 June Ardian
Crédit Agricole
Management Bonds 1,566.5 1,672.7 1,672.7 106.2
Assurances 0.1
2019 through a Revolving credit facility (0.5) (0.4) (0.4)
Other external debts 42.7 39.8 39.8 (2.9)
€100m tap of the 49.2% Convertible 49.2% 1.6% Shareholder loan - - - -
21.3 12.0 12.0 (9.3)
existing €700m bonds €347m Accrued interests
Long-term financial debt excl. fixed royalties and fixed rents 1,630.0 1,724.1 1,724.1 94.1
2028 bond to
IFRS
Financial debt related to fixed royalties 333.4 413.7 413.7 80.3
finance Financial debt related to fixed rents 182.6 182.6 182.6
development of Syndicated RCF: €300m Infra Foch
Total long-term financial debt 1,963.4 2,320.3 2,320.3 356.9
+
infrastructure Bonds:
Topco S.A.S. Net cash (329.0) (212.8) (212.8) 116.2
(1.2) (3.1) (3.1) (1.9)
portfolio. Apr. 2025 - €650m
Hedging instruments FV
Net financial debt 1,633.1 2,104.4 2,104.4 471.3
Apr. 2028 - €800m1 100.0%
LTM EBITDA 295.5 298.9 324.8 29.3
+
Net financial leverage 5.5x 7.0x 6.5x 1.0x
An additional Private placements: Indigo Group
S.A.S.
€150m private Jul. 2029 - €100m
Jul. 2037 - €125m
FCPE Indigo Group’s net financial debt (GP)
placement traded
on 19 June 2019 100.0% 99.8%
In €m 31/12/2018 30/06/2019
30/06/2019
restated2
∆
vs 31/12/18
0.2%
has been settled Net financial debt 1,637.2 2,121.0 2,121.0 483.8
GP
on 4 July 2019. Mobility and Digital
LTM EBITDA 307.7 303.4 329.3 21.6
Indigo Infra S.A.
Solutions Net financial leverage 5.3x 7.0x 6.4x 1.1x
100.0% 100.0%
€182,6m of debt Other
debts: S&P ratios
related to fixed c.€39m
In €m 31/12/2017 31/12/2018 ∆
rents added INDIGO® weel OPnGO Subsidiaries FFO 265.1 238.9 (26.2)
Net debt 1,913.9 1,823.7 (90.2)
following the FFO/net debt 13.9% 13.1% (0.0)
application of EBITDA 354.7 338.5 (16.2)
IFRS16 standards Net
5.4x 5.4x (0.0x)
debt/EBITDA
on 1 Jan 2019
Group financial leverage slightly increased to 6.4x2 (GP) following the acquisitions in France and
Spain in 2019 and the disposal of 4 subsidiaries in the UK, Germany, and Slovakia in December 2018
and in the Czech Republic in January 2019.
Notes:
1. New funding raised in 26 June 2019 through a €100m tap of the €700m 1.625% due in April 2028
2. Based on a restated EBITDA : +€17.1m (major acquisitions of Spie Autocité and Las Palmas car park restated on a full year basis) -€7.4m (H2 2018 EBITDA of the
Page 38 entities disposed of in UK/DE/CZ/SK) +€16.2m (no IFRS16 debt in H2 2018 / estimation based on H1 EBITDA 2019 Half Year Results - September 2019
impact)Financial policy
6.4. “European leader of its sector” by VIGEO
VIGEO rating agency awarded Indigo Group a 61/100 rating as part of the extra-
financial rating process on March 13th 2018
51 Scores1
Benchmark sector: Scoring obtained Governance 63 +
Business Support Services Europe by 35.6
INDIGO Corporate
68 ++
behaviour
29.6
Involvement
61
35 =
in the community
35,3
Percentage of information 93%
Human rights 59 ++
27.8
Level of co-operation of Human resources 62 ++
Proactive
100
the company 37.5
Environment 59 +
Ranking in Europe 1/54
Average
Infra Park Performance
Ranking worldwide 55/4.159 performance
of the sector (Europe)
Extract from VIGEO synthesis:
Responsiveness “The Company has shown interest in its Company's CSR performance based on Vigeo Eiris' rating and has been cooperative by providing
enough details and documents related to its ESG strategy. This has positively impacted its performance.”
Relations with employees' “The Company has a detailed commitment to freedom of association and the right to collective bargaining. Indigo Group has shown the
representatives importance of negotiation and the inclusion of employees' representatives in its decisions' making.”
Environmental strategy “The Company has extensively addressed its environmental strategy and has formalised its commitments to decrease its impact on the
environment and has adopted different strategies to decrease its energy consumption and impacts from transport.”
“The Company shows an advanced performance in its governance pillar. Indigo Group respects the number of non-executives and
Governance and CSR
independent members within the Board and CSR issues are included in many aspects of the Company's governance, as they are discussed
at Board level and taken into account while setting executives' remuneration.”
Note:
Page 39 1. Ratings outline companies’ benchmarked domain performance within a sector, on a 5-level scale: “--”, “-”, “=”, “+”, “++” 2019 Half Year Results - September 20197. Appendix
7.1. Balance Sheet (IFRS)
41 42
7.2. Financial performance by country 43
2019 Half Year Results - September 2019Appendix
7.1. Balance Sheet (IFRS)
H1 2019
Assets €m Liabilities €m
Concession intangible assets 1,130.2 Share capital 160.0
Goodwill 824.0 Share premium 283.6
Property, plant and equipment 701.4 Other 103.6
Concession tangible assets 172.3 Consolidated shareholder's equity 547.2
Investments in companies under equity method 114.7
Others assets 133.9 Minority interests 12.1
Non-current derivatives 7.3 Total equity incl. minority interests 559.3
Total non-current assets 3,083.8
Provisions 107.5
Financial debt excl. IFRIC 12 and IFRS 16 impact on debt 1,729.5
IFRIC 12 impact on debt 413.7
IFRS16 impact on debt 182.6
Current derivatives 0.2 Current derivatives 4.4
Current assets 267.3 Current liabilities 414.3
Cash management financial assets and cash 218.2 Deferred tax 158.4
Total 3,569.5 Total 3,569.5
Page 41 2019 Half Year Results - September 2019Appendix
7.2. Financial performance by country
H1 2019 – Global Proportionate
H1 2019 Global Proportionate
in €m Revenue % Revenue EBITDA % EBITDA
France 210.0 45.8% 119.4 69.4%
Belgium 20.9 4.6% 11.8 6.9%
Luxembourg 6.3 1.4% 1.9 1.1%
Switzerland 3.6 0.8% 2.5 1.5%
Europe 30.9 6.7% 16.3 9.5%
Canada 41.4 9.0% 9.6 5.6%
USA 113.7 24.8% 7.1 4.1%
North America & United Kingdom 155.0 33.8% 16.7 9.7%
Brazil 26.5 5.8% 7.6 4.4%
Spain 22.8 5.0% 11.7 6.8%
Colombia 4.0 0.9% 0.5 0.3%
Panama 0.5 0.1% (0.0) 0.0%
Russia - 0.0% (0.0) 0.0%
IBSA 53.8 11.7% 19.8 11.5%
Total Indigo Group 449.8 98.0% 172.1 100.0%
Mobility & Digital Solutions 9.2 2.0% (7.7) n.a.
Total Infra Foch Topco 459.0 100.0% 164.4 100.0%
Page 42 2019 Half Year Results - September 2019You can also read