2019 Interim Results 15 August 2019 - GVC Holdings

Page created by Virgil Collins
 
CONTINUE READING
2019 Interim Results 15 August 2019 - GVC Holdings
2019 Interim
Results
15 August 2019
2019 Interim Results 15 August 2019 - GVC Holdings
Disclaimer
  NOT FOR PUBLICATION OR DISTRIBUTION IN WHOLE OR IN PART IN, INTO OR FROM ANY JURISDICTION WHERE TO DO
  SO WOULD CONSTITUTE A VIOLATION OF THE RELEVANT LAWS OR REGULATIONS OF THAT JURISDICTION. This
  presentation has been prepared by GVC Holdings PLC (“GVC”). This presentation includes statements that are, or may be deemed
  to be, “forward-looking statements”. These forward-looking statements can be identified by the use of forward-looking terminology,
  including the terms "believes", "estimates", "anticipates", "expects", "intends", "plans", "goal", "target", "aim", "may", "will", "would",
  "could" or "should" or, in each case, their negative or other variations or comparable terminology. These forward-looking statements
  include all matters that are not historical facts. By their nature, forward-looking statements involve risks and uncertainties because
  they relate to events and depend on circumstances that may or may not occur in the future and may be beyond GVC’s ability to
  control or predict, and future events and circumstances can cause results and developments to differ materially from those
  anticipated. Nothing in this presentation should be construed as a profit forecast. Forward-looking statements are not guarantees of
  future performance and hence may prove to be erroneous. Other than in accordance with its legal or regulatory obligations (including
  under the Market Abuse Regulation (596/2014), the Listing Rules, the Disclosure Guidance and Transparency Rules and the
  Prospectus Rules), GVC does not undertake any obligation to update or revise publicly any forward-looking statement, whether as a
  result of new information, future events or otherwise.

  No representation or warranty (express or implied) of any nature is given nor is any responsibility or liability of any kind accepted by
  GVC or any of its directors, officers, employees, advisers, representatives or other agents, with respect to the truthfulness,
  completeness or accuracy of any information, projection, representation or warranty (express or implied), omissions, errors or
  misstatements in this presentation, or any other written or oral statement provided. Nothing contained in this presentation is intended
  to constitute an invitation or inducement to engage in investment activity for the purposes of the prohibition on financial promotions in
  section 21 of the UK Financial Services and Markets Act 2000. In making this presentation available, GVC makes no recommendation
  to buy, sell or otherwise deal in shares of GVC or in any other securities or investments whatsoever and you should neither rely nor
  act upon, directly or indirectly, any of the information contained in this presentation in respect of any such investment activity. Any
  recipients of this presentation outside the UK should inform themselves of and observe any applicable legal or regulatory
  requirements in their jurisdiction, and are treated as having represented that they are able to receive this presentation without
  contravention of any law or regulation in the jurisdiction in which they reside or conduct business. In particular, the securities referred
  to in this presentation have not been and will not be registered under the U.S. Securities Act of 1933 and may not be offered, sold or
  transferred within the United States except pursuant to an exemption from, or in a transaction not subject to, the registration
  requirements of the U.S. Securities Act of 1933. By accepting this presentation, you agree to be bound by the foregoing provisions,
  limitations and conditions.

GVC Holdings PLC | 2019 Interim Results | 15 August 2019                                                                                        2
2019 Interim Results 15 August 2019 - GVC Holdings
Contents

  Introduction                                             Kenneth Alexander

  Financial Review                                         Rob Wood

  Operational Update                                       Kenneth Alexander

  Summary                                                  Kenneth Alexander

GVC Holdings PLC | 2019 Interim Results | 15 August 2019                       3
2019 Interim Results 15 August 2019 - GVC Holdings
Overview
  •       Continued strong operational and financial performance

  •       Market share gains in all major Online territories

  •       Group underlying proforma EBITDA1 (pre IFRS 16) 7% behind, but 11% ahead after
          adjusting for the Triennial Review and incremental taxes

  •       Full year EBITDA expectations now within a £650m-£670m range (consensus at 1Jan
          2019: c£630m2)

  •       US online launch on track for September with full marketing deployment

  •       Integration progressing well – UK Online platform migrations have commenced

  •       Interim dividend increased by 10% year-on-year

  •       Current trading: strong momentum continues

(1) The Group’s proforma results are unaudited and presented as if the current Group, post the acquisition of Ladbrokes Coral Group plc, had existed since 1 January 2018. The results of Crystalbet and Neds are included from
the dates of acquisition (11 April 2018 and 28 November 2018 respectively)                                                                                                                                                        4
(2) Bloomberg FY19 EBITDA consensus adjusted for previously guided impacts not updated in consensus at the time including Triennial Review timing, increases in UK, Australia and Italy online taxes and Neds acquisition
2019 Interim Results 15 August 2019 - GVC Holdings
Rob Wood
                                                           Chief Financial Officer

GVC Holdings PLC | 2019 Interim Results | 15 August 2019                             5
2019 Interim Results 15 August 2019 - GVC Holdings
Financials: Group P&L
                                                                                        Strong financial performance

                                                           Reported1                                                            Proforma2                                      •    Group proforma NGR +5%
                                                           Pre                                                     Pre                                                              • Online NGR +17%
                                                        IFRS16                                                  IFRS16                                                              • UK Retail NGR -12%
SIX MONTHS                                 2019           2019             2018 Change                     2019   2019                   2018 Change               CC3
ENDED 30 JUNE                               £m              £m              £m      %                       £m      £m                    £m      %                                 • European Retail NGR +7%
                                                                                                                                                                    %
                                                                                                                                                                               •    Group proforma underlying
NGR                                    1,810.6          1,810.6 1,125.1                   61%          1,810.6 1,810.6 1,717.0                            5%        6%              EBITDA (pre IFRS 16) -7%
Revenue                                1,782.1          1,782.1 1,105.9                   61%          1,782.1 1,782.1 1,694.3                            5%        6%              • After adjusting for Triennial
Gross profit                           1,184.1          1,184.1           763.2           55%          1,184.1 1,184.1 1,163.4                            2%                           Review and incremental
                                                                                                                                                                                       taxes +11%
Contribution                              924.9            924.9          582.0           59%             924.9          924.9          923.0             0%
Underlying        EBITDAR4                376.8            376.8          265.8           42%             376.8          376.8          406.4           (7%)                   •    Net debt at 30 June 2019 (pre
Underlying         EBITDA4                366.8            323.4          235.0           56%             366.8          323.4          349.5             5%                        IFRS 16) £1,929.3m

Operating Profit4                         260.3            241.9          188.6           38%             260.3          241.9          277.9           (6%)                   •    2.65x net debt / LTM EBITDA
                                                                                                                                                                                    (pre IFRS 16)
Memo:                                      2019             2018
                                                                                                                                                                               •    Adjusted fully diluted EPS
                                                                                                                                                                                    31.3p (-3%)
No of shares (m)                          581.9            578.1
Diluted EPS                                (0.6)            24.9                                                                                                               •    Interim dividend of 17.6p
Adj. diluted EPS5                          31.3             32.2                                                                                                                    (+10%)
Dividend / share (p)                       17.6             16.0

Pre IFRS 16
Net debt (£m)                        (1,929.3) (1,887.0)
Net debt / EBITDA                        2.65x     2.69x

Post IFRS 16
Net debt (£m)                        (2,279.6) (1,887.0)
Net debt / EBITDA6                       2.79x     2.69x

(1) 2019 and 2018 reported results are unaudited reflect the acquisition of the Ladbrokes Coral Group plc on 28 March 2018 (2) The Group’s proforma results are unaudited and presented as if the current Group, post the
acquisition of Ladbrokes Coral Group plc, had existed since 1 January 2018. The results of Crystalbet and Neds are included from the dates of acquisition (11 April 2018 and 28 November 2018 respectively) (3) Growth on a   6
constant currency basis is calculated by translating both current and prior year performance at the 2019 exchange rates (4) Stated pre separately disclosed items (5) Continuing EPS adjusted for the impact of separately
disclosed items, FX movements on financial indebtedness and gains/loss on derivative financial instruments (6) Proforma basis as if IFRS 16 had been in place for the last twelve months
Financials: Proforma Underlying EBITDA Bridge
                Strong growth in Online and European Retail despite prior year World Cup; UK Retail ahead of expectations

                                               • Total EBITDA growth2 excluding regulatory adjustments and TR impact is +11%
                                               • Online EBITDA growth2 excluding regulatory adjustments is +22%

                                                                                   UK RGD
                                                                                   Italy taxes
                                                                                   Australia POCT                                                                                                                                           £43.4m
                                        (£18.8m)

                                                                                                                                                                      £2.2m                  (£2.1m)      (£2.9m)
                                                                                            (£45.0m)                                                   £43.0m

                                                                                                                                                                                                                                                      £366.8m
                     £349.5m                                                                                              (£2.5m)
                                                                   £330.7m
                                                                                                                                                                                                                            £323.4m

                                                                                                                    1/2                            2              2                      2            2                 2
                                                                                                                                                         Online
                                                                                              UK Retail TR impact

                                                                                                                                                                                              Other
                                          Regulatory adjustments

                                                                                                                            UK Retail incl TR impact
                         H1 18 EBITDA

                                                                     H1 18 EBITDA Rebased

                                                                                                                                                                       European Retail

                                                                                                                                                                                                                             H1 19 EBITDA

                                                                                                                                                                                                                                                        H1 19 EBITDA
                                                                                                                                                                                                            Corporate

                                                                                                                                                                                                                                             IFRS16
                                                                                                                                                                                                                              pre IFRS 16
(1) B2 stakes cut to £2 implemented 1 April 2019
(2) Pre IFRS 16                                                                                                                                                                                                                                                        7
Online
                                                                               Continued very strong growth in Online

                                                                                  Proforma1                                                  NGR +17% (+18% cc)
                                                                                                                                             • UK NGR +13%
                                                                        Pre
                                                                     IFRS16                                                                  • Germany NGR +23% cc
SIX MONTHS ENDED                                       2019            2019                2018         Change                  CC2          • Australia NGR +48% cc (+28% adj Neds proforma)
30 JUNE                                                 £m               £m                 £m              %                    %           • Italy NGR +15% cc

Sports wagers                                      5,542.7           5,542.7           4,905.6                13%               14%          Contribution margin -1.1pp
Sports margin                                        10.8%             10.8%             10.4%              0.4pp             0.4pp          • In line with expectations
                                                                                                                                             • Adverse impact of Australian POCT, increase in Italian
                                                                                                                                               online taxes, increase in UK RGD and change in mix,
Sports NGR                                            462.3             462.3             393.1               18%               19%
                                                                                                                                               partly offset by reduced marketing / NGR %
Gaming NGR                                            574.6             574.6             489.7               17%               18%          • FY19 guidance of 40% remains unchanged
B2B NGR                                                  8.6                8.6             12.6           (32%)             (33%)
NGR                                                1,045.5           1,045.5              895.4               17%               18%          Operating costs 17% higher
                                                                                                                                             • Crystalbet and Neds acquisitions (+7pp)
VAT/GST                                              (28.5)            (28.5)            (22.7)            (26%)             (27%)           • Prior year phasing of staff bonus (+6pp)
Revenue                                            1,017.0           1,017.0              872.7               17%               17%          • Investment in Responsible Gambling (+2pp)
Gross profit                                          664.3             664.3             597.1               11%                            • Partly offset by the delivery of Ladbrokes Coral
                                                                                                                                               acquisition synergies
Contribution                                          413.8             413.8             364.2               14%
                                                                                                                                             • H2 guidance 1% higher as bonus phasing reverses
Contribution margin                                 39.6%              39.6%             40.7%            (1.1pp)                              and acquisitions annualise
Operating costs                                    (172.0)           (172.0)           (147.5)             (17%)
Underlying         EBITDAR3                           241.8             241.8             216.7               12%                            Underlying EBITDA 12% higher pre IFRS 16
                                                                                                                                             • Excluding regulatory adjustments3, underlying EBITDA
Rent and associated costs                              (0.5)             (6.0)             (5.8)              91%
                                                                                                                                               pre IFRS 16 +22%
Underlying          EBITDA3                           241.3             235.8             210.9               14%
Share based payments                                   (2.2)             (2.2)             (2.1)             (5%)                            Depreciation and amortisation 28% higher pre IFRS 16
Underlying depreciation and                                                                                                                  • Impact of prior year IFRS 3 fair value adjustments, as
amortisation                                         (53.9)            (48.9)            (38.2)            (41%)                               expected, and integration capex costs
Share of JV income                                       0.3                0.3            (0.3)            200%
Operating         profit3                             185.5             185.0             170.3                 9%

(1) The Group’s proforma results are unaudited and presented as if the current Group, post the acquisition of Ladbrokes Coral Group plc, had existed since 1 January 2018. The results of Crystalbet and Neds are included from
the dates of acquisition (11 April 2018 and 28 November 2018 respectively) (2) Growth on a constant currency basis is calculated by translating both current and prior year performance at the 2019 exchange rates (3) Stated pre
                                                                                                                                                                                                                                    8
separately disclosed items (3) Prior year rebased for UK RGD, Italy tax and Australia POCT
UK Retail
                                     UK Retail transitioning well to the post Triennial Review world; ahead of expectations

                                                                                Proforma1                                                    Triennial Review
                                                                                                                                             • B2 stakes cut to £2 was implemented 1 April 2019
                                                                              Pre
                                                                           IFRS16                                                            • Trending ahead of expectations with further £10m
SIX MONTHS ENDED                                            2019             2019                  2018           Change                        EBITDA upgrade
30 JUNE                                                      £m                £m                   £m                %                      • Now expected to adversely impact UK Retail EBITDA
                                                                                                                                                by £137.5m in 2019; estimated H1 impact £45m
OTC wagers                                              1,591.6             1,591.6            1,562.9                   2%
OTC margin                                                17.5%              17.5%               17.9%             (0.4pp)                   OTC wagers +2% (LFL3 +4%)
                                                                                                                                             • Recycling benefit in Q1 and part-substitution of
                                                                                                                                               displaced B2 revenue into sports-betting in Q2
OTC NGR / Revenue                                          275.0               275.0              277.1                (1%)
                                                                                                                                             • SSBT wagers LFL3 +40%; commenced roll-out of new
Machines NGR / Revenue                                     311.8               311.8              387.5              (20%)                     SSBT cabinets increasing density by 30%
Total NGR / Revenue                                        586.8               586.8              664.6              (12%)
Gross profit                                               421.9               421.9              476.9              (12%)                   OTC margin 17.5% (-0.4pp)
                                                                                                                                             • Softer margin in Greyhounds and Irish horse racing
Contribution                                               419.0               419.0              474.4              (12%)
Contribution margin                                       71.4%              71.4%               71.4%                0.0pp                  Machines NGR -20% (LFL3 -18%)
Operating costs                                          (298.1)            (298.1)             (302.0)                  1%                  • Roll-out of new Equinox cabinets in Q1 (LFL3 +4%)
Underlying EBITDAR2                                        120.9               120.9              172.4              (30%)                   • B2 stakes cut in Q2 (LFL3 -39%)

Rent and associated costs                                   (8.9)             (42.6)              (46.6)               81%                   Operating costs 1% lower
Underlying          EBITDA2                                112.0                78.3              125.8              (11%)                   • Adverse in-year phasing impact of staff bonus offset by
Share based payments                                        (0.6)               (0.6)               (0.4)            (50%)                     shop closures and Ladbrokes Coral merger synergies
Underlying depreciation and
amortisation                                               (31.8)             (15.1)              (18.5)             (72%)                   Underlying EBITDA 38% lower pre IFRS 16
Share of JV income                                                -                   -                   -                  -
Operating         profit2                                    79.6               62.6              106.9              (26%)

  Post Triennial, the UK Retail division is expected to generate free cashflow of c£100m per annum, which equates to c14% ROIC4 even before
  considering the benefits to Online
No of shops at 30 June 2019 3,274 (2018: 3,562)
TR related no. of shop closures in H1: 157
(1) The Group’s proforma results are unaudited and presented as if the current Group, post the acquisition of Ladbrokes Coral Group plc, had existed since 1 January 2018. The results of Crystalbet and Neds are included from
the dates of acquisition (11 April 2018 and 28 November 2018 respectively) (2) Stated pre separately disclosed items (3) UK Retail numbers are quoted on a LFL basis. During H1 there were an average of 3,432 shops in the        9
estate, compared to an average of 3,563 in the same period last year (4) Cash return defined as unlevered cash flow attributable to the UK Retail business as a percentage of the implied valuation at the time of the Ladbrokes
Coral Group acquisition after adjusting for the impact of the Triennial Review
European Retail
                                                                                   Strong growth in Italy and Belgium

                                                                                  Proforma1                                                  OTC wagers +11%
                                                                                                                                             • Eurobet Italy football wagers +11%
                                                                        Pre
                                                                     IFRS16                                                                  • Benefit of prior year shop acquisitions in Ladbrokes
SIX MONTHS ENDED                                       2019            2019                2018         Change                  CC2            Belgium (22 shops acquired H1 2018)
30 JUNE                                                 £m               £m                 £m              %                    %
                                                                                                                                             OTC margin 17.3% (-0.5pp)
OTC wagers                                            832.4             832.4             753.1               11%               11%          • Eurobet Italy football margin -1.7pp
OTC margin                                           17.3%             17.3%             17.8%            (0.5pp)           (0.5pp)          • Ireland horse margin -0.5pp

                                                                                                                                             Other OTC NGR +22%
Sports NGR / Revenue                                  107.1             107.1             103.4                 4%                4%
                                                                                                                                             • Growth in Virtual in both Eurobet Italy and Ladbrokes
Other OTC NGR / Revenue                                 35.9              35.9              29.5              22%               22%            Belgium driven by roll-out of new products
Machines NGR / Revenue                                   1.1                1.1               1.2            (8%)              (6%)
Total NGR / Revenue                                   144.1             144.1             134.1                 7%                8%         Contribution margin -2.3pp
                                                                                                                                             • Eurobet Italy marketing investment ahead of
Gross profit                                            72.6              72.6              69.9                4%                             advertising restrictions effective 15 July 2019, increase
Contribution                                            68.7              68.7              67.1                2%                             taxation (0.7pp) and higher mix of franchisee payments
Contribution margin                                 47.7%              47.7%             50.0%            (2.3pp)                            • Tax impact continues in H2
Operating costs                                      (33.8)            (33.8)            (34.0)                 1%
                                                                                                                                             Operating costs 1% lower
Underlying EBITDAR3                                     34.9              34.9              33.1                5%                           • Prior year shop acquisitions in Belgium offset by
Rent and associated costs                              (0.5)             (4.6)             (4.3)              88%                              continued good cost control
Underlying          EBITDA3                             34.4              30.3              28.8              19%
                                                                                                                                             Underlying EBITDA 5% higher pre IFRS 16
Share based payments                                   (0.2)             (0.2)             (0.1)         (100%)
Underlying depreciation and
amortisation                                         (13.4)            (10.2)              (8.7)           (54%)
Share of JV income                                       0.7                0.7               0.2           250%
Operating         profit3                               21.5              20.6              20.2                6%

 Outlets at 30 June 2019
 •     Eurobet Italy 852 (2018: 836)
 •     Ladbrokes Belgium 316 shops, 374 outlets (2018: 320 shops, 307 outlets)
 •     Ladbrokes ROI 139 (2018: 139)
(1) The Group’s proforma results are unaudited and presented as if the current Group, post the acquisition of Ladbrokes Coral Group plc, had existed since 1 January 2018. The results of Crystalbet and Neds are included from
the dates of acquisition (11 April 2018 and 28 November 2018 respectively) (2) Growth on a constant currency basis is calculated by translating both current and prior year performance at the 2019 exchange rates (3) Stated pre
                                                                                                                                                                                                                                    10
separately disclosed items
Financials: Statutory P&L
                                                           Reported1                                                 Proforma2                                Group proforma underlying EBITDAR -7%

                                                                                                                                                              Group proforma underlying EBITDA +5%
SIX MONTHS ENDED                                  2019              2018         Change                     2019             2018        Change
30 JUNE                                            £m                £m              %                       £m               £m             %                (pre IFRS 16 -7%)

                                                                                                                                                              Group proforma Op. profit -6%
Underlying EBITDAR                               376.8             265.8              42%                  376.8            406.4             (7%)            (pre IFRS 16 -13%)
Rent and associated                             (10.0)            (30.8)              68%                  (10.0)          (56.9)             82%             • Share based payments £5.5m
costs
                                                                                                                                                              • D&A -51% (pre IFRS 16 £74.9m, -13%)
Underlying EBITDA                                366.8             235.0              56%                  366.8            349.5               5%            • Share of US JV income -£3.0m
Share based payments                              (5.5)             (5.0)           (10%)                   (5.5)            (6.0)              8%
Underlying depreciation                                                                                                                                       Finance costs £48.2m (pre IFRS 16 £39.7m)
and amortisation                                (99.9)            (42.1)          (137%)                   (99.9)          (66.1)          (51%)              • Prior year includes only three months post
Share of JV income                               (1.1)               0.7          (257%)                    (1.1)             0.5         (320%)                 acquisition of Ladbrokes Coral
Operating profit                                260.3             188.6              38%                   260.3           277.9            (6%)
Finance costs                                   (48.2)            (26.5)           (82%)                                                                      Separately disclosed items
Profit before tax pre                                                                                                                                         • Amort. of acq. intangibles £184.3m:
separately disclosed                             212.1             162.1              31%                                                                       primarily on LC and bwin acquisitions
items                                                                                                                                                         • Movement in FV of contingent consideration
Separately disclosed                                                                                                                                            £5.6m: discount unwind of deferred
items:
                                                                                                                                                                contingent considerations
   Amortisation of                             (184.3)          (126.2)             (46%)
   acquired intangibles                                                                                                                                       • Other £34.5m (slide 12)
   Movement in fair value
   of contingent                                  (5.6)            142.3          (104%)                                                                      Tax £14.4m
   consideration                                                                                                                                              • Tax charge of £26.2m offset by £40.6m
   Other                                        (34.5)            (64.6)           (47%)                                                                        credit on separately disclosed items
(Loss)/Profit before tax                        (12.3)            113.6           (111%)                                                                      • Reflects an underlying effective tax rate of
Tax                                               14.4               0.2             n/m                                                                        12.4%
Profit after tax                                   2.1            113.8            (98%)

(1) 2019 and 2018 reported results are unaudited reflect the acquisition of the Ladbrokes Coral Group plc on 28 March 2018 (2) The Group’s proforma results are unaudited and presented as if the current Group, post the
acquisition of Ladbrokes Coral Group plc, had existed since 1 January 2018. The results of Crystalbet and Neds are included from the dates of acquisition (11 April 2018 and 28 November 2018 respectively)                 11
Financials: Other Separately Disclosed Items
                                                                                                      Reported P&L1           Cashflow    Corporate transaction costs £2.5m
                                                                                                                                          • Primarily costs associated with the US
                                                                                                                                            licencing process
SIX MONTHS ENDED                                                                                   2019                2018       2019
30 JUNE                                                                                             £m                  £m         £m
                                                                                                                                          Integration costs £20.0m
                                                                                                                                          • Costs related to the integration of GVC and
Corporate transaction costs                                                                        (2.5)             (48.4)       (2.5)      Ladbrokes Coral businesses and synergy
Integration costs                                                                                 (20.0)              (3.4)      (26.4)      delivery (includes £9.4m of integration
Triennial redundancy and associated costs                                                          (2.9)                  -       (2.5)      capex)
Other including legal and onerous contract provisions                                              (9.1)             (12.8)           -
                                                                                                                                          Triennial redundancy costs £2.9m
                                                                                                                                          • Redundancy costs associated with TR
Total                                                                                             (34.5)             (64.6)      (31.4)
                                                                                                                                             driven shop closures and other cost
                                                                                                                                             mitigations

                                                                                                                                          Other including legal and onerous
                                                                                                                                          contracts £9.1m
                                                                                                                                          • Onerous contract provisions and
                                                                                                                                            impairment arising on shop closures

(1) 2019 and 2018 reported results are unaudited reflect the acquisition of the Ladbrokes Coral Group plc on 28 March 2018
                                                                                                                                                                                      12
Financials: Cashflow
                                         Continued strong operational cashflow generation; free cashflow of £176m in H1

                                                                                                  Reported1                      Underlying working capital £15.4m outflow
                                                                                                                                 • Driven by timing of staff bonus payments
SIX MONTHS ENDED                                                                                  2019                   2018
30 JUNE                                                                                            £m                     £m     Capex / Investment in JVs £77.6m outflow
                                                                                                                                 • No contributions to US JV – in line with guidance
                                                                                                                                 • Capex in line with full year guidance (£155m)
Underlying EBITDA                                                                               366.8                   235.0
Underlying working capital                                                                      (15.4)                 (55.3)    IFRS 16 finance lease and interest paid £47.8m
Capital expenditure / Investment in JVs                                                         (77.6)                 (69.7)    outflow
Finance lease                                                                                        -                   (0.8)   • Payments under IFRS 16 including non-
                                                                                                                                    operational leases
Finance lease IFRS 16                                                                           (39.3)                       -
Interest paid                                                                                   (36.9)                   (6.9)
                                                                                                                                 Interest paid £36.9m outflow
Interest paid on IFRS 16 leases                                                                  (8.5)                       -   • Reflects cost of the capital structure post the
Corporate taxes                                                                                 (12.9)                 (10.4)       Ladbrokes Coral acquisition
Free cashflow                                                                                   176.2                    91.9
Greek tax                                                                                       (39.3)                 (46.6)    Greek tax £39.3m outflow
Playtech payment                                                                                (30.0)                       -   • Payments on account in respect of Greek Tax
                                                                                                                                   assessment
Other separately disclosed items                                                                (31.4)                 (68.3)
                                                                                                                                 • FY19 total payments on account of c£80m in line
Acquisitions (net of cash acquired)                                                                  -                (470.5)      with guidance
Net movement on debt & cost of debt issuance                                                       4.0                  704.8
Equity issue                                                                                         -                   10.8    Playtech payment £30m outflow
Dividends paid                                                                                  (97.6)                 (46.2)    • Settlement of the Playtech marketing services
Net cashflow / (outflow)                                                                        (18.1)                  175.9       agreement as guided
Foreign exchange                                                                                 (6.5)                   (1.3)
                                                                                                                                 Other separately disclosed items £31.4m
Net cash generated / (outflow)                                                                  (24.6)                  174.6    outflow
                                                                                                                                 • Refer to slide 12
  The impact of IFRS 16 is cash neutral, with reclassifications between EBITDA, lease
  repayments, interest and separately disclosed items.

(1) 2019 and 2018 reported results are unaudited reflect the acquisition of the Ladbrokes Coral Group plc on 28 March 2018
                                                                                                                                                                                     13
Financials: Net Debt
                   Debt stack is flexible. Full year guidance improved to 2.9x: expect to de-lever by at least 0.5x per annum

                                                                                                                     Debt stack
                                                                                                                     • Next material refinancing not due until 2023
                                                                                                Issue
                                                                                     Par       costs/      Total
                                                                                   Value    Premium                  •   Implementing minor restructuring to weight
 AS AT 30 JUNE 2019                                                                  £m           £m          £m         debt stack more heavily to EUR than GBP,
                                                                                                                         to reflect post TR earnings mix
 Bonds                                                                            (500.0)      (28.5)     (528.5)
 Term loans / RCF                                                               (1,725.3)        29.6   (1,695.7)    •   £100m RCF set to expire in March 2019
                                                                                                                         has been extended to March 2023 and
 Interest accrual                                                                   (7.8)           -        (7.8)
                                                                                                                         drawn in EUR in July 2019 to repay GBP
 Gross cash debt                                                                (2,233.1)         1.1   (2,232.0)        term debt
 Cash                                                                                                       397.3
 Subtotal                                                                                               (1,834.7)    •   Expect to reduce interest cost by c£5m
 Cash held on behalf of customers                                                                         (293.6)        annually, mostly benefitting 2020 onwards
 Fair value of swaps held against debt instruments                                                           35.3
                                                                                                                     •   Interest cost is c4% of gross debt
 Short term investments / deposits held                                                                      96.7
 Balance held with PSP                                                                                       67.0    •   Total accessible cash of £267.4m
 Adjusted net debt pre IFRS 16                                                                          (1,929.3)
 Proforma underlying EBITDA pre IFRS16                                                                      729.2    Pre IFRS 16
 Leverage ratio pre IFRS 16                                                                                 2.65x    • Adjusted net debt £1,929.3m
                                                                                                                     • Leverage ratio of 2.65x
 Finance lease liabilities IFRS 16                                                                        (350.3)
                                                                                                                     Post IFRS 16
 Adjusted net debt post IFRS 16                                                                         (2,279.6)    • Adjusted net debt £2,279.6m
 Proforma underlying EBITDA1 post IFRS 16                                                                   816.0    • Leverage ratio of 2.79x1
 Leverage ratio post IFRS 16 (proforma)                                                                     2.79x

(1) Proforma basis as if IFRS 16 had been in place for the last twelve months
                                                                                                                                                                     14
FY19 Guidance
                                                                    Guidance reiterated; material new items are positive

  Reiterated previous guidance from FY18 results (5 March 2019) and CMD (16 May 2019):

  New updated guidance in orange
                                                                                           2019

        Online                                                                                Cashflow
        • Online NGR double-digit growth                                                      • Capex c£155m
        • Online contribution margin c40% (after betting duty                                 • One-offs
          changes adverse impact of c2%)                                                         • Greek tax assessment c£80m (H1 actuals: £39.3m)
            • Online marketing / NGR c23%                                                        • Playtech legacy LC pymt £30m (H1 actuals: £30m)
        • Online opex growth H2 c1%; full year c8% (c5%                                          • Other SDI
          excluding acquisitions)                                                                   • Integration payments c£39m (H1 actuals: £26.4m)
                                                                                                    • Shop closure costs c£10m-£20m
                                                                                                       (H1 actuals: £2.5m)
        US
                                                                                                    • New exceptionals c£10m incl. UK GC settlement
        • NGR run-rate >$100m                                                                          (H1 actuals: £2.5m)
        • Impact on Group EBIT c£0m-£5m loss                                                      • Net M&A cash inflow c£43m (H1 actuals: £5.0m)
        • No cash payments required from GVC into JV in                                       • Interest costs c4% on gross debt; c£85m pre IFRS 16
          FY19
                                                                                              • Tax rate c13% P&L, c£60m cash

       Dividend                                                                               Leverage Ratio
       • 2019 Interim of 17.6p +10%                                                           • Pre IFRS 16 FY19 improved to c2.9x1

       EBITDA Guidance
       • Full year expectations now within a c£650m - £670m range

(1) FY19 leverage ratio post IFRS 16 c3.1x based on current TR closure profile
                                                                                                                                                        15
FY20+ Guidance
  Reiterated previous guidance from FY18 results (5 March 2019) and CMD (16 May 2019):

  New updated guidance in orange

                                                                                                        2020+

       Triennial Impact                                                                                   Synergies
       • Per CMD: additional £15m EBITDA benefit FY20                                                     Per CMD:
          onwards                                                                                         • Acceleration of £15m additional cost synergy
       • Additional £10m EBITDA benefit FY19 onwards                                                        recognised in 2020 due to earlier platform migration
       • UK Retail Triennial impact now: FY19: £137.5m,                                                   • No change to end state quantum
          FY20: £140.0m, FY21: £128.0m, FY22: £120.0m

       Contingent tax positions
       • £200m VAT refund re historic FOBT claim: UK Upper Tribunal to hear HMRC’s appeal in early 2020
       • Austria tax charges of £68m as at 30 June 2019 subject to litigation, expected resolution in 2020

       Longer-term
       • Commitment to double-digit Online NGR growth, providing platform for strong EBITDA and cash growth
       • 30% Online EBITDA margin over time
       • Cash conversion1 target of c33% (after dividends) post Ladbrokes Coral integration
       • Progressive dividend – minimum 10% growth per annum
       • FY20 onwards expected to deleverage by at least 0.5x each year

(1) Cashflow conversion is defined as net cash-flow after all outflows (including dividends) / EBITDA
                                                                                                                                                                   16
Kenneth
                                                           Alexander
                                                           Chief Executive

GVC Holdings PLC | 2019 Interim Results | 15 August 2019                     17
H1 Overview
                                                   Effective online operating model delivering sustained outperformance

                                                                                        TECH              +       PRODUCT                 +   BRANDS     +   MARKETING           +   PEOPLE
             KEY ENABLERS
                                                                                                                                          LOCAL EXECUTION

                                                                                          H1 Online NGR Growth
                                                                                                 in constant currency1

                                                                                                               28% 2
                                                                          23%

                                                                                                                                                15%                 16%
                                    13%
                                                                                                                 Australia

                                                                                                                                                                    partypoker
                                                                           Germany
                                     UK

                                                                                                                                                 Italy

(1) Growth on a constant currency basis is calculated by translating both current and prior year performance at the 2019 exchange rates
(2) Neds adjusted to a proforma basis
                                                                                                                                                                                              18
UK Online Growth
                                    Market leading growth in H1 2019

                                H1 2019 Year-on-year Online NGR growth

             Sports-led brands                                                Gaming-led brands

                                                         16%
    15%

                                                                       Not reported

                                                                                                          Not reported
             1%             1%
                                         Competitor 3                                  Competitor 5

          Competitor 1   Competitor 2                              Competitor 4                       Competitor 6

                                            -3%
                                                                                          -6%

                                                                                                                         19
Operational Update: Online Highlights
                                                                 Operational outperformance

                                                        • Market share gains: Group is now the number 2 online operator1
                        UK                              • Ladbrokes benefitting from leading real-time CRM
                                                        • Foxy Bingo continued strong growth post platform migration

                                                        • Successful ‘This is our Game’ bwin campaign
                  Germany                               • Launched full partnership with DFB (Deutscher Fussbull Bund) and national teams
                                                        • Tailored CRM campaigns helping drive revenue growth

                                                        • Best-of-both sharing between Neds and Ladbrokes
                  Australia
                                                        • Ladbrokes Australia migration onto Neds platform imminent

                                                        • Good momentum ahead of advertising restrictions
                       Italy                            • Eurobet and GVC gaming platforms are now integrated
                                                        • Eurobet, bwin and Gioco Digitale under single management

                                                        • Geographic expansion (Spain and Sweden)
                partypoker                              • Roll out of #fairplay
                                                        • Launched ‘mygame’ poker training software

(1) Gambling Compliance data and management estimates
                                                                                                                                            20
Operational Update: Product Development
                                                        Continued strong pipeline of new product

                                                                In-house Games,            Third-party Games
                      Product                                    Bingo and Poker            and Live Casino
                                                                                                                             Sports

                    Development                                               Customer interface and user experience

                                                           Product development capability

         Industry-leading expertise across all domains                                  Global, scalable products and fast roll-out

         Common product development approach                                            High local market relevance

                                            Sports                                                        Gaming

     Refreshed Coral sports app                                                  Playtech content launched on GVC labels; 89 games
                                                                                   launched in Spain, Georgia and Italy
     New bwin desktop sports platform                                            Over 100 new in-house and third-party games in the
                                                                                   pipeline for Gala
     Increased BiP markets across all brands
                                                                                  Playtech live casino roll-out
     Continued roll-out of ‘Build-your-bet’
                                                                                  Localisation of live casino offering
     On-going development of free-to-play games
                                                                                  partypoker - new responsive lobby and improved UX

(1) Gambling Compliance data and management estimates
                                                                                                                                        21
Operational Update: UK Retail
                                            UK Retail ahead of expectations

                  Triennial Review                                   Driving Online Growth and Cash Generation

• Initial trends post TR implementation continue to be           •   Market leading multi-channel offering is a material
  better than expected – further £10m EBITDA                         competitive advantage – sign-ups remain strong
  upgrade

• Highly effective transition response

• Now expect to close up to 900 shops over the next              •   Strong brand recognition
  two years
                                                                 •   Confident in taking market share
• Roll-out of new SSBT cabinets commenced
  increasing density by 30%                                      •   Cash generation c£100m per annum

                                                                                                                           22
Operational Update: US
                              On track for full US launch in September

                                                                                         Completed since CMD
        In-play sports-betting on        New sports-betting mobile
        mobile and desktop               and desktop front-end
                                                              

        Online sports-              Borgata Sports on
        betting on desktop         mobile and desktop      Full GVC      w/c
                                                                                       GVC marketing and
                                                             online sports 19 Aug
                                                             platform deployment       BI tools deployment
                   US core platform
                   upgraded to the
                                                                         MGM NV Retail
                   global version                                       sportsbooks migration
                                                 Additional              to GVC platform
                                                 payment methods     
                                                          30+ new casino
        MGM NJ Retail                              
                                    Sports affiliates     games exclusive
        sportsbook migrated         platform deployment   for the US market      MGM MS Retail
        to GVC platform
                                                                                 sportsbooks migration
                                                                                  to GVC platform

                                                                                                       Start of
 2019                                                                                                    NFL
                                                                                                       Season
                                                                                                     (September)

                                                                                                                23
Integration Update
                     UK platform migration commencing H2 unlocking further ‘best-of-both’ benefits

•   Key integration initiatives progressing well
      •    Preparation for UK Digital brands platform migrations, starting H2 2019
      •    Games content integration between GVC and Ladbrokes Coral brands
      •    Procurement savings in technology, marketing and corporate
      •    Unified marketing approach and consolidation of functions

•   On track to deliver cost synergies of c£21m in FY19 and capex synergies of £12.5m
      •   Including £8m of cost synergies in H1

•   CMD upgrades included £15m of additional cost synergies recognised in FY20 (no change to end-state quantum)

                                                                                             Capex Synergies       Integration
                                            Cost Synergies £m
                                                                                                   £m               Costs £m
                   Year
                                Cumulative Exit              Cumulative Realised             Cumulative Realised     In Year
                                  Run Rate                        In Year                         In Year

                   2018              8.0                            5.0                             0.0              (14.5)

                   2019              35.0                          c21.0                            12.5             (39.0)
                                            Includes +£20m                  Includes +£15m
                   2020              98.0    CMD upgrade           c72.0     CMD upgrade            25.0             (43.0)

                   2021             130.0                          c109.0                           30.0             (33.5)

                   2022             130.0                          130.0                            30.0              (0.0)

                                                                                                                                 24
Regulatory Update
                    Scale, geographic diversification, established brands and multi-channel offerings position
                                       the Group well in the global regulatory landscape

                                         Netherlands                        Austria
                                         • On course to                     • Tax charges subject to
                                           regulate by 2021                   litigation. Expected resolution
                                         • Group expects to                   in 2020
                                           receive a licence
     United States                                                                                              Germany
     • 18 states have now                                                                                       • Clarity awaited on Hesse sports-
       passed sports-betting                                                                                      betting licence conditions.
       regulation, of which                                                                                       Realistic possibility that clarity
       10 are live                                                                                                may not be established until 2021

                                             Italy                                                              •   The Group remains confident that
                                             • Advertising restrictions                                             it will be able to continue
                                                 came into force on 15                                              providing online sports-betting
                                                 July 2019. Conditions                                              and gaming into Germany in the
                                                 expected to be clarified                                           period through to 2021
                                                 in Q3
                                                                                                                •   The Lander have committed to re-
              Brazil                                                                                                regulate the German online
              • Sports-betting                                                                                      market in 2021 including online
                expected to regulate                                                                                gaming
                by the end of 2020

 UK
 •     £200m VAT refund re historic FOBT claim: UK Upper Tribunal to hear HMRC‘s appeal in early 2020
 •     Change in maximum B2 stakes to £2 and RGD increase both effective April 2019
 •     UK Gambling Commission launched consultation on online credit cards on 14 August 2019
 •     Voluntary ban on TV sports advertising before 9pm watershed, effective August 2019
 •     Commitment from ‘big five’ operators to a ten-fold increase in RG contributions

                                                                                                                                                   25
Safer Gambling and ESG
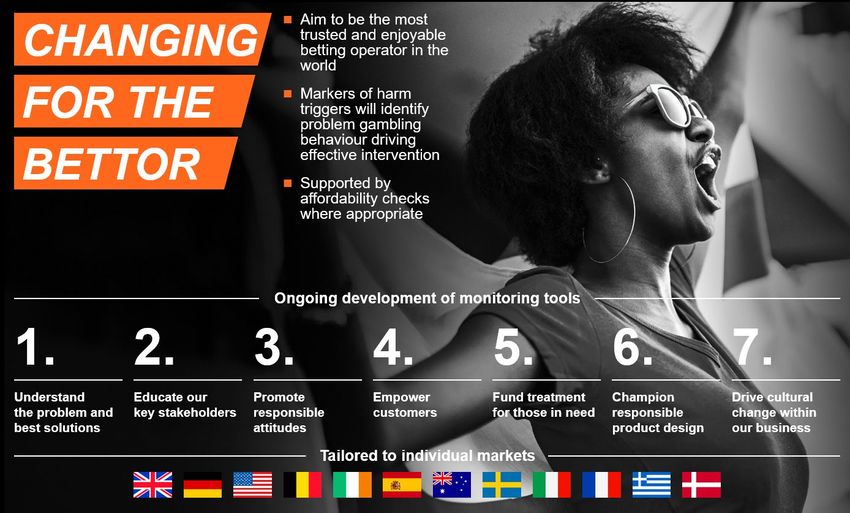
                       Our ambition is to be the world’s safest and most trusted gambling operator

Responsible Employer                                           Responsible Communities and Markets
•  Second year of three-year Diversity and Inclusion plan      •  New three-year partnership with Children with Cancer
•  Rolled out women-in-leadership programme                    •  Continued work with SportsAid
•  Partnered with Stonewall - LGBT campaign group              •  GVC Community Fund to make first round of grants
•  Launched employee ‘Well-me’ programme                          from £2m fund
•  Target set to reduce carbon footprint by 15%                •  Global GVC CSR Foundation to launch in Q3

Recognition - FTSE4Good and DJSI

                                                                                                                     26
Safer Gambling and ESG
     Decisive action being taken to improve player protection – working collaboratively with the industry and regulators

Safer Gambling
•   Implementation and expansion of ‘Changing for the Bettor’ strategy
•   Industry collaboration – ‘Big five’ operator pledge to ten-fold increase in RET funding, further advertising restrictions
    and data sharing
•   Unilateral end to UK football shirt/perimeter marketing and donation of assets to Children with Cancer
•   Roll-out of safer gambling tools and markers of harm behavioural trackers
•   Five-year multimillion-pound research project with Harvard Medical School
•   Roll-out of youth-focused education programmes with GamCare and EPIC Risk Management

                                                                                                                                27
Summary
•   Highly effective online operating model delivering sustained outperformance:
      • Proprietary technology
      • Leading product offering
      • Well-established brands
      • Cutting edge marketing
      • Local market expertise

•   US launch on track for September with full marketing deployment

•   Responsible Gambling underpinning everything we do – building on the significant
    commitments in H1

•   Interim dividend increased by 10% year-on-year

•   Positive current trading and 2019 EBITDA expectations upgraded to £650m-£670m

•   Longer-term guidance reiterated

                                                                                       28
Q&A

GVC Holdings PLC | 2019 Interim Results | 15 August 2019         29
Appendix

GVC Holdings PLC | 2019 Interim Results | 15 August 2019              30
IFRS 16 – H1 Impact
           GROUP

           SIX MONTHS ENDED                         Pre IFRS 16    IFRS 16 adj   Post IFRS 16
           30 JUNE 2019                                     £m             £m             £m
           Underlying EBITDAR                             376.8              -         376.8
           Rent and associated costs                     (53.4)          43.4          (10.0)
           Underlying EBITDA                              323.4          43.4          366.8
           Underlying depreciation & amortisation        (74.9)         (25.0)         (99.9)
           Operating profit                               241.9          18.4          260.3

           Adj. fully diluted EPS (p)                      29.9            1.4           31.3

           ONLINE
           Underlying EBITDAR                             241.8              -          241.8
           Rent and associated costs                       (6.0)           5.5          (0.5)
           Underlying EBITDA                              235.8            5.5          241.3
           Underlying depreciation & amortisation        (48.9)          (5.0)         (53.9)
           Operating profit                               185.0            0.5          185.5

           UK RETAIL
           Underlying EBITDAR                             120.9              -          120.9
           Rent and associated costs                     (42.6)           33.7          (8.9)
           Underlying EBITDA                               78.3           33.7          112.0
           Underlying depreciation & amortisation        (15.1)         (16.7)         (31.8)
           Operating profit                                62.6           17.0           79.6

           EUROPEAN RETAIL
           Underlying EBITDAR                             34.9               -          34.9
           Rent and associated costs                      (4.6)           4.1           (0.5)
           Underlying EBITDA                              30.3            4.1           34.4
           Underlying depreciation & amortisation        (10.2)          (3.2)         (13.4)
           Operating profit                               20.6            0.9           21.5

                                                                                                31
You can also read