2019 LCRA Raw Water Conservation Plan - lcra.org Approved May 2019
←
→
Page content transcription
If your browser does not render page correctly, please read the page content below

2019 LCRA Raw Water
  Conservation Plan

           lcra.org

      Approved May 2019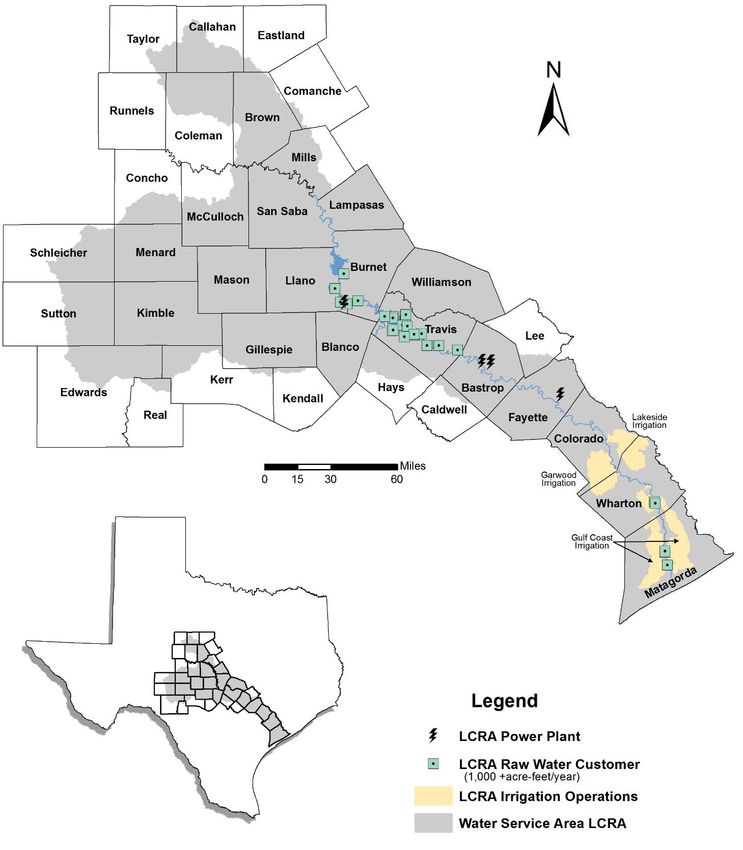
1.0 INTRODUCTION................................................................................................................ 3
  1.1 PURPOSE AND POLICY ...................................................................................................... 3
  1.2 HISTORY OF LCRA WATER CONSERVATION ....................................................................... 3
  1.3 2014 W ATER CONSERVATION PLAN RESULTS..................................................................... 4
  1.4 2019 W ATER CONSERVATION PLAN DEVELOPMENT ............................................................ 4
2.0 BASELINE PROFILE AND WATER CONSERVATION GOALS ...................................... 4
  2.1 OVERVIEW OF LCRA W ATER SERVICE AREA ...................................................................... 4
  2.2 W ATER USE ..................................................................................................................... 8
    2.2.1 Municipal Water Use ................................................................................................. 8
    2.2.2 Irrigation and Recreation Water Use ......................................................................... 8
    2.2.3 Industrial Water Use .................................................................................................. 8
    2.2.4 Domestic and Temporary Water Use ........................................................................ 9
    2.2.5 Agricultural Irrigation Water Use ............................................................................... 9
  2.3 2019 W ATER CONSERVATION GOALS ...............................................................................11
3.0 FIRM WATER CONSERVATION STRATEGIES............................................................. 12
  3.1 MONITORING AND RECORD MANAGEMENT SYSTEM ............................................................12
  3.2 MONITORING AND MEASURING W ATER USE .......................................................................12
  3.3 RESERVOIR SYSTEMS OPERATIONS PLAN..........................................................................12
  3.4 FIRM W ATER CONTRACT REQUIREMENTS ..........................................................................13
  3.5 W ATER RATES ................................................................................................................13
  3.6 CUSTOMER COST-SHARE PROGRAM .................................................................................13
  3.7 END-USER CONSERVATION INCENTIVES ............................................................................13
  3.8 LANDSCAPE IRRIGATION EVALUATIONS ..............................................................................14
  3.9 PUBLIC EDUCATION AND AWARENESS ...............................................................................14
  3.10 SCHOOL EDUCATION ......................................................................................................15
  3.11 LCRA FACILITIES ..........................................................................................................15
  3.12 MUNICIPAL CUSTOMER MANDATORY REQUIREMENTS .......................................................16
  3.13 CITY OF AUSTIN/LCRA W ATER PARTNERSHIP .................................................................16
  3.14 CONSERVATION RESEARCH AND VERIFICATION ................................................................16
4.0 AGRICULTURAL WATER CONSERVATION STRATEGIES ......................................... 17
  4.1 MONITORING AND RECORDS MANAGEMENT STRATEGY .......................................................17
  4.2 AGRICULTURAL W ATER RATES .........................................................................................18
  4.3 AUTOMATION AND MODERNIZATION OF GATES ...................................................................18
  4.4 CANAL LINING..................................................................................................................19
  4.5 PRECISION LAND LEVELING ..............................................................................................19
5.0 WHOLESALE POWER GENERATION ........................................................................... 20
  5.1 INTRODUCTION ................................................................................................................20
  5.2 BASELINE PROFILE ..........................................................................................................20
    5.2.1 Water Use ............................................................................................................... 22
    5.2.2 Natural Evaporation ................................................................................................ 23
  5.3 W ATER CONSERVATION SAVINGS AND GOALS ....................................................................23
  5.4 SYSTEM-WIDE CONSERVATION STRATEGIES ......................................................................24

                                                                                                                                      1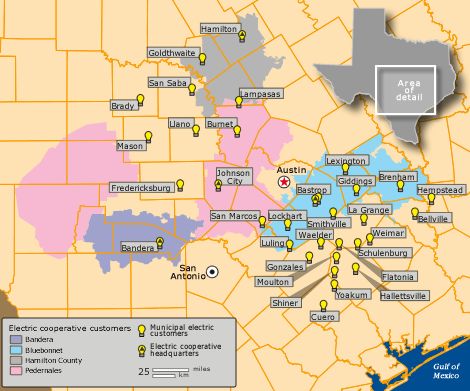
5.4.1 LCRA POWERHOUSETM Education Program ............................................................. 24
    5.4.2 Metering and Leak Detection .................................................................................. 24
  5.5 CONSERVATION PLANS FOR LCRA POWER PLANTS ...........................................................24
APPENDIX A ......................................................................................................................... 25
  MUNICIPAL FIRM W ATER CUSTOMER CONTRACTED USE – 2014-2018 ......................................25
  IRRIGATION FIRM W ATER CUSTOMER CONTRACTED USE – 2014-2018 .....................................27
  INDUSTRIAL FIRM W ATER CUSTOMER CONTRACTED USE – 2014-2018 .....................................28
APPENDIX B ......................................................................................................................... 29
LOST PINES POWER PLANT WATER CONSERVATION PLAN ........................................ 29
  1.0 LOST PINES POWER PARK DESCRIPTION ...........................................................................29
  2.0 LOST PINES POWER PARK W ATER USE .............................................................................30
  2.1 CONDENSER COOLING .....................................................................................................30
  2.2 BOILER MAKEUP W ATER ..................................................................................................31
  2.3 EMPLOYEE SANITATION ....................................................................................................31
  2.4 LANDSCAPE IRRIGATION ...................................................................................................31
  3.0 LOST PINES POWER PARK W ATER CONSERVATION GOALS AND ..........................................32
  STRATEGIES..........................................................................................................................32
APPENDIX C ......................................................................................................................... 33
FAYETTE POWER PROJECT WATER CONSERVATION PLAN ........................................ 33
  1.0 FAYETTE POWER PROJECT DESCRIPTION ..........................................................................33
  2.0 FAYETTE POWER PROJECT W ATER USE ............................................................................33
  2.1 CONDENSER COOLING .....................................................................................................34
  2.2 STACK GAS SCRUBBERS ..................................................................................................34
  2.3 INDUSTRIAL W ASTEWATER POND NATURAL EVAPORATION ..................................................34
  2.4 BOILER SOOT BLOWING AND VENTS ..................................................................................35
  2.5 FPP BOILER SEAL SYSTEMS AND BOTTOM ASH REMOVAL ..................................................35
  2.6 PLANT W ASH-DOWN SYSTEMS AND DUST SUPPRESSION ....................................................35
  2.7 POTABLE WATER PURCHASES ..........................................................................................35
  3.0 FAYETTE POWER PROJECT W ATER CONSERVATION FEATURES AND STRATEGIES .................36
APPENDIX D ......................................................................................................................... 37
FERGUSON POWER PLANT WATER CONSERVATION PLAN ......................................... 37
  1.0 FERGUSON POWER PLANT DESCRIPTION ...........................................................................37
  2.0 FERGUSON POWER PLANT W ATER USE.............................................................................37
  2.1 CONDENSER COOLING .................................................................................................... 37
  2.2 BOILER MAKEUP WATER....................................................................................................37
  2.3 EMPLOYEE SANITATION ....................................................................................................38
  2.4 LANDSCAPE IRRIGATION ...................................................................................................38
  3.0 FERGUSON POWER PLANT W ATER CONSERVATION GOALS AND STRATEGIES .......................38

                                                                                                                                      2
1.0 INTRODUCTION
1.1 Purpose and Policy
The Lower Colorado River Authority serves customers and communities throughout Texas by
managing the lower Colorado River; generating and transmitting electric power; providing a
clean, reliable water supply; and offering access to nature at more than 40 parks, recreation
areas and river access sites along the Texas Colorado River, from the Hill Country to the Gulf
Coast. LCRA was created by the Texas Legislature in 1934.
LCRA developed this Water Conservation Plan for municipal, irrigation, recreation, industrial
and agricultural water rights. This plan fulfills requirements of the Texas Administrative Code,
Title 30, Chapter 288, Subchapter A, Water Conservation Plans, and Subchapter C, Required
Submittals. This Water Conservation Plan supersedes the components of the LCRA Water
Conservation Plan approved by the LCRA Board of Directors in 2014.
1.2 History of LCRA Water Conservation
Water conservation is an important strategy for mitigating the effects of urban growth on the
region's water resources, particularly in Travis County and surrounding areas. In addition to
reducing future water demands, water conservation can make important contributions toward
satisfying the water and wastewater service requirements of growing urban populations and
economies. LCRA has been implementing water conservation measures since the late
1980s. More than 25 years ago, LCRA implemented a comprehensive water conservation
program targeted at the two largest water use sectors within the water service area – irrigated
agriculture and municipal – which together account for more than 70 percent of LCRA’s total
annual water use, even in drought years when irrigation agriculture is curtailed. Industrial use,
mainly from LCRA’s power plants, has become significantly more water efficient over time as
older facilities have been replaced by more efficient facilities.
In 1989, prior to the Texas Administrative Code, Chapter 288 rules, LCRA developed Rules
for Water Conservation and Drought Contingency and required all new firm water customers
applying for a new or modified contract to develop plans in accordance with these rules. At
that time, LCRA also began providing conservation program planning support to its wholesale
municipal water customers by offering technical assistance, coordinating plumbing retrofit
programs and developing education efforts.
As the largest historical user of water in the lower Colorado River basin, irrigated agriculture
has provided one of the best opportunities for LCRA to reduce overall water demand through
conservation programs. Between 1989 and 1997, the introduction of volumetric pricing and
canal rehabilitation is estimated to have saved approximately 13 percent a year, or about
41,500 acre-feet annually, of the projected water use that would have occurred without
conservation practices in place. House Bill (HB) 1437 was passed in 1999, allowing up to
25,000 acre-feet of water to be transferred to Williamson County subject to a requirement that
there be no net loss to the Colorado River basin. Most of the conservation strategies
3implemented in the LCRA irrigation divisions since that time have been funded or partially
funded by money collected from a surcharge on the water reserved or transferred.
1.3 2014 Water Conservation Plan Results
LCRA has an ongoing process to expand conservation strategies with its customers to collect
baseline data, conduct an extensive benchmarking effort of other successful water providers,
and work with builders, landscape and environmental interests.
Since 2012, new conservation programs include a residential outdoor rebate program; a
commercial, institutional and industrial (CII) water audit and rebate program; a firm water
customer cost-share program; irrigation evaluation training; and an irrigation technology
rebate program. All of these programs are available to water users that directly or indirectly
receive water from LCRA. Municipal customer mandatory requirements such as irrigation
standards and permanent landscape watering schedules account for nearly 70 percent of the
savings. Since 2014, LCRA estimates approximately 4,500 acre-feet of water is saved
annually from implementation of firm water conservation strategies. These savings do not
include those associated with water restrictions that were in effect during the drought in 2014-
2015.
LCRA also has implemented or completed key agricultural conservation projects. These
conservation projects, which continue to provide annual savings, include the Garwood
measurement project, the land leveling grant program, and completion of a gate rehabilitation
project in the Gulf Coast Irrigation Division (see Section 4). As of 2017, LCRA estimates the
three-year rolling average annual water savings in the irrigation divisions is 12,437 acre-feet.
This averaging is used to provide a more consistent savings number during droughts, when
curtailments can result in no savings in the Lakeside and Gulf Coast divisions. This
methodology also is consistent with reporting requirements for HB 1437.
1.4 2019 Water Conservation Plan Development
LCRA is building its 2019 Water Conservation Plan strategies largely on the 2014 plan.
The plan is divided into chapters – a baseline chapter and chapters about firm water
customers, LCRA irrigation divisions and LCRA power plants. Because the City of Austin has
its own water rights, the Austin water utility is required to submit a water conservation plan
directly to the Texas Commission on Environmental Quality (TCEQ). Water conservation
strategies for Austin are not been included in this plan.
2.0 BASELINE PROFILE AND WATER CONSERVATION GOALS
2.1 Overview of LCRA Water Service Area
LCRA provides water from its water rights in the Colorado River basin for municipal,
industrial, recreation, irrigation, agricultural, domestic, environmental and other purposes.
Surface water supplies are a combination of the natural flow of the Colorado River and stored
water from the Highland Lakes, specifically lakes Buchanan and Travis.
4As of April 2019, LCRA had firm water contracts with 68 municipal wholesale raw water
customers, serving an estimated population of more than 350,000, not including Austin,
which serves a population of more than 1 million. LCRA also has firm water contracts with 57
irrigation and recreation customers, including golf courses; seven industrial use customers
including four LCRA power plants; two agricultural customers; 3,581 domestic use
customers; and 68 temporary customers.
LCRA also provides water to farmers in the LCRA-owned Gulf Coast, Lakeside and Garwood
irrigation divisions, as well as Pierce Ranch. Figure 2-1 illustrates the LCRA water service
area as well as the locations of LCRA power plants, LCRA-owned irrigation divisions and
large municipal water customers.
Water demands and water supply available within LCRA’s water rights vary with weather
conditions. Water use by type of use has varied substantially since 2014 due to extremely dry
conditions, drought response measures and several flooding events. Table 2-1 provides a
summary of the reported water use from 2014-2018.
The annual demand for the municipal contracts, exclusive of Austin, in 2018 was
approximately 76,868 acre-feet. LCRA supplied 6,667 acre-feet of water to its firm irrigation
and recreational water customers, mainly golf courses. The majority of LCRA industrial water
use is for generating electricity. LCRA power plants used 12,647 acre-feet in 2018. The
majority of water use at these facilities is evaporation from cooling reservoirs. Other industrial
water uses customers, including manufacturing and steam electric generation, used 11,711
acre-feet in 2018.
In addition to the above-mentioned water use under firm water commitments, in 2018 the
LCRA irrigation divisions and Pierce Ranch diverted and used 239,150 acre-feet of water.
Water use in 2018 reflects partial curtailment of water in the irrigation divisions during the
second irrigation season, and stage 1 drought measures for firm water customers for
approximately two months due to reduced inflows and lower combined storage in lakes
Travis and Buchanan.
Balancing the need for well-planned infrastructure, water quality protection and water
conservation are important as LCRA works to extend the basin’s natural resources to meet
the needs of future generations. LCRA continues to work with its customers, regional
interests, environmental interests, upstream water rights holders and adjoining regional
planning groups to find sensible, equitable, beneficial and economical solutions to the water
supply challenges that will face this growing region for years to come.
5Table 2-1 LCRA Reported Total Water Use (acre-feet)1
20144 2015 2016 2017 2018
Industrial 5,186 1,735 4,866 7,910 11,711
LCRA Power Plants 9,296 7,041 8,468 15,007 12,647
Municipal, City of Austin 2 48,370 40,874 32,708 43, 678 56,648
Municipal, Other 59,626 58,046 64,426 71,738 76,868
Irrigation and Recreation 5,599 5,346 4,870 7,225 6,667
Irrigation Operations 86,726 74,723 254,084 210,535 239,150
Environmental Flow 3 4,582 0 54,641 67,762 55,924
Total 219,386 187,765 424,063 423,855 459,615
1 Reported water use numbers obtained from LCRA annual Water Use Summary.
2 The City of Austin used additional water for all years under its own water rights.
3
Stored water released for the environment.
4 Water use in 2014-2015 reflects curtailment of water in the irrigation divisions due to the drought.
6Figure 2-1: Map of LCRA Water Service Area, LCRA Irrigation Divisions, LCRA Power
Plants and Large Municipal Water Customers
72.2 Water Use
2.2.1 Municipal Water Use
In 2018, LCRA supplied water to more than 350,000 people through LCRA wholesale
municipal water customers, not including Austin. These customers derive their water supplies
from LCRA’s water rights for lakes Buchanan and Travis. LCRA municipal customers are
very diverse and include cities, water supply corporations, municipal utility districts, water
control and improvement districts, and others, the majority of whom are located in the
Highland Lakes and Travis County areas. Wholesale municipal customer metered water use
for 2014-2018 is included in Appendix A.
Outside of Austin, only a few mid-sized customers have substantial commercial and
multifamily use, with 92 percent of the connections reported in the service area in 2018
classified as single family. LCRA customer gallons per capita per day (GPCD) varies greatly,
with several smaller rural systems near or less than 100 GPCD to systems serving mostly
suburban single-family homes with large irrigated lots between 200 and 300 GPCD. This
wide range also is reflected in the ratio of summer to winter use. LCRA municipal customers
use about twice as much water in the summer than winter. The system-wide estimated
GPCD for 2018 was 158.
2.2.2 Irrigation and Recreation Water Use
In 2018, LCRA supplied 6,667 acre-feet to 57 irrigation (not including agricultural irrigation in
the irrigation divisions) and recreational water customers. Irrigation and recreational contracts
include contracts with golf courses, children’s camps, hotels, school districts and others
including for agricultural irrigation and landscape irrigation around subdivisions. The majority
of these contracts are for golf courses located in the Highland Lakes area. In 2018, golf
course water use accounted for more than 80 percent of the total water use by irrigation and
recreation customers. In 2018, municipalities in LCRA’s service area outside of Austin
provided approximately 6,037 acre-feet of treated wastewater, mainly to golf courses and
irrigation of common areas around subdivisions and roadways. Wholesale irrigation and
recreation metered water use for 2014-2018 is included in Appendix A.
2.2.3 Industrial Water Use
The majority of industrial water use in LCRA’s service area goes toward power generation
facilities, including LCRA’s three wholesale power plants (Fayette Power Project, Ferguson
Power Plant, and the Lost Pines Power Park), and Bastrop Energy Partners. STP Nuclear
Operating Company (STPNOC) has a contract with LCRA, and jointly owns a water right with
LCRA that provides run-of-river to the power plant. STPNOC has not used any backup water
supply from lakes Buchanan and Travis in the last five years. In addition, LCRA provides
water to customers with industrial facilities in the Gulf Coast Irrigation Division canal system.
Other industrial customers include facilities that produce gravel and concrete. Wholesale
industrial metered water use for 2014-2018 is included in Appendix A. Water conservation
strategies for LCRA wholesale power generation is found in Chapter 5 and Appendix C.
82.2.4 Domestic and Temporary Water Use
In addition to firm municipal, industrial, irrigation and recreational contracts, LCRA also has
several thousand domestic use contracts. Domestic use contracts are for individual or
household domestic purposes. The water is diverted solely through the efforts of the end-
user. As of April 2019, LCRA had 3,581 domestic use contracts. The contract quantity for
domestic users is calculated based on LCRA’s permanent twice weekly watering restrictions
that encourage efficient landscape watering.
LCRA also sells water to a wide ranging customer base interested in relatively small amounts
of water (less than 10 acre-feet) for a relatively short amount of time (three years or less).
These temporary customers use water for purposes such as irrigation, business interests,
construction activities, and recreational purposes. As of April 2019, LCRA had 68 temporary
use contracts.
2.2.5 Agricultural Irrigation Water Use
LCRA owns the water rights associated with the Garwood, Gulf Coast, Lakeside and Pierce
Ranch irrigation operations. Of these, LCRA operates the Garwood, Gulf Coast and Lakeside
operations. LCRA provides water to Pierce Ranch under a long-term interruptible contract,
and to numerous farmers in the Garwood, Gulf Coast and Lakeside divisions who obtain
interruptible agricultural water contracts. Combined, LCRA’s three irrigation divisions cover
an area of 830 square miles. Gulf Coast has the largest area at almost 500 square miles,
Lakeside is almost 200 square miles, and Garwood is 150 square miles. Crops include rice,
turf grass, cotton, corn, milo, soybeans and hay. Land also is often flooded for wildlife
management at the end of the irrigation season if water is available for supplemental use
contracts. In a non-curtailed year, over 90 percent of the crops planted in Lakeside and
Garwood is rice (about 80 percent in Gulf Coast). In addition to row crops, the Gulf Coast
Irrigation Division has some turf grass farms and aquaculture.
Table 2-3: LCRA Irrigation Operations Acreage and Water Use: 2014-2018
Irrigation Operations 2014 2015 2016 2017 2018
Gulf Coast
First Crop Rice Acres 0 0 13,714 8,545 11,728
Second Crop Rice Acres 0 0 10,861 5,537 7,547
Supplemental Acres 1 0 1,820 1,881 2,739 2,119
2
Total Water Diverted (a-f/yr) 0 13,004 91,754 67,006 71,519
Irrigation for Rice Crop (a-f/yr) 0 0 46,388 37,769 42,555
First Crop (a-f/acre) 0 0 2.57 3.13 2.98
Second Crop (a-f/acre) 0 0 1.03 1.99 1.00
1
Supplemental Water Use (a-f/yr) 0 1,641 2,508 2,352 1,876
Supplemental Water Use a-f/acre 0 0.9 1.33 0.86 0.89
Total Water Used (a-f/yr) 10,462 13,004 56,149 48,095 54,830
Water Loss (a-f/yr) 0 0 35,604 18,911 16,689
Percent of Water Loss -3 0.00% 38.80% 28.20% 23.34%
Lakeside
9First Crop Rice Acres 0 0 24,190 19,371 22,414
Second Crop Rice Acres 0 0 18,099 10,754 14,699
Supplemental Acres1 0 0 1,047 511 270
Total Water Diverted 0 0 88,142 67,212 72,174
Irrigation for Rice Crop (a-f/yr) 0 0 70,328 54,629 61,131
First Crop (a-f/acre) 0 0 2.00 2.11 2.18
Second Crop (a-f/acre) 0 0 1.22 1.28 0.83
Supplemental Water Use1 (a-f/yr) 0 0 2,051 639 408
Supplemental Water Use a-f/acre 0 0 1.96 1.25 1.51
Total Water Used (a-f/yr) 0 0 72,379 55,268 61,539
Water Loss (a-f/yr) 0 0 15,763 11,944 10,635
Percent of Water Loss 0.0% 0.0% 17.9% 17.8% 14.74%
Garwood
First Crop Rice Acres 18,750 18,353 19,290 16,146 19,572
Second Crop Rice Acres 16,263 14,141 14,238 12,819 14,842
Supplemental acres1 2,376 2,255 2,300 3,708 4,218
Total Water Diverted 82,114 66,548 68,325 67,488 77,444
Irrigation for Rice Crop (a-f/yr) 66,575 53,567 49,530 52,985 62,078
First Crop (a-f/acre) 2.36 1.83 1.77 2.26 2.46
Second Crop (a-f/acre) 1.38 1.41 1.09 1.28 0.94
Supplemental Water Use1 (a-f/yr) 5,141 4,934 3,635 3,419 5,681
Supplemental Water Use a-f/acre 2.16 2.19 1.58 0.92 1.35
Total Water Used (a-f/yr) 71,715 58,501 53,165 56,404 67,759
Water Loss (a-f/yr) 10,398 8,047 15,160 11,085 9,685
Percent of Water Loss 12.7% 12.1% 22.2% 16.4% 12.5%
Pierce Ranch
First Crop Rice Acres 733 584 2,482 2,895 2,468
Second Crop Rice Acres 243 88 2,068 2,706 2,468
Supplemental Acres 1,975 1,094 1,162 1,068 1,079
Total Water Diverted 4,613 6,508 13,118 16,803 18,012
First Crop Diversions (a-f/yr)4 - - - - -
Second Crop Diversions (a-f/yr)4 - - - - -
Total Water Diverted - all
Divisions (a-f/year)2 97,188 84,392 261,337 218,510 239,148
1Other water use includes water used for irrigating turf and row crops, and for wildlife management.
2
Diversions include industrial uses for customers served through the canal system (Oxea and Underground Services
Markham).
3 Not able to calculate percentage loss within the canal system when industrial is the only use.
4 LCRA does not have access to a first or second crop acreage or acre-feet dataset.
Various irrigation systems are used depending on the crop and irrigation structures in each
division. Most fields are flood irrigated through a levee system. Within the canal systems,
Lakeside Irrigation Division has approximately 2,000 structures, Gulf Coast Irrigation Division
has approximately 2,400 structures and Garwood Irrigation Division has approximately 1,150
10structures. These structures include bulkheads, water boxes, aluminum slide gates, and
control or “check” structures such as aluminum flash board risers, pipes and valves, pipe
headers, bridges, foot bridges, crossings, siphons, and under-drains.
Total agricultural water use in the downstream irrigation operations in 2018 was 239,150
acre-feet of water from the Colorado River. Water loss calculated for each of LCRA’s
irrigation divisions represents the difference between the amount of water diverted from the
river and the amount of water measured and billed to customers at the field. This figure is not
available for Pierce Ranch since it is an LCRA wholesale customer.
2.3 2019 Water Conservation Goals
In the next five to 10 years, the municipal population served by LCRA is expected to grow
significantly. With expected significant population growth, the majority of municipal water
conservation savings will come from landscape irrigation standards and permanent watering
schedules implemented by customers, and infrastructure upgrades and reuse projects
implemented through the water conservation incentives grant and rebates program.
LCRA goals for firm and interruptible water supply include:
Five-year goal:
- 700 acre-feet savings per year from firm water contracted industrial water use.
- 6,500 acre-feet savings per year from firm water contract use.
- 15,000 acre-feet savings per year from agricultural use in the irrigation divisions during
years with no curtailment of interruptible water supply.
10-year goal:
- 700 acre-feet savings per year from firm water contracted industrial water use.
- 9,000 acre-feet savings per year from firm water contract use.
- 18,000 acre-feet savings per year from agricultural use in the irrigation divisions during
years with no curtailment of interruptible water supply.
The five-year goals build on water saved from 2014-2018. The firm water savings will
increase from 4,500 acre-feet in 2018 to 6,500 acre-feet in 2023 and are projected to come
from expanding existing firm water programs and additional customer strategies. These goals
do not reflect the conservation efforts from Austin Water’s program in Austin, LCRA’s largest
municipal customer. Savings in the irrigation divisions will increase from 13,000 acre-feet in
2018 to 15,000 acre-feet in 2023, with projected savings coming from completion of the gate
rehabilitation project in the Gulf Coast Irrigation Division, the beginning phase of gate
automation in Lakeside and Garwood irrigation divisions, and continued savings from land
leveled fields.
TCEQ also requires LCRA set 10-year goals. The 10-year goals were increased at the same
yearly rate as the five-year goals.
113.0 FIRM WATER CONSERVATION STRATEGIES
3.1 Monitoring and Record Management System
LCRA maintains records of water distribution and sales using Oracle-based software
called Advanced Utility Systems for its water billing purposes. Advanced Utility Systems
provides a central location for water billing informa tion and an automated way to
compile and present that information. A detailed description of the billing system is available
upon request.
3.2 Monitoring and Measuring Water Use
LCRA Water Contract Rules impose requirements on LCRA’s raw water customers to
properly measure water diversions. Measuring devices must be accurate within plus or minus
5 percent of the indicated flow over the possible flow range. Meters are generally read on a
monthly basis. Customers are generally required to provide third-party verification of meter
testing and calibration to LCRA staff each year, while smaller customers with contract
quantities not exceeding 20 acre-feet per year provide the verification at least once every two
years.
Residential property owners pumping water from the Highland Lakes for domestic use are
required to obtain contracts from LCRA. LCRA estimates an average of about 5,000 acre-feet
per year is being pumped from the Highland Lakes by lakeside residents, mostly for
landscape watering. LCRA staff works with each customer to determine the size of the
irrigated area, which determines the contract quantity. Domestic users must comply with a
maximum twice-a-week permanent landscape watering schedule, except during extreme
drought conditions or other emergencies, when water restrictions could be implemented in
accordance with the LCRA Drought Contingency Plan.
3.3 Reservoir Systems Operations Plan
LCRA manages the Highland Lakes according to a Water Management Plan (WMP)
approved by TCEQ. The plan governs LCRA's operation of lakes Buchanan and Travis to
meet the needs of major water users throughout the lower Colorado River basin. Under the
WMP, LCRA uses unregulated inflows entering the river from drainage areas downstream of
the Highland Lakes to the maximum extent possible before waters stored in the lakes are
released to satisfy downstream water needs. The LCRA WMP is available at www.lcra.org.
LCRA has improved its ability to manage water supply operations by 1) improving
coordination with major customers to better quantify return flows and manage pumping
operations below the Highland Lakes; 2) improving river modeling to better quantify run-of-
river water in the Colorado River below the Highland Lakes; 3) improving decision support
tools to more efficiently use stored water by using run-of-river water to meet demands as
much as possible; and 4) improving control of releases from the Highland Lakes to more
precisely match releases to downstream demands.
123.4 Firm Water Contract Requirements
TCEQ rules mandate LCRA, as a water rights holder, require wholesale water customers with
new or amended contracts to develop a water conservation plan. LCRA has developed Water
Conservation Plan Rules for raw water customers. The rules extend existing surface water
supplies through water conservation and help assure there is an adequate supply of water
within LCRA’s water service area. LCRA requires all customers designate a water
conservation coordinator and provide annual plan implementation reports.
All firm raw water customers except domestic use and temporary contract customers are
required to specify five- and 10-year conservation targets for water savings and adopt
minimum conservation measures, such as leak detection and repair, conservation water
rates, and education. LCRA encourages customers with new or revised contracts to adopt
additional conservation strategies not required in the rules, such as irrigation evaluations,
deed restrictions for new development, a permanent landscape watering schedule, and
partnering with LCRA on rebate programs. The LCRA Water Contract Rules, including the
Water Conservation Plan Rules, is available at www.lcra.org/firmwateruse.
3.5 Water Rates
LCRA’s firm water rates encourage water conservation by combining reservation and
volumetric water rate structures. The 2019 water rate is $145 per acre-foot per year of firm
water used. The cost for any water used above the contracted amount increases to $290 per
acre-foot. The water rate is $72.50 per acre-foot per year for firm water reserved for future
use. Under LCRA’s Water Conservation Plan Rules, all LCRA municipal wholesale
customers must employ water rate structures that are not promotional, meaning the water
rate structure must be cost-based and not encourage the excess use of water. LCRA’s water
rate structure does not charge different firm water rates for different types of firm water use.
3.6 Customer Cost-Share Program
LCRA’s Firm Water Conservation Cost-Share Program provides funding for water efficiency
projects and programs established by LCRA's firm water customers. LCRA's firm water
customers include cities, utilities, industries, and some irrigation and recreational water users.
Cost-share funds are available to projects that result in measurable water savings. Since
2012, LCRA has awarded $878,462 for 21 projects. LCRA provides funding equal to 50
percent of the project cost or an annualized cost of $150 per acre-foot, whichever is less.
Projects funded include converting irrigated areas from raw or potable use to recycled water;
decreasing utility system water loss; and improving irrigation efficiency through irrigation
technology upgrades or installation of soil moisture sensors. Applications are accepted twice
yearly.
3.7 End-User Conservation Incentives
The Commercial, Industrial and Institutional (CII) Rebate Program helps businesses,
industries, schools, churches and other institutions that directly or indirectly receive water
from LCRA adopt new water-saving equipment and practices. The program provides rebates
13to replace inefficient plumbing, equipment or process change outs up to a fixed dollar amount
or cost per acre-foot saved, based on recommendations from water audits. A facility can
receive a rebate of up to $100 for each toilet and/or urinal replaced with water efficient
models and up to $1,500 per acre-foot saved for other water-saving equipment and/or
process changes.
In 2012, LCRA began offering landscape irrigation technology rebates that include pressure-
reducing irrigation technology, soil moisture sensors and rain sensors. In 2017, staff
expanded this program to include irrigation system evaluation, smart controllers, pool filters
and covers, aeration, compost and mulch, and rainwater harvesting. Staff implemented an
online rebate application tool at www.WaterSmart.org for property owners to submit rebate
requests.
3.8 Landscape Irrigation Evaluations
LCRA offers irrigation evaluation training to wholesale customers’ staff. As of 2017, seven
LCRA municipal customers offered irrigation evaluations to their customers. In summer 2012,
LCRA began offering evaluations to domestic users.
Since 2017, LCRA has offered reimbursements of up to $85 for irrigation system evaluations
for residential properties, and up to $5,000 for an indoor and outdoor water audit for CII
customers. LCRA will continue to partner with firm water customers on this program to
increase participation.
3.9 Public Education and Awareness
Community Outreach
LCRA staff regularly speaks to community groups such as homeowner associations, non-
profit groups such as master gardeners and business groups. LCRA staff also presents at
firm water customer meetings.
LCRA’s water conservation website, www.WaterSmart.org, has educational materials and
links to additional water conservation websites.
WaterMyYard Program
LCRA has partnered with Texas A&M AgriLife Extension on its WaterMyYard program which
was developed to provide homeowners with scientific data to determine how much water they
should use for their yards. The WaterMyYard.org website provides homeowners
recommendations on how many minutes to run their irrigation system based on their utility’s
current recommended irrigation schedule and using precipitation rates of their sprinklers, the
water holding capacity of their soil, and their location within the service area.
LCRA contributes local climate data to this website collected from eight LCRA Hydromet
weather stations. WaterMyYard participants are notified weekly how long to run their irrigation
system based on the climatic conditions such as rainfall, solar radiation, temperature and
wind speeds that occurred during the past week. LCRA will continue to promote this program
within the service area.
14Regional Partnerships
In 2010, LCRA helped develop the annual Central Texas Water Conservation Symposium, a
daylong workshop for community leaders featuring water conservation experts from around
Texas and the United States. This effort also is supported by the Texas Water Development
Board, central Texas water utilities, local environmental groups and non-profit groups. This
symposium consistently attracts about 150 attendees. This symposium is organized by the
Central Texas Water Efficiency Network (CTWEN), a coalition of municipalities, water
providers and water conservation advocates in the Central Texas region. Participants share
information and promote water efficiency education, legislation, programs, technologies, and
all other integral components of water conservation in order to have an impact regionally on
water supplies and use. CTWEN meets bi-monthly throughout the year.
The Lone Star Golf Course Superintendents Association of America completed the Water
Efficiency/Conservation BMP guide book in January 2014. LCRA is working with customers
to implement suggested practices.
3.10 School Education
LCRA Parks
LCRA Parks operates two natural science centers that provide educational and recreational
programming for youth and adults. The LCRA Parks mission is to protect natural resources;
provide access to parks, lakes and tributaries of the lower Colorado River for public
recreation; and to promote land and water stewardship through education and recreation
programs and services. Natural science programs educate pre-kindergarten through 12th
grade students and youth development groups about water quality, water conservation,
wildlife, geology, and other science and natural history curriculums. Water quality and water
conservation topics also are addressed during river rafting trips. LCRA Parks also
participates in a Program Service Agreement with the Hyatt Regency Lost Pines. A water
conservation message is delivered to almost 5,300 guests annually through the program.
Colorado River Alliance Programs
The Colorado River Alliance (CRA) provides a Colorado River water education program,
including information on water conservation, to third to fifth graders at LCRA’s Redbud
Center. The program raises student awareness of the Colorado River in Texas and increases
conservation and stewardship of the river through hands-on, field-based learning. LCRA staff
provides guidance and technical assistance to CRA staff on their programs at the Redbud
Center. More information about CRA can be found on its website www.coloradoriver.org.
3.11 LCRA Facilities
LCRA water conservation staff works closely with LCRA facilities staff to ensure the irrigation
systems on LCRA grounds, particularly at the General Office Complex (GOC) and the
Dalchau Service Center in Austin, are maintained to minimize leaks and ensure uniform
distribution. Water conservation and facilities staff members have performed irrigation system
audits of GOC grounds. Staff plan to continue annual irrigation evaluations of the irrigation
systems on LCRA grounds.
15Additionally, LCRA facilities and water conservation staff members work with CRA and local
native plant experts to maintain the native plant flora at the Redbud Center, which is part of
the water education curriculum CRA provides.
3.12 Municipal Customer Mandatory Requirements
There are several types of regulatory requirements that have been adopted proactively by
LCRA municipal customers or are required by the state for larger municipalities.
Irrigation System Standards
House Bill 1656, passed in 2007, requires all municipalities with a population of more than
20,000 to adopt landscape irrigation ordinances that follow TCEQ rules for irrigation design,
require the installer of an irrigation system to be licensed, require a permit prior to installing
an irrigation system, and include minimum standards for the design, installation and operation
of irrigation systems. This applies to several large LCRA customers, and several additional
customers have adopted these standards voluntarily. As of 2018, 11 LCRA customers had a
permitting and inspection program to implement the TCEQ landscape irrigation standards for
new irrigation systems.
Permanent Mandatory Watering Schedules
As of 2018, 10 LCRA municipal customers had adopted permanent mandatory summer
landscape watering schedules that are unrelated to drought conditions, allowing irrigation no
more than twice weekly. This measure, if enforced, not only saves a substantial amount of
water, but lowers peak use during the summer, reducing pressure on water treatment plants
and extending the period of time before a new plant is needed.
3.13 City of Austin/LCRA Water Partnership
In 2008, LCRA and the City of Austin agreed to a cooperative structure known as the Water
Partnership. The Water Partnership is in place to jointly evaluate, plan and implement
approved strategies to optimize water supplies in the basin. Water conservation collaboration
is key to this partnership. LCRA and Austin have held several joint staff meetings and have
co-hosted workshops targeting commercial, industrial and institutional users, and yearly
seminars for irrigation professionals. LCRA and Austin also have improved the efficiency with
which water is released from the Highland Lakes for downstream uses by increasing
coordination on daily diversions to Austin water treatment and power plants, return flows from
Austin wastewater treatment plants, and Austin’s operation of Longhorn Dam.
3.14 Conservation Research and Verification
LCRA partners with customers and other research organizations to promote innovative
measures and determine water savings.
LCRA compiles annual progress report surveys from its water customers to track progress on
water conservation goals, develop its own program implementation reports to TWDB and
plan future programs. LCRA will begin working with municipal customers to track GPCD
using the state’s GPCD reporting methodology.
16LCRA monitors water savings using a conservation tracking tool developed by the Alliance
for Water Efficiency. This tool was developed to be used at the retail level and is capable of
providing a detailed cost benefit analysis of individual conservation strategies based on
avoided utility costs for water and wastewater treatment, which are not applicable at the
wholesale level. In 2018, TWDB released a municipal water conservation planning tool,
based off of the AWE tool, and customized for Texas utilities. LCRA will work with its
municipal customers to promote use of this tool as they update and implement their water
conservation plans.
4.0 AGRICULTURAL WATER CONSERVATION STRATEGIES
Since 2014, major milestones have been reached in LCRA’s irrigation divisions. The 2014
goal of saving 13,000 acre-feet per year would have been met or surpassed if the supply of
water to customers in the Lakeside and Gulf Coast irrigation divisions had not been curtailed
in 2012-2015. The conservation strategies implemented in the Garwood Irrigation Division,
which was not curtailed substantially, were instrumental to retaining savings. As of 2018, the
three-year rolling average annual water savings in the irrigation divisions was 12,437 acre-
feet. In 2019, automation and rehabilitation of main gates along all main canal lines in the
Gulf Coast Irrigation Division will be complete. LCRA plans to continue gate automation in the
Lakeside and Garwood irrigation divisions with the goal of completing main gate structures
within the next 10 years, depending on funding and LCRA’s ability to secure additional
grants. Automation of the Lakeside gates is in LCRA’s 2018 five-year capital plan.
Precision leveling grants distributed between 2006 and 2013 continue to generate water
savings whenever those fields are in production. The land leveled fields are coming to the
end of their expected life cycle, and staff is looking to study fields over the next five years to
determine effectiveness and needed upkeep for each property to maintain savings.
4.1 Monitoring and Records Management Strategy
LCRA irrigation divisions are operated to maximize water efficiency under Canal Operating
Procedures guidelines. Copies of the canal operating procedures for each division are
available upon request. An irrigation coordinator manages the delivery of water to customer
fields in each canal section. Water orders are placed with the irrigation coordinator, who then
generally has up to six days to deliver water to the customer field. Canals are managed daily
and water is adjusted based on system demand.
The irrigation coordinator collects daily, on-farm water measurements in the morning and
checks the system for leaks, high canal levels and potential water waste throughout the day.
Daily measurements are recorded by the irrigation coordinator and then entered into LCRA’s
volumetric billing system software (Water Application Management System or WAMS), which
tracks volumetric water use for each field.
LCRA maintains irrigation water use and sales records through WAMS and contract
information is stored in LCRA’s contract repository. A map indicating the Texas land survey
17number and outlined fields in production is attached to each irrigation contract at the local
division office. The contract contains acreage for each land survey and is scanned and
uploaded. Field location information is maintained in a GIS platform.
In 2017, LCRA upgraded its irrigation division billing system to include a customer portal and
more flexibility to maintain contract information. Automated standard reports are generated
through this system to keep track of total water demand, and the customer portal allows each
farmer to access their field water usage at any time. The system generates an updated water
use report for each field weekly.
4.2 Agricultural Water Rates
LCRA’s current rate structure applies per acre-foot of water delivered. Agricultural irrigation
water rates vary for each irrigation division. Information about the rates for all three divisions
is available upon request. Interruptible customers are subject to surcharges for use above
certain established limits. These surcharges can increase the effective rate for the water
delivered to up to 2.5 times the normal per acre-foot charge.
Customers are regularly provided with water use information so they are aware of the
potential for high water use to result in surcharges.
Tiered rate pricing encourages conservation. In 2010, tiered rates were applied to Gulf Coast
and Lakeside irrigation divisions. In 2013, tiered rates were applied to Garwood Irrigation
Division. The pricing changes implemented since 2010 for the irrigation divisions have helped
to changed high water use practices.
Volumetric measurement also is an important strategy to support the verification of savings
for other conservation strategies such as precision land leveling. LCRA is conducting a study
to quantify savings from conservation strategies in the Garwood Irrigation Division. LCRA will
continue to monitor and measure water use to encourage efficient use of water in the
irrigation divisions.
4.3 Automation and Modernization of Gates
In 2019, LCRA will complete the Gulf Coast gate rehabilitation and control project, as planned
for the 2014 Water Conservation Plan. This division had the highest water losses compared
to the other irrigation divisions. In 2010, a $257,000 grant from the U.S. Bureau of
Reclamation helped LCRA develop the centralized control system for the automated main
canal gates in the division and launch the initial project phase, which automated 11 check
gate structures at the head of the eastern canal system. Since then, LCRA launched five
separate project phases over nine years to automate 45 main canal structures along main
lines of the eastern and western canal systems in Gulf Coast at a cost of $1.88 million. LCRA
received grants from TWDB totaling $190,000 for two of those project phases.
184.4 Canal Lining
In 2013, Texas A&M AgriLife Extension completed a canal seepage study. The study
identified 27 miles of canals in the Gulf Coast Irrigation Division with the potential for
significant seepage losses, with 10 miles having the highest priority. Curtailment of water
deliveries to the Gulf Coast Irrigation Division postponed ponding tests originally planned
within the scope of the study to quantify seepage in high priority areas. In 2017, LCRA
completed a series of ponding tests in canal sections with automated gates across the
majority of the eastern and western canal systems in Gulf Coast. LCRA plans to evaluate the
cost effectiveness of different canal lining options in select segments with higher than
average water loss in the next five years and to continue additional ponding tests to increase
the accuracy of water loss estimates in these canal segments. If successful and proven to be
cost effective, LCRA could explore implementing a larger lining project in the future, subject
to availability of funding.
4.5 Precision Land Leveling
The precision land leveling program began in 2006, funded by HB 1437, LCRA and the
Natural Resource Conservation Service’s Environmental Quality Incentives Program (EQIP).
By leveling land, the average required field flood depth is reduced, increasing the efficiency of
water used on individual fields. This program has been very successful, with more than
30,000 acres of farmland leveled through 2013. This program also has been very cost-
effective for LCRA due to the EQIP cost share of 50-70 percent and a minimum landowner
contribution of 20 percent.
NRCS defines the useful life of projects in the EQIP program. Per NRCS, the useful life of
precision land-leveling projects is 15 years. At the end of the 15 years, NRCS allows
farmers to re-sign for additional financial assistance with the condition that new work
must move at least 100 cubic yards of dirt per acre. The useful life on land LCRA awarded
cost-share grants will begin maturing in 2021, with the largest yearly acreage reaching its
maturity in 2023-2024. Staff will develop a plan, starting in 2019, to verify the quality of
existing land-leveled fields before LCRA-funded fields reach their 15-year life.
LCRA worked with the University of Texas LBJ School of Public Affairs to complete a savings
verification study of this program in 2012. This study quantified water savings from on-farm
precision land leveling in the Lakeside Irrigation Division for five years using LCRA billing
data and detailed farmer surveys. The study showed precision land leveling alone accounts
for 0.30 acre-feet of water saved per acre for the first crop when compared to unleveled
fields. The study also identified a significant difference in water use between leveled and non-
leveled fields for the second, or ratoon, crop. However, because of the small sample size for
the ratoon crop, there is uncertainty associated with the water savings estimate for the ratoon
crop. Most precision leveled fields included in the study were used for hybrid seed rice, which
does not produce a ratoon crop. The original savings estimate was 0.75 acre-foot per acre for
a two-crop season. LCRA has revised this estimate to 0.46 acre-feet per acre extrapolating
water savings for second crop from the savings for first crop based on average water use.
19Differences between the original savings estimate and the savings for precision leveling
found in the study are likely attributable to differences in levee density (the number of levees
in a field divided by the size of the field). Fields where levees were removed as part of the
precision leveling process saved more water than fields that were simply land leveled.
However, not all precision leveled fields had levees removed because this was not an EQIP
requirement.
In 2017, the model for this study was updated and used for a similar survey and analysis on
water use data in the Garwood Irrigation Division. An additional survey to incorporate more
years of data may be needed to finalize the results of the study, as funding allows.
5.0 WHOLESALE POWER GENERATION
5.1 Introduction
Most of the water use characteristics of a power plant are fixed once the facility has been
built. Modifications to make it more thermodynamically efficient can result in small reductions
in water use, similar to the way new pollution abatement practices are designed. These small
changes on a plant-by-plant basis are important to the water conservation potential for
LCRA’s electric generation system because energy conservation efforts can directly impact
water use.
This chapter will provide information on LCRA power plants Fayette Power Project (FPP);
Lost Pines Power Park, including Sim Gideon and Lost Pines 1 power plants; Winchester
Power Park; Thomas C. Ferguson Power Plant; and how a new generation mix and
conservation efforts impact water use.
Unless otherwise noted, all generating capacity and energy values in this section refer to
gross generation in units of megawatt hours (MWh) or kilowatt hours (kWh). “Gross” power
values represent the total production from a generator. “Net” power values represent the
remaining power after plant power usage has been subtracted. Gross power better reflects
the water used for power production. In addition, the capacity values in this section represent
the output levels that the generating units can dependably produce in the summer.
5.2 Baseline Profile
As of 2018, LCRA provided wholesale electric power to 33 utilities in a 53-county service
area, as seen in Figure 5-1.
LCRA operates one gas-fired steam powered generating facility, one coal-fired steam
powered generating facility, two combined cycle combustion turbine facilities, and a
combustion turbine peaking facility. FPP has three units, two of which are owned jointly with
Austin Energy. The power plants LCRA currently operates have a total dependable gross
capacity of 3,854 MW, as summarized in Table 5-1.
20You can also read