2019 Outlook for Energy - The Guinness Global Energy Team, January 2019 - Guinness Asset Management
←
→
Page content transcription
If your browser does not render page correctly, please read the page content below
2019 Outlook for Energy
                 The Guinness Global Energy Team, January 2019
2018 was a tough year as OPEC tried to keep a volatile oil market in balance and deliver an
acceptable oil price for its members in the face of strong US production growth. We would
    like to share with you our thoughts on 2018 and our outlook for 2019 and beyond.

                                                 Highlights
 2018 IN REVIEW
 2018 saw a balanced oil market on average, though it loosened at the end of the year. OPEC acted
 rationally with an output surge mid year, responding to the threat of very tight markets and
 unsustainably high prices, but their effort was mistimed and coincided with Iranian import waivers
 and strong US onshore supply. Oil prices corrected sharply lower and the year ended with OPEC
 (and some of non‐OPEC) introducing new quotas in order to re‐balance the market in 2019.

 The dominant themes for global oil markets last year were:
   i)   Strong non‐OPEC supply growth, led by US shale. Production likely grew by 2.4m b/day with
        the US onshore delivering 1.6m b/day. An average WTI oil price of $65/bl was sufficient to
        incentivise growth in the onshore oil rig count of 100 rigs (around 870 rigs as of Dec 2018)
        and a significant lift in completions activity. Production grew in Canada (+0.3m b/day) and
        the rest of the United States (+0.5m b/day), offset by declines in Norway (‐0.1m b/day) and
        Mexico (‐0.1m b/day). Other large non‐OPEC producers like Brazil and China were flat.
   ii) OPEC acted rationally to balance the market but volatility persisted. OPEC‐14 production
        was likely down by 0.1m b/day with production declines in the first half followed by a
        concerted surge of production in the second half. Venezuela, Angola and Iran saw production
        declines over the year whilst Iraq, Kuwait, UAE and Saudi gained market share. Saudi
        delivered record production of 11.1m b/day in November 2018. OPEC announced new quotas
        in December 2018 in order to maintain market balance in 2019.
   iii) Demand grew in line with initial expectations at 1.3m b/day. This comprises non‐OECD oil
        demand growth of 0.9m b/day (with China up 0.5m b/day and India up 0.2m b/day) and
        OECD oil demand growth of 0.4m b/day. Overall growth was consistent with the last five
        years. Non‐OECD demand growth was tempered due to higher oil prices and the strong US
        dollar. The ‘loss’ of oil demand created by electric vehicle substitution remains negligible.

 For natural gas, 2018 was a year of both strong US supply and demand yielding a Henry Hub gas
 price of sub $3/mcf for most of the year. International gas markets were tighter than expected
 reflecting a combination of short term issues (weather, operational issues and higher transportation
 costs) as well as a structural shift in electricity generation demand towards lower carbon fuels.

 After a strong start to the year for energy equities in 2018, extreme commodity price weakness in the
 fourth quarter led the sector (MSCI World Energy Index) to finish ‐15.8% and behind the broad market
 (MSCI World ‐8.2%). Underlying energy company profitability continued to improve; our portfolio of
 energy equities likely delivered a 7% ROCE and 6% FCF Return for 2018. The broader market remained
 sceptical of the sustainability of the sector’s free cash flow potential, keeping valuations depressed.

              Guinness Asset Management Ltd is authorised and regulated by the Financial Conduct Authority
Tel: +44 (0)20 7222 5703                 Email: info@guinnessfunds.com                         Web: guinnessfunds.com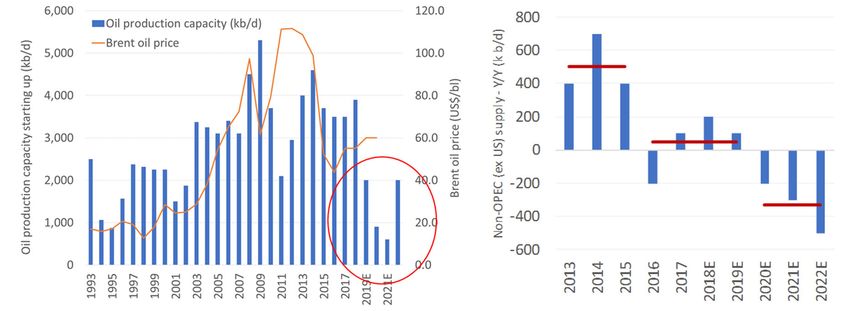
2019: Outlook for Energy
OUTLOOK FOR 2019
We expect OPEC to remain disciplined in its pursuit of normalised oil inventories, and will
seek to manage the Brent oil price at around $60/bl. OPEC are striving to find a ‘happy
medium’ for the oil market where their own economics are better satisfied, the world
economy is kept stable and US oil production grows in a controlled manner.
The US onshore shale system will grow strongly again this year, up by just over 1m b/day
if Brent averages $60/bl. E&Ps will continue to react to oil prices (despite higher levels of
capital discipline) and growth will be higher if prices are higher. Permian pipeline
constraints will be solved by year end and oil service activity is likely to pick up as the year
progresses.
Non‐OPEC (ex US onshore) supply will hold up in 2019 but will come under increasing
pressure as upstream capex cuts from 2015‐18 take effect. A dearth of new project
sanctions and increasing decline rates on existing fields means that non‐OPEC (ex US
onshore) supply will stagnate to the end of the decade, even if oil prices rise from here.
Global oil demand will depend on GDP growth, currently expected at around 1.4m b/day
if the IMF’s GDP global forecast of 3.5% holds up. The non‐OECD will deliver most of the
growth in 2019, with China and India leading the way. We will see more electric vehicles
sold this year but they will pose a negligible threat to oil demand growth.
OECD oil inventories likely to be similar to end‐2018 but the path will be bumpy. Looking
further ahead, we believe that continued oil demand growth, and a decline in non‐OPEC
supply outside the US, will raise the call on the US shale system and OPEC, we expect OPEC to
manage the market to a higher price in this environment .
Global gas demand will grow handsomely again in 2019 led by strong Asian GDP growth
and a shift in the region from coal to gas consumption by power utilities.
Energy equity valuations remain at depressed levels. On a relative price‐to‐book (P/B)
basis (versus the S&P500), the valuation of energy equities sit at a 50 year low, at 0.5x, just
below level that it was at in February 2016 when Brent oil was $29/bl. We believe that
improving ROCE (we forecast 7% for our portfolio in 2019 assuming $60 Brent prices, up
from 1% in 2016) should drive a higher P/B ratio.
Free cash flow remains a priority in 2019. Shareholder pressure for energy companies to
live within cash flow, cover dividends and buyback shares should keep free cash flow in
sharp focus. We expect improvements here even in a static oil price environment.
Looking ahead to 2020, with a $60 oil price, we expect oil & gas companies to be able to
grow shareholder distributions meaningfully for the first time in a decade. Super majors
could raise distributions by 50%, whilst mid & large cap producers could raise them by
100%.
Energy equities offer attractive upside if our oil price and profitability scenario plays out.
If you believe, as we do, in long term $60 Brent with ROCE and FCF Returns being sustained
at long run average levels, then there should be 40‐50% upside across the energy complex.
2
2019: Outlook for Energy
Review of 2018
2018 was a year of two halves for the oil market. OPEC compliance on their 2017 quota cuts reached a
level of 135% in February 2018, causing global oil inventories to draw and spot prices to rise. Persistent
production declines from Venezuela combined with the threat of stringent US‐led sanctions against Iran
then led to concerns that there would be physical oil supply shortages in the second half of the year,
bringing the spot Brent oil price as high as $86/bl. After pressure from the US, and a realisation that
prices were unsustainably high, OPEC (and Saudi in particular) delivered a surge of production in the
second half of the year that coincided with the announcement of waivers for Iranian oil exports and a
peak in US onshore shale oil supply. The ensuing oversupply pushed oil and product inventories higher,
causing a sharp correction in spot oil prices. OPEC responded by re‐introducing quotas for 2019, to
maintain reasonable prices for their members.
Spot oil prices traded in a wide range during the year. Brent oil started 2018 at $67/bl before peaking at
$86/bl in early October and then falling sharply to end the year at $54/bl, close to its lows for the year,
and down by 19% over the year. The sharp drop in spot prices at the end of the year was accelerated by
financial activity in oil. Over the fourth quarter, the net long non‐commercial crude oil futures open
position (WTI) fell from 560,000 contracts to 309,000 contracts. The average Brent spot oil price in 2018
was $71.7/bl, $17/bl higher than the 2017 average of $54.8/bl. WTI spot averaged $64.9/bl, a discount of
$7/bl to Brent, as resurgent US production brought numerous infrastructure issues and widened the
discount to Brent. Also of note was the fact that Canadian oil prices, as measured by the Western
Canadian Select crude blend, averaged only $38.6/bl during the year, dropping as low as $13.5/bl in mid‐
November, leading the Alberta government to instigate production quotas for 2019.
There was also a marked change in the shape of the oil futures curve over the year. Both Brent and WTI
moving from shallow backwardation to extreme backwardation by the middle of the year, then swinging
into contango in the fourth quarter. Importantly, longer dated crude prices were more resilient, with the
Brent five year forward price finishing the year up 4% at $60/bl.
Source: Bloomberg
The major components of oil supply/demand for 2018 were as follows:
OPEC oil supply, measured for OPEC‐14, is likely to have decreased by around 0.1m b/day, averaging
32.1m b/day, versus 32.2m b/day in 2017. The losers included Venezuela, which suffered a dramatic
production decline (falling from 1.6m b/day at the start of the year to 1.2m b/day in December 2018)
3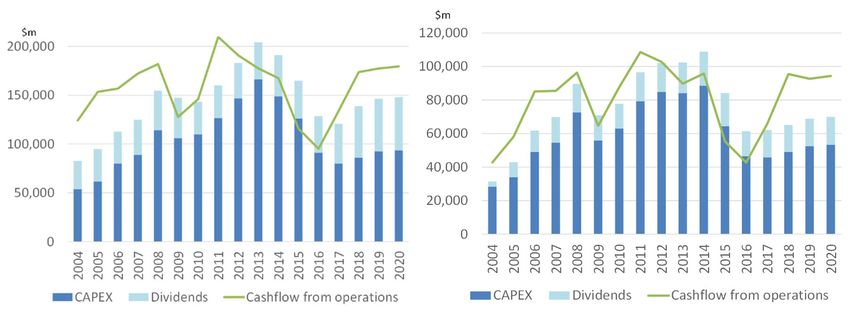
2019: Outlook for Energy
together with Angola (a decline of 0.1m b/day) and Iran (a decline of 0.8m b/day predominantly at the
end of the year caused by US‐sanctions). The winners were Saudi Arabia, Kuwait, UAE and Iraq which
together increased production by 1.7m b/day to offset declines elsewhere. After several years of
problems, Libya and Nigeria also posted gains over the year. OPEC met in December 2018 and resolved
to reduce their supply by around 0.7m b/day in 2019, effectively reversing the surge of production
brought on in the middle of 2018 to balance the impact of Iranian sanctions. During the year, Saudi
delayed its planned IPO of Saudi Aramco that Qatar announced its intention to leave OPEC.
Non‐OPEC oil supply is likely to have grown by 2.4m b/day over the year (60.4m b/day, versus
58.0m b/day in 2017) and was driven almost entirely by growth from the US onshore, Canada and
Russia. US onshore oil supply is expected to have averaged 8.7m b/day in 2018, delivering a record
1.6m b/day growth for the year, as WTI oil prices of $60/bl and above incentivised an increase of
100 oil directed drilling rigs in the first half of 2018 (around 870 rigs as of December 2018). Increases
in production were also reported in Canada (+0.3m b/day) and the remainder of the United States
(+0.5m b/day), offset by declines in Norway (‐0.1m b/day) and Mexico (‐0.1m b/day) while other
large non‐OPEC producers like Brazil and China managed to keep production flat.
Global oil demand is estimated to have grown by around 1.3 m b/day in 2018, according to the IEA.
This comprises non‐OECD oil demand growth of 0.9m b/day (with China up 0.5m b/day and India up
0.2m b/day) and OECD oil demand growth of 0.4m b/day. If confirmed, these final figures will be in
line with the forecasts for 2018 that were made at the beginning of the year. Non‐OECD demand
growth was tempered somewhat due to higher oil prices and the strong US dollar in the middle of
the year. OECD demand growth of 0.4m b/day in 2018 was at the lower end of the recent historic
range, reflecting a greater level of price elasticity.
OECD oil inventories at the end of November 2018 were estimated to be at 2,873 million barrels,
down from 2,903 million barrels a year before, but still 7% above the 2005‐2014 average level. We
expect inventories to end 2018 broadly flat with the end of 2017, having been undersupplied by
around 0.3m b/day in 2017.
For natural gas, 2018 was a year of further divergence between the US, Europe and Asia. In the US, the
gas price was anchored sub $3/mcf until prices spiked briefly to $4.8/mcf in early November as a result of
the onset of colder weather and lower levels of natural gas in storage. The stronger end to the year
brought the average gas price to $3.07/mcf (up from $3.02/mcf in 2017) but longer term gas prices (such
as the five year forward gas price) saw less price increase as a $3/mcf price was deemed sufficient to
justify new drilling to offset lower inventory levels.
Outside the US, gas prices were substantially higher, with Europe averaging around $8/mcf and Asia
averaging around $10/mcf. Thanks to strong Asian demand, a feared glut of liquified natural gas (LNG)
supply never transpired. Instead, the global gas industry embraced a next phase of LNG liquefaction
projects to satisfy the longer‐term energy decarbonisation targets of China and many developing
countries. Two new US LNG plants, with 1 Bcf/day of capacity, came into operation but 2019 is expected
to be a substantially bigger year of LNG export capacity increase. The wide North American/International
gas price arbitrage led to the sanction in October of a new LNG project in Canada.
After a strong first three‐quarters of the year for energy equities in 2018, the commodity price weakness
in the fourth quarter led the sector (MSCI World Energy Index) to finish ‐15.8%, and behind the broad
market (MSCI World ‐8.2%). It was noticeable that energy equities did not react to the increasing spot oil
price in the beginning of 2018. It was only when the long dated oil price started to move up, in the
second quarter of 2018, that the sector started to gain traction (the MSCI World Energy Index was up
10%, 8% ahead of the MSCI World index, by the end of May 2018). However, the severity of the spot
4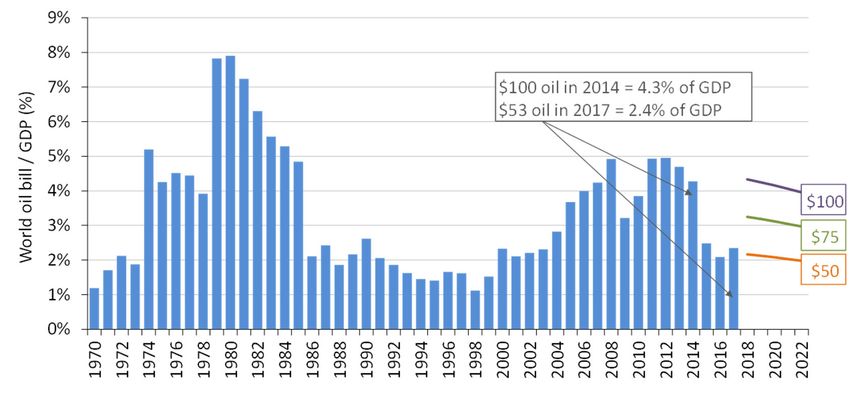
2019: Outlook for Energy
price decline at the end of the year reversed the outperformance, and more. Valuation appears subdued
relative to the improving levels of free cash flow and return on capital employed from our portfolio of
energy equities and the sharp energy equity correction in the fourth quarter only served to increase the
market’s scepticism towards the improving return on capital and free cash flow generation of the sector.
As ever, the performance of the MSCI World Energy Index was only part of the story, with 2018 being a
year of extreme divergence between the energy equity subsectors.
Global energy equity subsectors: median total return in 2018 (%)
10%
0%
‐10%
‐20%
‐30%
‐40%
‐50%
‐60%
‐70%
Source: Bloomberg; Guinness Asset Management
A quick tour of some of the main energy sub‐sectors paints a picture for the overall performance of
energy equities in 2018:
Integrated oil and gas companies again delivered above average performance. Emerging Market
integrated companies outperformed the developed market integrated companies, and all were
strong versus other subsectors. On average, the big ‘5’ supermajors delivered a total return of ‐
8% as their improving underlying financial profitability (and commitment to capital discipline,
growing dividends and share buybacks) provided relative support against an extremely weak
fourth quarter environment.
Oil refiners also delivered relatively better share price performance, reflecting the generally
strong oil product demand environment, and an eye to the expanded distillate margins resulting
from IMO 2020 regulations. European refining was the strongest of the three regions.
Renewables delivered a mixed bag of performance with those companies involved in the
generation of renewable energy delivering small positive returns while those involved in the
electrification of energy demand (including those companies involved in the electric vehicle
supply chain) delivered negative returns of ‐20% to ‐30%.
Exploration and production was a poorer performer. Typically, non‐North American E&Ps fared
a little better, being exposed to global Brent oil prices rather than WTI prices, but were still down
by around 20%. The worst returns were delivered from the North American onshore E&P sector,
with both oil and gas‐oriented E&Ps based in both Canada and the United States delivering
5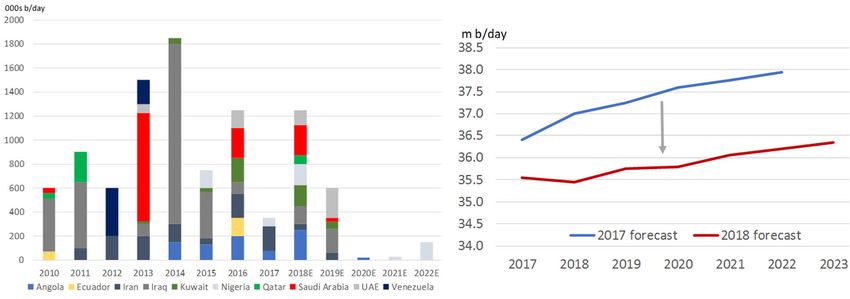
2019: Outlook for Energy
returns of ‐40% to ‐50% range over the year. The Bakken‐oriented E&Ps were the better
performers in the region but were still down 25% over the year.
Energy services were also particularly weak. North American onshore oil services providers and
pressure pumpers fell by 60% or more, as excess capacity trumped the rise in activity. Even the
large cap diversified service providers (e.g. Halliburton, Schlumberger and Baker Hughes GE)
declined by over 40%. The international service industry fared slightly better but even the best
performing sub sectors here (diversified offshore services and engineering & construction
companies) were down by 24%.
The Guinness Global Energy Fund in 2018 produced a total return of ‐19.7%. This compares to the total
return of the MSCI World Energy Index of ‐15.8%. The underperformance of the Fund versus the Index is
disappointing and can be explained in broad terms by the Index’s heavy composition bias (c.50% vs 15%
in our portfolio) towards the big five ‘super‐major’ oil and gas companies (Exxon, Chevron, Royal Dutch
Shell, TOTAL and BP). The average total return for a super‐major in 2018 was ‐8%, compared to ‐42% for
the E&P sector, ‐44% for the energy services sector and ‐19% for the refining sector. Regular observers of
the energy fund sector will recognise this explanation as have recurred often over the last five years. Put
simply, in the energy bear market that has persisted since 2014, large defensive integrated oil & gas
companies have offered a defensive haven that other sectors have not come close to matching.
Supermajors relative performance vs the median E&P, Services and Refining company
On a stock by stock basis in the fund, we saw particularly strong peer‐relative performance from
ConocoPhillips (+16%) as the market rewarded the delivery of growth together with dividend and share
buyback increases and from Equinor (previously Statoil, +2%) as capex was restrained and the economics
of new projects continued to improve. CNOOC and Gazprom performed well (+12% and +13%
respectively), Gazprom enjoying elevated European gas prices, whilst ENI and TOTAL were the best of our
developed market integrated oils.
It was a very poor year for our two diversified oil services companies (Schlumberger and Halliburton) that
were both down by 45%. Given the positive long‐term outlook for the North American onshore oil and
gas industry, we were surprised to see such severe equity weakness. Devon Energy and Newfield
Exploration (‐45% and ‐54% respectively) were noticeably weak within the poorly performing US onshore
E&P sector with their underperformance reflecting a combination of weak regional pricing, negative
regional politics or poorly performing assets.
Past performance should not be taken as an indicator of future performance. The value of an investment
and any income arising from it can fall as well as rise as a result of market and currency fluctuations as
well as other factors. Returns stated above are in US dollars; returns in other currencies may be higher or
lower as a result of currency fluctuations.
6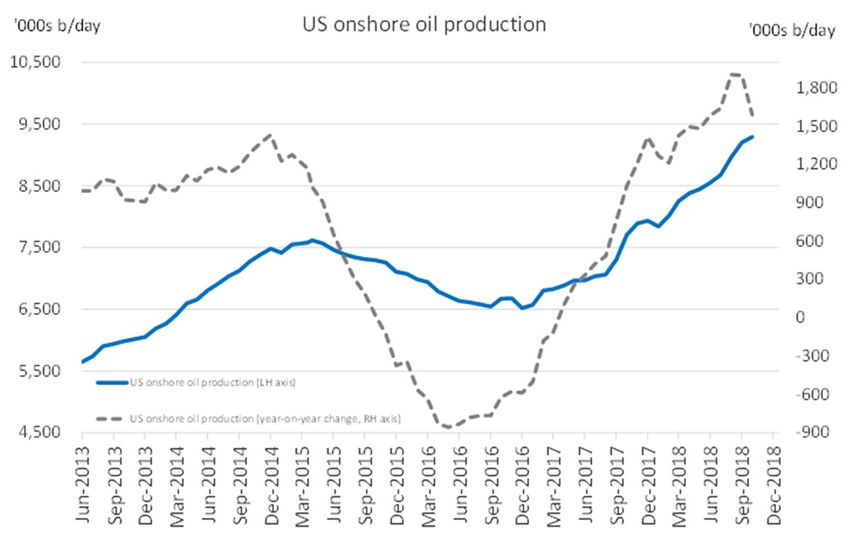
2019: Outlook for Energy

The outlook for 2019
Oil supply
The world oil supply outlook in 2019 is, in many ways, unchanged from the outlook that we have seen in
previous years as US onshore shale oil is likely to grow (though this will be sensitive to price),
complemented by small growth from the rest of the non‐OPEC world. Both will be balanced against lower
OPEC growth due to quota reductions as well as declining production from a number of maturing
countries. Whilst US onshore investment will a destination for capital, we expect the remainder of the
world to suffer from lower reinvestment, which will show through in maturing international production
profiles in coming years.

OPEC oil supply
Similar to 2017, OPEC starts the year with the market focusing on their ability to deliver on promised
production quota cuts (this time of 0.8m b/day). We see the cuts, agreed at a difficult OPEC meeting in
December 2018, as a step on the path towards achieving an oil price in 2019 which reasonably satisfies
OPEC economies as a whole but that does not cause excess US onshore supply or lower global oil
demand. It will be a difficult path to tread.
                                                                                      Oct 2018                                          Jan 2019 quota
OPEC‐14 (including Congo and excluding        (m b/day)            mn b/d mn b/d Adjustment % adjustment
Qatar) production for October 2018 was        Saudi                 10.65   10.33        ‐0.32  ‐3.0%
                                              Iran                   3.34    3.34     Exempt     0.0%
32.4m b/day; a record level for the year.
                                              Iraq                   4.65    4.51        ‐0.14  ‐3.0%
The cut announced in December of 0.8m         UAE                    3.21    3.11        ‐0.10  ‐3.0%
b/day (relative to the October production)    Kuwait                 2.76    2.68        ‐0.08  ‐3.0%
                                              Nigeria                1.67    1.62        ‐0.05    n/a
was not allocated between individual          Venezuela              1.26    1.26     Exempt     0.0%
countries. We expect Saudi, Kuwait and the Angola                    1.50    1.46        ‐0.05  ‐3.0%
                                              Libya                  1.07    1.07     Exempt      n/a
UAE to cut more (as they have in recent       Algeria                1.07    1.04        ‐0.03  ‐3.0%
cuts) because they have enjoyed higher        Equitorial Guinea      0.13    0.13         0.00  ‐3.0%
                                              Congo                  0.32    0.31       ‐0.01   ‐3.0%
market share within OPEC in recent years.     Gabon                  0.19    0.18       ‐0.01   ‐3.0%
The three countries represented 53% of        Ecuador                0.52    0.50       ‐0.02   ‐3.0%
                                              OPEC‐14               32.35   31.54       ‐0.80   ‐2.5%
OPEC‐14 production in November 2018,
having been 49% in November 2014. We expect OPEC to comply with the new quotas, and the divide in
the organisation between ‘haves’ and the ‘have nots’ to become clearer cut, with swing production being
carried out by a small number of core Middle Eastern producers.

We continue to believe that Saudi Arabia are                            Saudi Arabia
attempting to manage the oil price in a rational                        11,500
fashion: maximising revenues by supporting as high a                    11,000
price as possible that does not over‐stimulate US                       10,500
                                                         '000 bbl/day

                                                                        10,000
shale oil production. According to the IEA, Saudi
                                                                         9,500
achieved record production of 11.1m b/day in                             9,000
November 2018 and we question whether this surge                         8,500
in production (up 0.6m b/day over two months)                            8,000
                                                                         7,500
came from underlying production and how much
                                                                                 Jun‐2010

                                                                                            Jun‐2011

                                                                                                       Jun‐2012

                                                                                                                  Jun‐2013

                                                                                                                             Jun‐2014

                                                                                                                                        Jun‐2015

                                                                                                                                                   Jun‐2016

                                                                                                                                                              Jun‐2017

                                                                                                                                                                         Jun‐2018

                                                                                                                                                                                    Jun‐2019

came from de‐stocking. We are not convinced that
Saudi could keep this production level for a sustained
period, should a global oil supply shock emerge.

                                                                                                                                                                                               7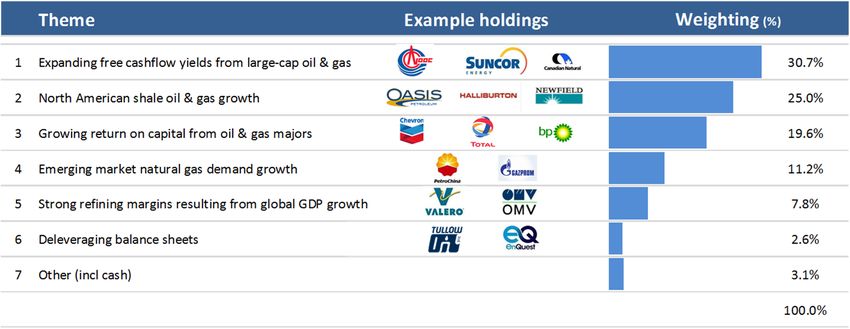
2019: Outlook for Energy
The problem countries for OPEC in 2019 will likely be mostly Venezuela and Iran, with Libya and Nigeria
still being areas of supply risk. As of November 2018, these countries together produce a total of 7m
b/day with a market share of 22% (down from 26% market share in November 2014) reflecting a
combination of political, economic, social or technical issues.
In Venezuela, a lack of investment and low oil field activity
Venezuela
is the key issue behind the rapidly falling production levels;
now at a fifty year low. The economic stress of low oil 2,400
prices, compounded by US sanctions, has led to sharply 2,200
'000 bbl/day
2,000
lower oil production and caused the economy to halve over
1,800
the last five years. There has been insufficient diluent to 1,600
allow the Orinoco belt heavy oil fields to maintain 1,400
1,200
production while low reinvestment has caused refinery
1,000
capacity to become unusable and even the main refining
Jun‐2010
Jun‐2011
Jun‐2012
Jun‐2013
Jun‐2014
Jun‐2015
Jun‐2016
Jun‐2017
Jun‐2018
Jun‐2019
complex operated at only 30% capacity during 2018. While
higher oil prices could facilitate higher reinvestment, we
note that several ‘oil for loan’ deals with Russia and China will limit the ability for Venezuela to rebalance
the economy and invest back in the oil fields as oil sales cash flows are used to service the outstanding
debts. With inflation running at 1,370,000% and GDP likely to weaken further in 2019, it is unlikely that
Venezuelan production will improve any time during 2019.
For Iran, oil production in 2019 will depend upon the extent Iran
to which the US imposes sanctions on oil exports. In 4,000
October 2018, the US granted eight waivers to allow Iranian 3,800
3,600
oil importers (notably Korea, China and India) to import
'000 bbl/day
3,400
Iranian crude oil for a further six months. If the waivers are 3,200
not extended, Iranian oil production could fall to less than 3,000
2,800
2.5m b/day in mid‐2019. The outlook is far from clear as 2,600
President Trump attempts to balance a strong line against 2,400
Jun‐2010
Jun‐2011
Jun‐2012
Jun‐2013
Jun‐2014
Jun‐2015
Jun‐2016
Jun‐2017
Jun‐2018
Jun‐2019
Iran with a domestic agenda of low gasoline prices. Iranian
production is already 0.8m b/day below the mid 2018 peak
of 3.8m b/day, and remains a wild card for the year ahead.
Oil production from Libya has continued to be volatile in 2018 Libya
1,800
and is worthy of discussion because we believe that the 1,600
country is exempt from the 2019 OPEC production quotas. A 1,400
'000 bbl/day
1,200
number of political agreements (and the promise of UN‐ 1,000
sponsored elections being held in 2019) have improved the 800
600
security environment and allowed production to recover to 400
200
1.1m b/day (close to the pre‐crisis capacity level of around 0
1.5m b/day). Given the scale of the conflict, we believe that
Jun‐2010
Jun‐2011
Jun‐2012
Jun‐2013
Jun‐2014
Jun‐2015
Jun‐2016
Jun‐2017
Jun‐2018
Jun‐2019
production infrastructure has been impaired and we do not
expect a return to pre‐crisis levels of 1.5m b/day in the near
term. As such, there is limited upside to production from here and more risk of a swing lower. We see a
similar situation for Nigeria, where production has improved steadily through 2017 and 2018 and now
sits at 1.8m b/day, a three high.
8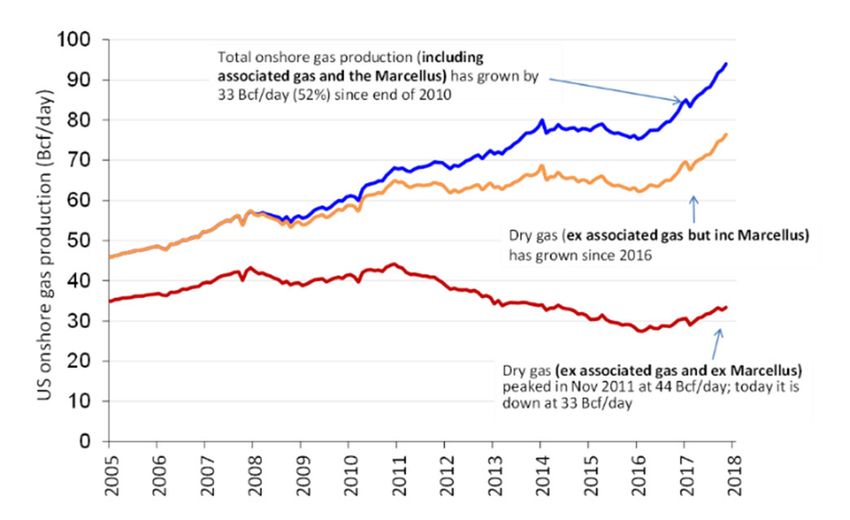
2019: Outlook for Energy
We see the potential for further declines in Angolan
production (as a result of low reinvestment in new fields),
whilst Iraqi production maintains robust levels as a result of a
high level of new redevelopments starting.
While the market will focus on compliance with 2019
production quotas, we must not forget the risk of escalated
political instability within OPEC and the increased conflict
between the ‘haves’ and the ‘have nots’ within the
organisation. 2018 witnessed further Shia‐Sunni tensions in
the region and we remind ourselves that almost all of Saudi’s oil output passes through the Shia
heartland of Saudi Arabia. Proxy Sunni‐Shia wars are either brewing or being fought in Syria, the Yemen
and the Lebanon and the risk of associated supply disruption has increased.
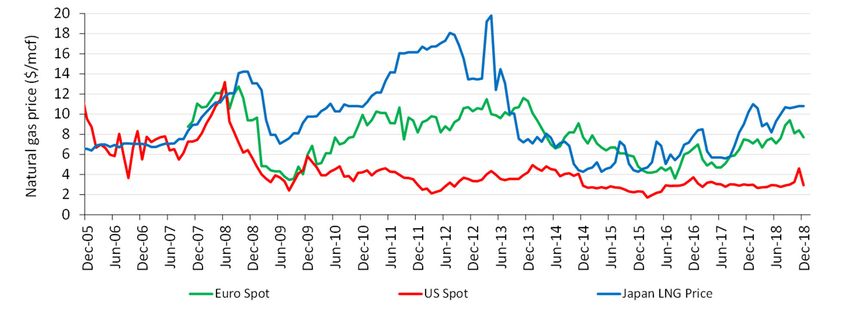
Longer term, we expect OPEC production capacity to stagnate. A hiatus in investment in 2015‐2018
means that there will be close to zero new capacity added in OPEC countries in the 2020‐2022 period; a
sharp reduction versus the 1m b/day or so of new production capacity per annum that has been added
over the last ten years. The long term investment cycle of the oil and gas industry implies that this
capacity shortfall cannot be quickly replaced. With OPEC spare capacity already likely to be less than 2m
b/day level, the longer term outlook for spare capacity remains under question and we note the IEA’s
recent reduction in its view of OPEC’s future capacity. This leads us to believe that world oil markets are
vulnerable to OPEC supply disruption in the coming years.
Major OPEC project start‐ups OPEC capacity forecast (per the IEA)
In the near term, Saudi Arabia (as de facto leader of OPEC) recognises that 10m b/day of production at a
$60‐$70/bl oil price creates more revenue than 11m b/day at $50/bl and that, therefore, Saudi should
target a price that maximises their revenue whilst supporting world oil demand growth and sustainable
supply growth from the US onshore shale industry.
9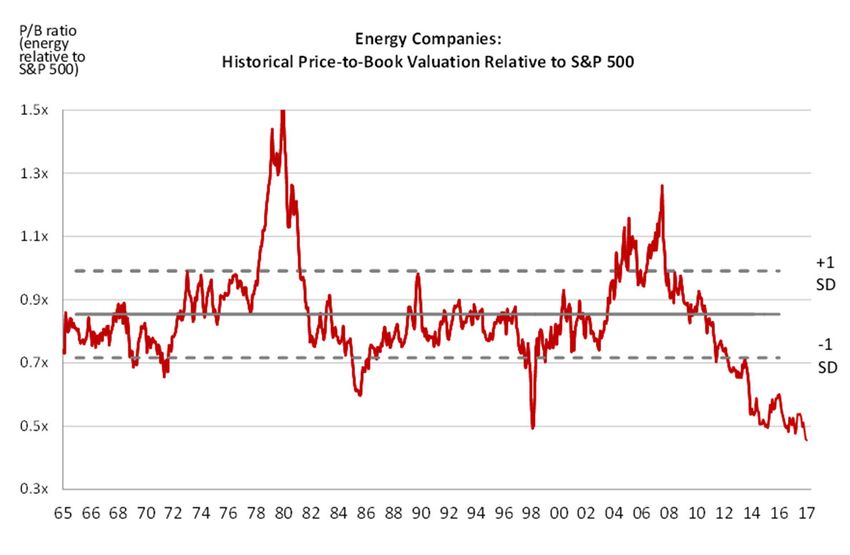
2019: Outlook for Energy

US onshore (shale) oil supply
Recent performance from the US onshore (shale) industry shows clearly that the US has the resource and
capability to grow oil production handsomely, at the right price. The short cycle nature of the industry
ensures that the US onshore will react to higher oil prices with greater investment (in drilling and
fracturing activity) and deliver price‐
responsive production growth within a
6‐12 month timeframe.

The most recent monthly data for US
onshore supply indicates record leading
edge growth of 1.6m b/day between
October 2017 and October 2018. The
US system has adapted to lower oil
prices and is well placed to continue to
deliver growth with the nexus of
activity being the Permian Basin, where
shale oil production has increased from
1.8m b/day in early 2016 to 4m b/day currently.

We maintain our view that additional US oil supply will be incentivised by higher oil prices and that, if
Brent oil prices are sustained in a $50‐60/bl range, the US onshore system will deliver supply growth of
between 0.6 and 1.2m b/day. An average Brent oil price of $72/bl in 2018 has taken annual growth in
                                                           2018 to around 1.6m b/day greater than 2017.
                                                           Structural improvements in terms of the length
                                                           of laterals being drilled, the speed of drilling and
                                                           the intensity and location of fracturing jobs all
                                                           mean that the US is delivering more production
                                                           and reserves per dollar invested than it was in
                                                           the previous peak of activity in 2013/14.

                                                           In the short term, there have been pipeline and
other infrastructure constraints in 2018 and we see further infrastructure constraints in 2019 as the
Permian grows. However, a build out of 2.8m b/day of new pipeline capacity by 3Q 2020 means that
there is sufficient room for Permian shale oil growth to continue through 2020.

Look further forward, as more shale wells are drilled the underlying annual decline of US oil production
will increase meaning that a larger number of wells will need to be drilled every year to deliver a fixed
level of production growth. On the assumption that the US onshore oil industry continues to deliver top
line growth of around 1.2m b/day, new annual production of over 2m b/d will be needed just to offset
the decline from existing shale wells in 2022. Any growth will then have to be added on top of this. This
implies that actual oil field activity will need to continue to increase further and, while US companies are
incentivised to deliver the new growth, it is likely put severe strain on the industry and its infrastructure
in order to deliver this.

In summary, we expect US shale oil to be available in the near term to dampen any shorter term oil price
spikes, but into the end of the decade, the ‘call on the US onshore’ could move substantially higher
depending on the maturation of traditional non‐OPEC and OPEC production.

                                                                                                           10
2019: Outlook for Energy
Non‐OPEC (ex US onshore) oil supply
Despite representing over half of world oil supply (estimated 51.7m b/day in 2018), non‐OPEC (ex US‐
onshore) production receives relatively little attention and is, we believe, sleepwalking towards a multi‐
year production decline as a result of low reinvestment levels.
Upstream capital expenditure growth, having been down 31% in 2016 and down 26% in 2015, has not
recovered particularly in either 2017 or 2018. While cost deflation (approx. 25%) and project
streamlining/standardisation has improved offshore project economics, we still see a muted outlook for
new oil field investment. Without higher levels of capex, we believe that oil production from this broad
area in the coming five years will face an uncertain outlook as existing production continues to decline
and new project start‐ups remains muted at best.
The simple fact is that there are better short‐term project returns available from investments in the US
onshore than there are in a typical deepwater offshore project at the current time. Even if project level
forecast investment returns are similar, we believe that the substantially longer cash flow payback profile
of the typical deepwater project (together with higher technical, political and fiscal risks) means that
operators will continue to favour the US onshore for incremental investments.
Major non‐OPEC (ex‐US) project start‐up schedule Non‐OPEC (ex‐US) supply: 2013‐2022
Source: Bloomberg; Guinness Funds Source: Bloomberg; Guinness Funds
The near‐term production profile for non‐OPEC (ex US‐onshore) has remained reasonably healthy as
those projects that were sanctioned as late as 2014 come into production and deliver growth through
2018 and 2019. Beyond 2019, we believe that the slowdown will become more obvious and that the
region will likely suffer a number of years of flat to declining production. Any shortfall will need to be
offset either via greater OPEC production, greater US onshore production or lower oil demand growth.
Whilst this may not be impacting world oil markets today, there is increasing risk of a non‐OPEC (ex US‐
onshore) supply shortage over the next few years.
112019: Outlook for Energy
Oil demand
According to the IEA, global oil demand for 2018 will end up at around 1.3m b/day, in line with forecasts
made at the start of the year. The IEA are forecasting slightly higher growth in oil demand in 2019,
around 1.4m b/day, and consistent with the average annual global oil demand growth seen since 2012.
As has been the pattern for many years, oil demand growth was biased to developing markets, with
China and India contributing a significant share:
China oil demand exceeded 13m b/day in 2018 (up from 9.9m b/day in 2012) and has grown
lockstep with overall economic growth. Despite fears over GDP slow‐down and individual areas
of weak economic data, Chinese oil demand growth remains solid. We expect oil demand to
continue to grow as China stays focused on the transition of the economy away from coal
demand (current representing 60% of overall energy demand) towards oil, natural gas and
renewables. Strength in demand from the aviation sector, personal transportation and other
personal demand is expected to drive oil demand growth up another 0.4m b/day in 2019.
Indian oil demand was particularly strong at the start of 2018 but the rate of demand growth fell
mid‐year as a result of higher oil prices and weakness in the Indian Rupee (causing higher
domestic oil product prices). Later in 2018, demand appears to have recovered and the
expectation is that 2019 oil demand growth will be around 0.3m b/day, slightly higher than that
delivered in 2018. Representing 17.7% of the world population and only 5% of world oil demand,
there is scope for a tremendous increase in oil demand should per capita consumption achieve
the same, albeit low by a global standard, levels as China.
World oil demand 2004‐19E
2004 2005 2006 2007 2008 2009 2010 2011 2012 2013 2014 2015 2016 2017 2018E 2019E
OECD demand IEA IEA
North America 25.7 25.8 24.5 25.8 24.5 23.7 24.1 24.0 23.6 24.2 24.2 24.6 24.9 25.1 25.5 25.8
Europe 15.6 15.7 15.7 15.6 15.5 14.7 14.7 14.3 13.8 13.6 13.5 13.8 14.0 14.3 14.3 14.4
Pacific 8.8 8.9 8.7 8.7 8.3 8.0 8.2 8.2 8.5 8.3 8.1 8.1 8.1 8.1 8.0 7.9
Total OECD 50.1 50.4 48.9 50.1 48.3 46.4 47.0 46.5 45.9 46.1 45.8 46.5 47.0 47.4 47.8 48.1
Change in OECD demand 0.3 ‐1.5 1.2 ‐1.8 ‐1.9 0.6 ‐0.5 ‐0.6 0.2 ‐0.3 0.7 0.5 0.4 0.4 0.3
NON‐OECD demand
FSU 3.8 3.9 4.0 4.0 4.2 4.0 4.1 4.4 4.6 4.5 4.6 4.6 4.5 4.5 4.7 4.8
Europe 0.7 0.7 0.7 0.7 0.7 0.7 0.7 0.7 0.7 0.7 0.7 0.7 0.7 0.7 0.8 0.8
China 6.4 6.7 7.2 7.6 7.7 7.9 8.9 9.3 9.9 10.4 10.8 11.6 12.0 12.6 13.1 13.5
India 2.6 2.6 2.7 2.9 3.1 3.2 3.3 3.5 3.7 3.7 3.8 4.2 4.4 4.6 4.8 5.1
Other Asia 6.4 6.4 6.6 6.9 6.8 7.1 7.5 7.6 7.6 7.9 8.0 8.2 8.6 8.8 8.7 9.0
Latin America 4.9 5.0 5.2 5.3 5.6 5.7 6.1 6.2 6.5 6.6 6.8 6.7 6.4 6.5 6.4 6.3
Middle East 5.5 5.9 6.1 6.4 6.7 7.1 7.3 7.5 7.9 8.0 8.4 8.4 8.5 8.5 8.4 8.5
Africa 2.8 2.9 2.9 3.3 3.3 3.4 3.5 3.5 3.8 3.8 3.9 4.3 4.3 4.3 4.3 4.4
Total Non‐OECD 33.1 34.1 35.4 37.1 38.1 39.1 41.4 42.7 44.8 45.6 47.4 48.6 49.4 50.5 51.4 52.5
Change in non‐OECD demand 1.0 1.3 1.7 1.0 1.0 2.3 1.3 2.1 0.8 1.8 1.2 0.8 1.1 0.9 1.1
Total Demand 82.5 83.8 85.1 87.2 86.4 85.5 88.4 89.2 90.7 91.7 93.1 95.1 96.4 97.9 99.2 100.6
Change in demand 1.3 1.3 2.1 ‐0.8 ‐0.9 2.9 0.8 1.5 1.0 1.4 2.0 1.3 1.5 1.3 1.4
Source: IEA; Guinness Funds
OECD demand growth of 0.4m b/day in 2018 was at the lower end of the recent historic range, reflecting
a greater sensitivity to higher oil prices than the non‐OECD. Despite grumbling from President Trump
about fuel prices being too high, we note that US gasoline prices are comfortably within the historic
range, cheap in a global context and cheap relative to US consumer personal disposable income.
122019: Outlook for Energy
US retail gasoline prices (US$/gallon)
Globally, we believe that oil remains a ‘good value’
commodity. Based on an oil price (weighted blend
of Brent and WTI) of around $68/bl in 2018, we
calculate that the world spent just under 3% of GDP
on oil, broadly in line with the 30 year average. If
Brent averages $60/bl this year, we expect the GDP
intensity to fall to a very comfortable level of
around 2.5%. We believe that oil would need to
increase to around $100/bl, reflecting 4% of world
GDP in 2020, if it were to have a noticeable
negative impact on the global economy. Whilst high oil prices are often a contributory factor to economic
slowdowns and recessions, our analysis suggests that a price of around $60/bl would not be particularly
stressful for the global economy.
The world oil ‘bill’ as a percentage of GDP
The IEA’s forecast for global oil demand growth in 2019 of 1.4m b/day is founded on the IMF’s global GDP
growth forecast of 3.5%, down from 3.7% in 2018. As we write, there are increasing questions over
whether a greater slowdown in the world economy is coming. The analysis we perform on the sensitivity
of oil demand to GDP and price (adjusting for the relationship in the OECD being different to that in the
non‐OECD) tells us that if global GDP slowed to around 3%, this would reduce oil demand growth to
around 1m b/day. A deeper GDP slowdown to 2% (consistent say with the 1992/93 recession) would
likely reduce oil demand growth to around 0.5m b/day. In these scenarios, OECD oil demand would fall
into negative territory, but non‐OECD demand would likely stay positive. Indeed, it remains a remarkable
thought that non‐OECD demand grew by 1m b/day in each of the worst years of the 2008/09 financial
crisis.
Looking longer term, the key issue for global oil demand is the electrification of personal transportation.
In 2018, we saw more automobile manufacturers announce increasing ranges of Electric Vehicles (EVs),
governments and capital cities introduce long dated targets for banning the sales of non‐EVs and we also
saw the start of commercial production of Tesla’s Model 3 electric vehicle. Overall, we have not changed
our outlook for the EV substitution threat and believe that oil product demand (gasoline and diesel) for
personal transportation will peak in the late 2020s, shortly after improvements in battery technology
allow EVs to be price competitive with internal combustion engine vehicles. We expect the other areas of
132019: Outlook for Energy
global oil demand, such as petrochemicals and aviation, to continue to grow with global GDP, and the net
of this activity suggests a peak in global oil demand in the mid 2030s, somewhere between 110m and
120m b/day.
Oil inventories and conclusions
As ever, the picture of oil supply and demand in 2019 will be dynamic, depending on price, OPEC delivery,
corporate behaviour and macro‐economic factors. Our base case for 2019, making assumptions for the key
sensitivities discussed in this report, is that the world oil market will remain roughly in balance. This is based
on the assumption that OPEC production will be down slightly on average and that global oil demand
growth will be offset by a rise in US onshore production and other non‐OPEC countries.
OECD oil and oil product inventories
Reconciling our base case view on supply and demand with the current state of OECD inventories, we
expect inventories to stay around flat. The state of inventories in the middle of the year, together with oil
prices will be key factors for Saudi and other participating producers in deciding whether to continue with
the adopted quota cuts or start to taper them. We expect that the level of US shale activity will be critical in
their decision making at that time.
OPEC are striving to find a ‘happy medium’ for the oil market where their own economics are better
satisfied, the world economy is kept stable and US oil production grows in a controlled manner. Absent a
supply shock, we believe that the Brent oil price that achieves this in 2019 is around $60/bl. Looking further
ahead, we believe that continued oil demand growth, and a decline in non‐OPEC supply outside the US, will
raise the call on the US shale system and OPEC, and allow OPEC to manage the market to a higher price.
Natural gas markets
US natural gas
The US natural gas market was undersupplied in 2018 with natural gas inventories ending the ’injection’
season on 1 November 2018 around 600 Bcf below the five year average level; the lowest level heading
into winter since 2005. The Henry Hub gas price was anchored sub $3/mcf for most of the year, until
prices spiked to $4.8/mcf in early November as a result of the onset of colder weather together with the
low storage levels. The key features were:
Strong growth in associated (by‐product) gas supply from shale oil production;
A return to strong growth in low‐cost Marcellus and neighbouring Utica fields in the north‐east of
the country as pipeline infrastructure came into operation;
142019: Outlook for Energy
Very strong demand growth; including LNG exports. The biggest contributors being power
generation (hot summer and start‐up of numerous gas plants increasing gas’ share over coal),
industrial demand (US GDP growth and petrochemical plant start‐ups), and LNG exports (opening of
new export terminals).
US natural gas production
The outlook for natural gas in the US in 2019 is
likely to be defined by various factors:
A significant rise in onshore production, as
another year of strong shale oil
production growth brings with it around 3
Bcf/day of associated gas production. In
addition, continued growth of supply from
the Marcellus/Utica fields (as
infrastructure bottlenecks are further
overcome) assuming that local price
differentials stay close enough to
‘national’ Henry Hub pricing;
Further sustained strong demand growth of around 4 Bcf/day, assuming prices remain around
$3/mcf. Normalised weather would keep a cap on power generation demand, but there should be a
surge in LNG exports (c.3 Bcf/day, see below), as a wave of new export terminals come into service.
US natural gas demand model (2007 – 2019)
Bcf/day 2007 2008 2009 2010 2011 2012 2013 2014 2015 2016 2017 2018E 2019E
US natural gas demand:
Residential/commercial 21.2 22.0 21.6 21.6 21.6 19.2 22.4 23.4 21.4 20.5 20.9 22.1 21.5
Power generation 18.7 18.2 18.8 20.2 20.8 24.9 22.3 22.3 26.5 27.3 25.3 28.5 28.5
Industrial 18.2 18.2 16.9 18.5 19.0 19.7 20.3 20.9 20.6 21.1 21.6 22.8 23.2
Pipeline exports (Canada & Mexico) 2.1 2.5 2.8 2.9 4.1 4.4 4.4 4.1 4.9 6.3 6.2 7.0 7.8
LNG exports ‐ ‐ ‐ ‐ ‐ ‐ ‐ ‐ 0.1 1.0 2.6 3.4 6.7
Pipeline/plant/other 5.2 5.3 5.5 5.6 5.8 6.1 6.7 6.3 6.5 6.4 6.5 6.8 6.8
Total demand 65.4 66.2 65.6 68.8 71.3 74.3 76.1 77.0 80.0 82.6 83.1 90.6 94.5
Demand growth 4.0 0.8 ‐ 0.6 3.2 2.5 3.0 1.8 0.9 3.0 2.6 0.5 7.5 3.9
Bcf/day 2007 2008 2009 2010 2011 2012 2013 2014 2015 2016 2017 2018E 2019E
US natural gas supply:
US onshore 45.1 48.8 49.8 52.2 57.7 61.5 62.7 67.5 70.6 70.0 71.1 79.2 84.8
US offshore (Gulf of Mexico) 7.7 6.3 6.7 6.2 5.0 4.2 3.6 3.4 3.6 3.4 2.5 2.1 2.0
Pipeline imports (Canada) 10.4 9.8 9.0 9.0 8.5 8.0 7.5 7.1 7.1 8.0 8.0 8.0 8.0
LNG imports & other 2.3 1.2 1.4 1.4 1.0 0.8 0.6 0.5 0.5 0.4 0.3 0.3 0.3
Total supply 65.5 66.1 66.9 68.8 72.2 74.5 74.4 78.5 81.8 81.8 81.9 89.6 95.1
Supply growth 3.2 0.6 0.8 1.9 3.4 2.3 ‐ 0.1 4.1 3.3 ‐ 0.1 7.7 5.5
(Supply)/demand balance ‐ 0.1 0.1 ‐ 1.3 ‐ ‐ 0.9 ‐ 0.2 1.7 ‐ 1.5 ‐ 1.8 0.8 1.2 1.0 ‐ 0.6
The US natural gas price since 2010 has fluctuated in a band between around $2 and $4/mcf. The
extremes of this range have tended to coincide with warm and cold winters, and any sustained recovery
over $3/mcf has generally been muted by strength in gas supply, particularly from the Marcellus/Utica
152019: Outlook for Energy
and from gas produced as a by‐product of shale oil. We still expect prices to be held, for now, in the
$2.75‐3.25/mcf range, but will keep an eye on the effect of these new LNG export terminals.
International natural gas
Outside the US, gas prices were substantially higher in 2018, with Europe averaging around $8/mcf and
Asia averaging around $10/mcf.
Key factors behind stronger global gas prices were: very China natural gas demand (Bcf/day)
hot summer weather conditions, production
problems at a number of LNG export terminals, an
increase in the price of high calorific value thermal
coal and also higher LNG transportation costs. In
addition, a strong push from China to decarbonise its
economy (and therefore increase the share of
natural gas in the power generation mix at the
expense of coal) brought greater demand with
limited price elasticity.
During the year, the global gas industry moved
towards the start of the next phase of LNG
infrastructure investment with US plants receiving expansion permits and Canada sanctioning a new LNG
export terminal on 1st October. We expect a continuation of this investment phase over the next few
years.
International natural gas prices 2005‐18
Source: Bloomberg; Guinness Funds
162019: Outlook for Energy
Energy equities
After a strong first three‐quarters of the year for energy equities in 2018, the commodity price weakness
in the fourth quarter led the sector (MSCI World Energy Index) to finish ‐15.8%, and behind the broad
market (MSCI World ‐8.2%). It was noticeable that energy equities did not react to the increasing spot oil
price in the beginning of 2018. It was only when the long dated oil price started to move up, in the
second quarter of 2018, that the sector started to gain traction (the MSCI World Energy Index was up
10%, 8% ahead of the MSCI World index, by the end of May 2018). However, the severity of the spot
price decline at the end of the year reversed the outperformance, and more. Valuation appears subdued
relative to the improving levels of free cash flow and return on capital employed from our portfolio of
energy equities and the sharp energy equity correction in the fourth quarter only served to increase the
market’s scepticism towards the improving return on capital and free cash flow generation of the sector.
On a relative price‐to‐book (P/B) basis P/B of energy sector relative to S&P 500
(versus the S&P500), the valuation
of energy equities has fallen back
to a 50 year low, at 0.46x, just
below the level that they were at
in February 2016 when Brent oil
was $29/bl.
We see the low P/B ratio for the
energy sector as driven by
historically poor levels of return on
capital employed (historically the
two measures are closely
correlated). However, we saw clear
signs of improvement in return
metrics in 2018, particularly in improving free cash flow returns, which tend to lead ROCE at the start of
an upcycle. Here, we explore the current energy equity valuations in more detail, assess what the re‐
rating potential of the sector could plausibly be, and explain how these views shape our current portfolio.
Improving capital discipline
For the super majors and other large cap oil & gas companies, capital indiscipline reached an extreme in
2013 and 2014, such that they were unable to cover dividends from free cash flow, even though oil prices
averaged around $100/bl. By 2016, in response to lower oil prices and falling revenues, cost cutting was
underway, but the concept of energy companies covering their dividends at $55/bl Brent remained a
significant stretch. In 2017, however, covering the dividend at $55/bl oil became a reality, with most
companies removing their scrip dividends (or their discounts to their scrip dividends) and some
introducing share buyback programmes. This has been broadcast most widely for the super majors but is
arguably not reflected in their dividend yields yet. And looking towards the end of the decade, in a $60/bl
Brent oil price environment, we see room for distributions to shareholders from the super majors to rise
by around 50%. This is quite a thought and, we believe, far from the market view. In practice, we expect
ordinary dividends not to increase (because the market would not tolerate them being cut again), but the
returns to shareholders to come in the form of enhanced share buybacks and a reduction of debt.
172019: Outlook for Energy
Super majors – free cash flow generation Other large caps – free cash flow generation
Source: Bloomberg; Guinness Funds
The inflection in free cash flow for the super majors is impressive, but we see an even greater
improvement occurring for the next tier of companies: mid‐cap integrateds; large cap E&Ps and Canadian
oil sands majors. These companies too have restructured dramatically and have covered dividends and
capital expenditure commitments in 2017 at a $55/bl oil price. However, projecting forward with a $60/bl
oil price in 2019 and 2020, we see room for a 100% increase in shareholder distributions. There are now a
number of large cap companies within the energy sector that offer the potential for dividend growth at
$60/bl Brent, and this is an important focus in the Guinness portfolio.
Valuation of the Guinness Energy portfolio
Updating our company models to incorporate oil and gas prices seen so far this year, plus reported
results and any changes in company outlooks, we make the following observations for the Guinness
Global Energy portfolio:
Our preferred method for monitoring longer term profitability, return on capital employed
(ROCE), continues to recover from a low of 2% in 2016 to around 7% in 2018 (based on an
average Brent oil price of $68/bl). The long run average for our portfolio is around 11% and we
see good reason to believe that profitability will return to around the long run average level, just
as it did after 1998 when oil prices last hit a cyclical low. It takes time for ROCE to improve
(depreciation per barrel is a slow moving metric) but we have increasing confidence that this will
happen. The journey continues, and we see 7% ROCE in 2019 based on a $60/bl price.
The more ‘immediate’ metric of free cashflow return (FCF return) continues to stage a very
strong recovery. We forecast our portfolio to generate a FCF return in 2018 of 6.3%, and similar
levels thereafter based on a $60/bl Brent oil price, comfortably above the long term average.
182019: Outlook for Energy
ROCE is recovering but still below average FCF return has recovered sharply
Source: Bloomberg, Guinness Asset Management estimates Source: Bloomberg, Guinness Asset Management estimates
The stock market has historically valued energy companies based on their sustainable levels of
profitability (generally a combination of both ROCE and FCF Return) whether it is delivered by self‐help
improvements or via increases in the long term oil price.
Current valuation implies that the ROCE of our companies will stay at about 5%. If ROCE
improves to 11‐12% and the market were to pay for it sustainably, it would imply an increase in
the equity valuation of around 65%.
Current valuation implies that the FCF return of the portfolio will fall considerably from current
levels. If FCF Return maintains these levels, and the market paid for it sustainably, it would imply
an uplift in equity valuation of over 80%. Currently, the market is very sceptical that the energy
companies will sustain their capital discipline and free cash flow generation.
Energy equities are priced as if their ROCE will Energy equity valuation implies that current
fall to new low levels FCF Return will not be sustained
3.0x 3.0x
2.8x 2007 2006 2.8x 2007 2006
2005 2005
2.6x 2.6x
2000 2008
Price/Book multiple
2.4x 2008 2.4x
2001 2000
Price/Book multiple
2004 2001 2004
2.2x 2.2x
2002
2.0x 2003 2.0x 2002 2003
2014 2011 2014 2011
1.8x 1.8x 2009
2017 2009 2010 2013
2010
1.6x 2016 2013 2012 1.6x
2012
2016 2017 2018E
2015 2018E 2015
1.4x 1.4x
R² = 73%
1.2x R² = 86% 1.2x
2019E 2019E
1.0x 1.0x
0% 2% 4% 6% 8% 10% 12% 14% 16% 18% 20% 22% ‐2% 0% 2% 4% 6% 8% 10% 12%
Return on Capital Employed (ROCE) Free Cash Flow Return
Source: Bloomberg, Guinness Asset Management estimates Source: Bloomberg, Guinness Asset Management estimates
In summary, the market remains sceptical of the self‐help improvements that the energy sector is
delivering, and this scepticism can also be seen in 2018 and 2019 dividend yield for the Guinness Energy
Fund holdings (based on $68/bl and $60/bl Brent oil prices respectively). Our holdings are trading at a
substantially higher yield (3% on average) than the long run average level of 2.3%, reflecting a continued
lack of confidence from the market that current dividends can be sustained. We believe that the cash
flow generation capability of the companies has changed substantially in the last few years and that our
portfolio will handsomely covering its implied dividend yield of around 3.2% (generated by 23 portfolio
holdings that have an average dividend yield of 4.2% for 2019). This 3.2% expected yield is the highest
yield ever and well above the 1.9% long term average. Dividends are attractive and safe, as far as we can
see, and we would expect the dividend yield on our energy holdings to start to normalise.
192019: Outlook for Energy
Illustrative yield of all dividend paying holdings in the current Guinness Energy portfolio
Source: Bloomberg, Guinness Asset Management estimates
8% 3.5%
7% 3.0%
2019E dividend yield
6% 2.5%
Dividend Yield
5% 1998‐2017
2.0% average 1.9%
4%
1.5%
3%
1.0%
2%
0.5%
1%
0% 0.0%
1998
1999
2000
2001
2002
2003
2004
2005
2006
2007
2008
2009
2010
2011
2012
2013
2014
2015
2016
2017
2018E
2019E
2020E
RDShell
Occidental
Chevron
Equinor
Valero
Halliburton
NobleEnergy
CNOOC
Schlumberger
Suncor
Devon
Gazprom
BP
ENI
CanadianNatRes
Enbridge
OMV
Anadarko
Apache
PetroChina
TOTAL
ImperialOil
Conoco
The underlying profitability and free cash flow generation of our portfolio will depend as much on
improving capital discipline, lower unit capex and operating costs, and a continued rationalisation of
balance sheets as well as a strengthening oil price. We are encouraged by the steps that many investee
companies have taken in 2018, and look forward to further improvements in 2019.
In our portfolio, we currently combine the themes of expanding free cash flow for mid to large caps,
higher ROCE for the super majors, and North American shale oil & gas growth as key areas of exposure:
Key themes in the Guinness energy portfolio
Source: Bloomberg, Guinness Asset Management estimates
Specialist global energy sector equity funds have historically provided the best exposure to an improving
energy market. Finally, we are pleased to note that the Guinness Energy strategy outperformed the other
potential energy investment ‘routes’ since inception in December 1998.
Total return (annualised), Dec 1998 to end Dec 2018
Source: Bloomberg, Guinness Funds
202019: Outlook for Energy
Will Riley, Jonathan Waghorn & Tim Guinness
January 2019
Guinness Global Energy strategy performance (in USD) 31/12/2018
% returns All * 2018 2017 2016 2015 2014 2013 2012 2011 2010
Guinness Global Energy 8.5 ‐19.7 ‐1.3 27.9 ‐27.6 ‐19.1 24.4 3.0 ‐13.7 15.3
MSCI World Energy NR
5.4 ‐15.9 5.9 27.0 ‐22.1 ‐11.0 18.6 2.5 0.7 12.1
Index
% returns 2009 2008 2007 2006 2005 2004 2003 2002 2001 2000
Guinness Global Energy 61.8 ‐48.2 37.9 10.0 62.3 41.0 32.3 6.7 ‐4.1 39.6
MSCI World Energy NR
26.5 ‐37.9 30.9 18.5 29.5 28.9 26.9 ‐6.0 ‐8.8 4.3
Index
Calculation by Guinness Asset Management Limited, simulated past performance prior to 31.3.08, launch date of
Guinness Global Energy Fund. The Guinness Global Energy investment team has been running global energy funds in
accordance with the same methodology continuously since November 1998. These returns are calculated using a
composite of the Investec GSF Global Energy Fund class A to 29.2.08 (managed by the Guinness team until this date);
the Guinness Atkinson Global Energy Fund (sister US mutual fund) from 1.3.08 to 31.3.08 (launch date of this Fund), the
Guinness Global Energy Fund class A (1.00% AMC) from launch to 02.09.08, and class E (0.75% AMC) thereafter.
Performance would be lower if an initial charge and/or redemption fee were included.
‘* Annualised return since strategy inception in December 1998.
Past performance should not be taken as an indicator of future performance. The value of this investment
and any income arising from it can fall as well as rise as a result of market and currency fluctuations as
well as other factors. You may lose money in this investment. Returns stated above are in US dollars;
returns in other currencies may be higher or lower as a result of currency fluctuations. Investors may be
subject to tax on distributions. The Fund’s Prospectus gives a full explanation of the characteristics of the
Fund and is available at www.guinnessfunds.com.
212019: Outlook for Energy
IMPORTANT INFORMATION AND RISK FACTORS
Issued by Guinness Asset Management Limited, authorised and regulated by the Financial Conduct Authority.
This report is primarily designed to inform you about recent developments in the energy markets invested in by the
Guinness Global Energy Fund. It may also provide information about the Fund’s portfolio, including recent activity and
performance. It contains facts relating to the energy market and our own interpretation. Any investment decision
should take account of the subjectivity of the comments contained in the report.
This document is provided for information only and all the information contained in it is believed to be reliable but may
be inaccurate or incomplete; any opinions stated are honestly held at the time of writing, but are not guaranteed. The
contents of the document should not therefore be relied upon. It should not be taken as a recommendation to make an
investment in the Fund or to buy or sell individual securities, nor does it constitute an offer for sale.
Risk
The Guinness Global Energy Fund is an equity fund. Investors should be willing and able to assume the risks of equity
investing. The value of an investment and the income from it can fall as well as rise as a result of market and currency
movement, and you may not get back the amount originally invested. The Fund invests only in companies involved in
the energy sector; it is therefore susceptible to the performance of that one sector, and can be volatile. Details on the
risk factors are included in the Fund’s documentation, available on our website.
Documentation
The documentation needed to make an investment, including the Prospectus, the Key Investor Information Document
(KIID) and the Application Form, is available from the website www.guinnessfunds.com, or free of charge from:‐
the Manager: Link Fund Administrators (Ireland) Ltd, 2 Grand Canal Square, Grand Canal Harbour, Dublin 2, Ireland;
or,
the Promoter and Investment Manager: Guinness Asset Management Ltd, 14 Queen Anne's Gate, London SW1H
9AA.
Residency
In countries where the Fund is not registered for sale or in any other circumstances where its distribution is not
authorised or is unlawful, the Fund should not be distributed to resident Retail Clients. NOTE: THIS INVESTMENT IS NOT
FOR SALE TO U.S. PERSONS.
Structure & regulation
The Fund is a sub‐fund of Guinness Asset Management Funds PLC (the “Company”), an open‐ended umbrella‐type
investment company, incorporated in Ireland and authorised and supervised by the Central Bank of Ireland, which
operates under EU legislation. If you are in any doubt about the suitability of investing in this Fund, please consult your
investment or other professional adviser.
Switzerland
The prospectus and KIID for Switzerland, the articles of association, and the annual and semi‐annual reports can be obtained
free of charge from the representative in Switzerland, Carnegie Fund Services S.A., 11, rue du Général‐Dufour, 1204 Geneva,
Switzerland, Tel. +41 22 705 11 77, www.carnegie‐fund‐services.ch. The paying agent is Banque Cantonale de Genève, 17 Quai
de l'Ile, 1204 Geneva, Switzerland.
Singapore
The Fund is not authorised or recognised by the Monetary Authority of Singapore (“MAS”) and shares are not allowed to be
offered to the retail public. The Fund is registered with the MAS as a Restricted Foreign Scheme. Shares of the Fund may only
be offered to institutional and accredited investors (as defined in the Securities and Futures Act (Cap.289)) (‘SFA’) and this
material is limited to the investors in those categories
Telephone calls will be recorded and monitored.
22You can also read