2019 Taking a lead in sustainability - Arla Foods

Page created by Mitchell Long
 
CONTINUE READING
2019 Taking a lead in sustainability - Arla Foods
2019
CONSOLIDATED HALF-YEAR REPORT

Taking a lead in
sustainability
2019 Taking a lead in sustainability - Arla Foods
Content
                                         Management Review                            Our Financial Review

                                         03	Performance at a glance                 12	Market overview
                                         04	Message from the Chairman                14	Financial performance
                                              of the Board of Directors               17	Financial outlook
                                         05	Message from the
                                              Chief Executive Officer                 Consolidated Financial Statements
                                         06	Highlights
                                         08 Essential business priorities for 2019    19	Primary financial statements
                                         09	Our climate ambition                     23 Notes
                                         10	Calcium, becoming simpler and stronger   29	Glossary
                                         11	Our democracy in action                  30	Corporate calendar
As a leading international dairy
cooperative with 9,957 farmer
owners, we are creating the blueprint
for a more sustainable dairy industry:
both with our transformation
programme, Calcium, and with our
climate ambition to produce carbon
net zero dairy by 2050.
2   ARLA FOODS   HALF-YEAR REPORT 2019
2019 Taking a lead in sustainability - Arla Foods
Half-year 2019
Performance at a glance

                                                                                                                      Revenue                               Strategic branded volume                            Brand share                          International share*
                                                                                                                                                             driven revenue growth

                                                                                                                  5.2 BILLION EUR
                                                                                                                                                               4.6%                                      45.7% 21.0%
                                                                                                      HY 2019                                  5.2       HY 2019                               4.6%   HY 2019                          45.7%   HY 2019                              21.0%
                                                                                                      HY 2018                                 5.1        HY 2018                     3.0%             HY 2018                         44.6%    HY 2018                            19.2%
                                                                                                      HY 2017                                5.0         HY 2017         1.0%                         HY 2017                         44.1%    HY 2017                             20.1%

                                                                                                                 Target 2019: 10.2-10.6                             Target 2019: 1.5-3.5%                       Target 2019: ≥46.0%                      Target 2019: ≥20.0%

                            Performance price
                                                                                                                   Milk volume                                       Profit share**                                                                        Leverage

                            36.1
                  HY 2019
                  HY 2018
                  HY 2017
                                 EUR-CENT/KG

                                                         36.1
                                                        34.7
                                                         35.8
                                                                                                                   7.0 BILLION KG
                                                                                                                                                               2.3%     OF REVENUE
                                                                                                                                                                                                                 97MILLION EUR
                                                                                                                                                                                                                                                         3.0
                                                                                                      HY 2019                                 7.0        HY 2019                               2.3%   HY 2019                           97     HY 2019                                3.0
                                                                                                      HY 2018                                 7.0        HY 2018                               2.2%   HY 2018    9.5                           HY 2018                          2.6
                                                                                                      HY 2017                                 7.0        HY 2017                              2.1%                                             HY 2017                                      3.4

                                                                                                                                                                    Target 2019: 2.8-3.2%                       Target 2019: 75-100                      Target 2019: 2.8-3.4

* International share is based on retail and foodservice revenue, excluding revenue from Arla Foods Ingredients and trading activities. ** Based on profit allocated to owners of Arla Foods amba.

3       ARLA FOODS            HALF-YEAR REPORT 2019
2019 Taking a lead in sustainability - Arla Foods
MESSAGE FROM THE CHAIRMAN

      Dairy farmers took important steps
      on the sustainability journey
      With the milk price on a steady and competitive level for the first six months of the year and
      with clear targets set to address the sustainability challenges dairy production is facing, we
      close the first half of 2019 on a positive note – but aware of the hard work that lies ahead of
      us in the coming months.

Steady milk price                                      This was very well received by external stakeholders       other sustainability-related indicators to make sure             Performance price
With a steady milk price for the first six months of   as a strong signal that Arla is determined to lead the     that we are on the right path towards our targets.                  Eur-cent/ Kg
2019 we have seen a welcome change to the              transition towards more sustainable dairy production.
unstable picture of recent years. Although most                                                                   A strong democracy
farmers appreciate a volatile market when prices go    The journey towards our climate targets starts on          Realising our sustainability ambition is further
up, we all know that as soon as prices peak, a         the farm level, therefore it is important that we, dairy   supported by our strong democratic set-up that is at

                                                                                                                                                                                   36.1
rollercoaster ride downwards is usually soon to        farmers, take a lead in this agenda and ensure that        the core of our cooperative business. In February we
follow. Keeping the milk price on a reasonable and     consumers maintain their confidence in dairy as part       finally became ONE Arla with equal rights and
competitive level is preferable and much easier for    of a healthy and sustainable diet. Pioneering on this      obligations for all 9,957 farmer owners. This will
both business and farmers to cope with.                journey as farmers is the only way to reach our 2050       make us a stronger business going forward and give
                                                       ambitions, while developing and keeping our farms          us a consistent and transparent structure across all
Farms first                                            profitable.                                                owner organizations. This change already had
Climate and sustainability have been very much in                                                                 positive effects, when we elected new members to
                                                                                                                                                                         HY 2019                                36.1
focus both professionally and in our everyday lives    Meeting future demands on sustainability will not          the Board of Representatives and the Board of
during the first half of 2019, as the environmental    be a walk in the park, but we have come a long way         Directors in May with new, aligned procedures          HY 2018                       34.7
footprint of farming and food production were          already. We reduced emissions per kilo of milk by          focused on creating the strongest possible             HY 2017                              35.8
increasingly scrutinised and challenged by our         24 per cent since 1990, and Arla farmers are among         governing bodies for bringing Arla into the future.
consumers and politicians alike. In March, we          the most efficient. We perform carbon emissions
announced Arla’s climate target to produce carbon      checks, focus on animal welfare and are continually        Jan Toft Nørgaard
neutral milk by 2050. Our medium goal is to reduce     developing our quality program, Arlagården®. We            Chairman of the Board of Directors
CO2 emissions by 30 per cent by 2030.                  diligently document our progress on climate and

4     ARLA FOODS      HALF-YEAR REPORT 2019
2019 Taking a lead in sustainability - Arla Foods
MESSAGE FROM THE CHIEF EXECUTIVE OFFICER

      A strong and stable
      half year with intensified focus
      on sustainability
      During the first half of 2019, we continued to build on the momentum
      we started to create in the second half of 2018. We delivered strong
      branded volume growth, particularly in our international commercial
      segment, delivered sustainable savings and invested in our future.
      Sustainability was on top of the agenda across our cooperative.

During all six months we delivered a stable and          Investing in the future                                   To govern our sustainability strategy, we established    As global economic and political uncertainties grow,
competitive performance price at 36.1 EUR-cent/kg.       Our transformation programme, Calcium delivered           a Sustainability Board with members of the Executive     we remain alert and prepared, particularly for the
Mainly due to improved market circumstances and          significantly ahead of plans throughout the               Management Team. We strengthened the dialogue            damage Brexit may cause, while also closely watching
deliveries from our Calcium transformation programme,    organisation, which has contributed to a healthy          with our farmer owners to ensure their commitment        the results of trade wars. However, our outlook is
which exceeded expectations. The global dairy            net profit level. Well into the second year of our        and involvement as we develop models to drive            positive and on several KPIs we are even increasing
market was characterised by unusual stability.           transformation, we have made sustainable changes          progress on farm.                                        the expectations.
                                                         to the way we work, spend and invest.
Continued improvements in quality of sales                                                                         We made a big move in the market by converting           Peder Tuborgh
We continued to increase the brand share and             We also invested a record-high EUR 384 million in         over one billion pieces of packaging across Europe       CEO
deliver growth for our strategic brands at 4.6 per       both M&A and CAPEX investments in the first six           to more renewable and recyclable solutions. This
cent. The international segment in particular            months of 2019, e.g. in technologies, process             initiative alone is close to delivering the 8,000 tons
excelled in the first half with 10.2 per cent branded    optimisation, energy efficiencies and expansions to       of CO2 that we aim to reduce from packaging every
volume growth, leading to an increased international     our supply chain. Despite heavy investments and the       year until 2030.
share of Arla’s total retail and foodservice business.   extraordinary payout of the 2018 profits to our owners,

                                                                                                                                                                                                97
                                                         our leverage is still well within the target range.       Expectations for the full year
We solidified our presence in the Middle East and                                                                  In the second half of 2019 we will focus on
North Africa with the formal takeover of the             Focus on sustainability and climate intensified           remaining on track and building additional momen-
operations of the Kraft® branded cheese business         An overall theme across the business and the farmer       tum to deliver our full year targets and strengthen
from Mondeléz International. That investment and         cooperative is sustainability. We continued to show       our competitiveness.                                                          MILLION EUR

our license agreement to use Kraft® for the next 12      leadership by announcing 2030 and 2050 climate
                                                                                                                                                                            HY 2019                                       97
years will have great strategic importance for the       targets and plans to decrease CO2 emissions across
                                                                                                                                                                            Expectations 2019                              ≥100
international segment going forward.                     all parts of our value chain.
                                                                                                                                                                            Target 2019                                    75-100
5     ARLA FOODS       HALF-YEAR REPORT 2019
2019 Taking a lead in sustainability - Arla Foods
Highlights
                        The first half of 2019 was all about sustainability at Arla, embracing the concept from multiple angles on our
                        way to fulfil our Good Growth 2020 strategy. We launched our ambitious environmental strategy, introduced an
                        industry-leading move in recyclable packaging, helped our cooperative governing bodies renewing themselves,
                        while our transformation programme, Calcium ensured that we are changing for the better – sustainably.

                                                                      Carbon net zero dairy 2050
                                                                      Together with our 9,957 farmer owners Arla launched
                                                                      our most ambitious climate targets to date in March: to
                                                                      reduce greenhouse gas emissions by 30 per cent per
                                                                      kilo of milk over the next decade and to work on
                                                                      becoming carbon net zero by 2050. “Imagine being
                                                                      able to drink a glass of milk knowing that it has not
                                                                      contributed to warming the climate. That’s truly the
                                                                      future of dairy”, says our CEO Peder Tuborgh.

                                                                                                                                           Arla takes over cheese
                                                                                                                                           business in MENA
                                                                                                                                           In May, Mondeléz International
                                                                                                                                           handed over the keys to their
                                                   Calcium savings: Above expectations                                                     production facility in Bahrain which
                                                   Our transformation programme, Calcium, delivered EUR 97 million savings in the          Arla agreed to acquire in December
                                                   first half of 2019. This is significantly ahead of our expectations, and close to the   2018. In addition, Arla signed a
                                                   high-end of our full year target. The savings were delivered approximately equally      long-term licence agreement
                                                   between marketing, indirect spend and production, where we were able to                 with Kraft® to produce and sell
                                                   optimise our production, reduce complexity and enhance procurement.                     their branded cheese products
                                                                                                                                           in MENA. With full ownership
                                                                                                                                           of this state-of-the-art
                           Saving the planet a billion packs at a time                                                                     production site, the acquisi-
                           By the end of the year, we are making 600 million fresh milk cartons renewable and                              tion strategically expands
                           560 million yoghurt pots recyclable thus cutting 7,330 tonnes of carbon out yearly                              Arla’s position within key
                           from our value chain. This first big move in our sustainable packaging strategy will                            cheese categories, while
                           help us reach our 2030 ambition of reducing CO2 emissions by 30 per cent.. The                                  also expands our supply
                           new packaging will be available for consumers in Arla’s six main European markets                               capabilities to deliver
                           – Sweden, Denmark, Finland, the Netherlands, Germany and the UK.                                                substantial value for the
                                                                                                                                           company.

6   ARLA FOODS   HALF-YEAR REPORT 2019
2019 Taking a lead in sustainability - Arla Foods
Highlights                               (continued)

                        Arla’s democracy in action
                        During the spring, elections for the Board of Representa-
                        tives (BoR) took place across all of our seven member
                        countries. As a result, 55 new members joined the BoR.
                        Arla’s 175-member governing body then elected four new
                        members to our Board of Directors (BoD) for the next two years.

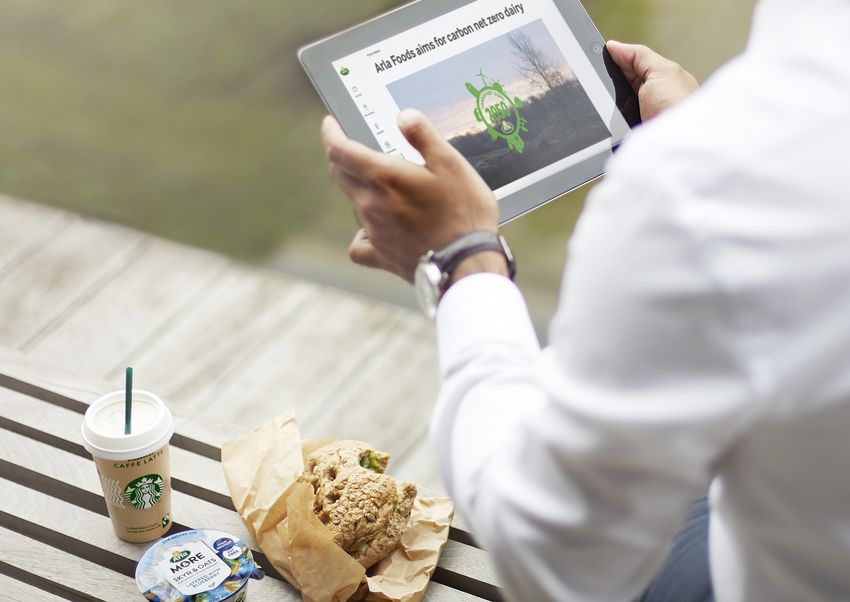
                                                                                                  Innovative new sales model in Bangladesh
                                                                                                  Equipped with a bicycle, a tablet and our Dano milk powder
                                                                                                  sachets in their backpacks, a growing team of female
                                                                                                  microentrepreneurs – our Pushti ambassadors – is now
                                                                                                  enabled to reach people in rural parts in Bangladesh, taking
                           Arla is among the best digital companies
                                                                                                  a nutritious, affordable dairy product to rural regions, where
                           A focus on performance-driven digital culture, implementation of
                                                                                                                     the majority of children are underweight.
                           digital as a part of the business across sales and marketing, and
                                                                                                                     The ambassadors are being mobilised
                           cooperation between global and local markets were the reasons
                                                                                                                     through Arla’s partnerships with local and
                           why Arla took home two honors at the Danish Digital Awards. The
                                                                                                                     international non-governmental
                           jury acknowledged how fast we accelerated digital change despite
                                                                                                                     organisations.
                                                                      the complexity and
                                                                      number of brands and
                                                                       markets in Arla. By
                                                                       insourcing digital media
                                                                        buying and creative
                                                                        content production we
                                                                        are on our way to
                                                                         something even bigger.

7   ARLA FOODS   HALF-YEAR REPORT 2019
2019 Taking a lead in sustainability - Arla Foods
Essential business priorities for 2019
                            1. Continuous price & margin management                        5. Win in focus markets
                               while driving volume growth
                                                                                                    Stay strong in European core markets
                                     Strong price management
                                                                                                  	Deliver brand growth and/or higher profit in key
                                     Take advantage of our diverse milk pool                        market segments such as MENA, Bangladesh, China
                                                                                                    and Nigeria
                            2. Deliver on Calcium to transform Arla
                                                                                                 	Assessing the outcome and managing the impact
                                     Deliver on Calcium savings                                    of Brexit

                                     Anchor the transformation                             6. Take lead on sustainability

                            3. Increase innovation output                                           Launch our new climate ambition

                                     Review and enhance innovation model                          	Support our branded volume growth with sustainable
                                                                                                    moves, eg. switching to sustainable packaging
                                     Increase innovation speed and rate
                                                                                           7. Power-up Arla Foods Ingredients
                            4. Drive strong branded volume growth agenda
                                                                                                    Increase proportion of value-added products
                                   	Secure a portfolio of higher-margin and consumer
                                     oriented products                                            	Secure the growth of our early life nutrition
                                                                                                    business in China
                                   	Execute global brand bets with new launches and
                                     scaling of successful products

                                     Maintain strong, profitable presence in key markets

                                                                                                                      Performance on track
                                                                                                                      Trend on track

8   ARLA FOODS   HALF-YEAR REPORT 2019
Our climate ambition

Arla and our 9,957 farmer owners in March launched our most ambitious targets so far to accelerate the transition to
sustainable dairy production, with intensified focus on farms. The main target is to reduce greenhouse gas emissions
by 30 per cent per kilo of milk over the next decade and to work towards carbon net zero by 2050.

Our ambition covers three themes                                                   To reach our goals we will focus on three areas
BETTER CLIMATE             CLEAN AIR & WATER           MORE NATURE                 FARMS                                 PRODUCTION                           PACKAGING AND
                                                                                                                                                              FOOD WASTE

                           Nitrogen and phosphorus     Increase biodiversity         Optimized feed for the cows to       More fossil free transportation     More sustainable packaging
                           cycles in balance           and access to nature           decrease methane emissions           Energy-efficiency                   Minimize food waste through
                                                                                     Improved manure efficiency           Increased use of renewable           several initiatives
                                                                                     More carbon captured in               energy in supply chain              Recyclable materials
                                                                                      the soil

Three guiding principles will enable us to reach our targets                       We have already come far in reducing our impact
FOSSIL TO                  CIRCULAR ECONOMY            COOPERATION IN              FARMS                                 PRODUCTION                           RENEWABLE ENERGY
RENEWABLE                                              THE VALUE CHAIN

                                                                                   24%
                                                                                   Smaller CO2 footprint per kilo milk
                                                                                                                         22%
                                                                                                                         Less CO2 emissions from
                                                                                                                                                              27%
                                                                                                                                                              Out of overall
                                                                                   since 1990                            production, packaging and            consumption
                                                                                                                         transport since 2005
Becoming simpler and stronger
In 2018 we launched our transformation programme, Calcium which accelerates our strategy by

                                                                                                                                                       97
transforming the way we work, spend and invest. Calcium strengthens our bones, creates efficiencies
and releases money to reinvest in our growth.
Great examples of our transformation:

                                                                                                                                                             Million EUR
                                                                                                                                                        Saved in half-year
                                                                                                                                              Updated full year target: ≥100 Million EUR

Administration                                                          Production
A new level of transparency to the smallest details of our spend        We create profound change at every site and in every role. We shift
enables us to spend where it matters. We significantly reduce cost
that do not directly contribute to our products.
                                                                        our focus from the dairy site to the efficiency of the individual
                                                                        production line and to overall equipment efficiency. We also reduce
                                                                        complexity, share more products across markets, and introduce a
                                                                                                                                                            400
                                                                                                                                                             Million EUR
We reduced our travel mileage by 25 per cent, saving costs and          minimum volume target for new products.                                       (Full programme target)
CO2 emmissions.
                                                                        We significantly reduced the number of unnecessary ingredients,
                                                                        thoroughly reviewed and optimised production processes on 24+                                                      2021 December
                                                                        sites, and trained 300+ employees in the line-centric mindset.

Marketing & promotion
We spend less on developing campaigns and more on reaching
                                                                        Innovation
                                                                        Our process from idea to market became simpler and shorter to
                                                                                                                                                                     211
                                                                                                                                                                     Million EUR
                                                                                                                                                                                           2019 June

consumers. Our content is now developed cheaper, faster and better in   capture new opportunities faster. We experiment more in the
our in-house digital studios, the Barn. With the help of data we also   markets and scale successes quickly.
optimise our focused trade investments and enable our key account
managers to make informed decisions.                                    We moved our people closer to the front lines and set                                       114
                                                                                                                                                                     Million EUR
                                                                                                                                                                                           2018 December

                                                                        up our organisation so that we are quicker to get innovation
We had a successful pilot run of our new retail                         to the markets.
promotion optimisation system that uses big data to create
promotion strategies.                                                                                                                                                                      2018 January

10    ARLA FOODS      HALF-YEAR REPORT 2019
Our democracy in action
Arla is a cooperative owned by 9,957 dairy farmers in seven countries. Ensuring that all of our owners’ voices are heard and
represented is essential for success and trusting relations. In every odd year, our owners elect members to the Board of Representatives,
which in turn elects the Board of Directors. The company’s governance is shared between these elected bodies and the Executive
Management Team.

Our cooperative governance                                                                                 New BoD members                           New BoR members
                                                              Owner nationalities
                                                                             Germany
                                                                             Luxembourg

      Owners (Farmers)                  Denmark         Sweden
                                                                             Belgium
                                                                             Holland
                                                                                            United
                                                                                            Kingdom
                                                                                                           Jørn Kjær Madsen       René Lund Hansen
                                                                                                                                                                     55
                                                                                                                                                                    New members
                                                                                                           (DK)                   (DK)
                                                                 Districts
     Local representatives
                                                                 Regions
                                                                                                                                                                    Average age

                                   77 DK members
                                                         Board of Representatives
                                                         175 (+12 employee repr.)
                                                      50 SE members     23 CE members    25 UK members
                                                                                                                                                                     45
          Our boards                                                                                       Walter Lausen          Marcel Goffinet
         and councils                                                                                      (DE)                   (BE)
                                      Area council                                          Area council
                                                            Board of Directors
                                                          15 (+3 employee repr.)
                                      Area council                                          Area council

In 2019 the members of the Board of Directors
(BoD) were elected with a new process, accepted by
the Board of Representatives (BoR) in October 2018.
                                                      skills to conduct good global governance. The
                                                      process is conducted by Evaluation Committees
                                                      corresponding to member areas, and is facilitated
                                                                                                           We would like to thank our departing
                                                                                                           BoD members
                                                                                                             Viggo Bloch (DK)
                                                                                                                                                       24% 76%
                                                                                                                                                           Female                 Male
The new process includes a thorough competency        by an external professional.                           Torben Myrup (DK)
evaluation to ensure the BoD has the right                                                                   Manfred Sievers (DE)
                                                                                                             Markus Hübers (DE)

11     ARLA FOODS    HALF-YEAR REPORT 2019
Financial review
 In the first half of 2019, Arla delivered a stable and competitive milk price to our farmer owners, with our
performance price reaching 36.1 EURcent/kg of milk. Revenue increased by 2.0 per cent to EUR 5,232 million,
driven by strong branded volume growth at 4.6 per cent as well as slightly higher sales prices. Our transformation
programme, Calcium, reached the half-year on a very positive note with savings amounting to EUR 97 million;
significantly ahead of our expectations. Efficiencies enabled by Calcium contributed to a healthy net profit level at
2.3 per cent of the revenue, ahead of the previous two years’ net profit levels. In the first six months of 2019,
Arla also invested a record high EUR 384 million for M&A and CAPEX investments, supporting the delivery of our
Good Growth 2020 strategy.

                                                                                                                              Natalie Knight
                                                                                                                              Chief Financial Officer

MARKET OVERVIEW
Slowdown in global growth
In the first half of 2019, the global economic
                                                        Meanwhile the European Union is forecasted to
                                                        grow by 1.6 per cent, compared to 2.1 per cent in
                                                                                                              “Despite increasing market
environment was characterised by growing
uncertainty around Brexit, and an intensifying global
                                                        2018. The European Central Bank has also raised
                                                        increasing concerns of a potential recession in
                                                                                                              uncertainty, Arla had an
trade conflict between the US and China. These          some of the core European markets.                    exceptionally strong first half of
growing tensions negatively impacted the stability
of critical Arla geographies and led to a slowdown in   According to the OECD, in 2019 dairy consumption      2019. Our milk prices were stable
economic growth rates as well as consumer               is expected to grow only modestly, by 0.4 per cent
confidence compared to the first half of 2018.          in developed markets, and by 2.2 per cent in          and we significantly increased
                                                        developing countries. In the EU markets, the 2019
According to the International Monetary Fund (IMF)      consumption of fresh dairy products is projected to   competitiveness versus last year.
global economic growth in 2019 is expected at
3.3 per cent compared to 3.6 per cent for 2018.
                                                        decline by 0.1 per cent, whereas cheese and butter
                                                        consumption is expected to grow at 0.8 per cent       We also saved EUR 97 million by
This growth is primarily driven by emerging markets,
which are projected to grow by 4.4 per cent.
                                                        and 0.9 per cent respectively.
                                                                                                              optimising our ways of working
                                                                                                              and spending.”

12    ARLA FOODS      HALF-YEAR REPORT 2019
In the first half of 2019, economic uncertainty                     The unusual stability in European milk prices was             Global Dairy Trade prices and Yellow Cheese prices in EU 2018-2019
impacted exchange rates, however with mixed                         driven by the small positive demand growth                    (EUR/Tonne)
impact across Arla core currencies. The SEK                         coupled by only modest changes in milk supply.
continued its negative trend of over 5 years with a                 While the milk price was stable, the relative values
                                                                                                                                  3,500                                                2018                                                  2019
3.6 per cent drop, while the GBP and USD increased                  of protein and fat moved towards the historic
in relative strength to the EUR by 0.8 per cent and                 relationship, with the value of protein increasing
6.6 per cent respectively. However, after our                       and the value of fat decreasing during the first half
reporting period the GBP started to depreciate                      of 2019.
following news of an impeding no-deal Brexit.                                                                                     3,000
                                                                                                                                                                                       16%
                                                                    Throughout the first half of 2019, the European and                                                                                                                                          10%
Unprecedented stability in milk prices                              global milk prices decoupled slightly, with EU milk
and milk intake                                                     prices keeping a higher level compared to the Global
Global and European milk prices have shown                          Dairy Trade (GDT) quoted prices. However, by the
                                                                                                                                  2,500
unprecedented stability in the first six months of 2019.            end of the half year the gap started to close,
This was reflected in the prepaid milk prices across                indicating integration o f the global milk markets on
Europe, which remained stable in the first six months of            the mid to long term.
2019. Such a long prepaid milk price stability has not
been seen in Europe since 2006, so since before the                                                                               2,000
liberalisation of the European milk markets.

                                                                                                                                          18

                                                                                                                                                   18

                                                                                                                                                         18

                                                                                                                                                                   8

                                                                                                                                                                            18

                                                                                                                                                                                  18

                                                                                                                                                                                           18

                                                                                                                                                                                                  18

                                                                                                                                                                                                         18

                                                                                                                                                                                                                          8

                                                                                                                                                                                                                          8

                                                                                                                                                                                                                          8

                                                                                                                                                                                                                         19

                                                                                                                                                                                                                         19

                                                                                                                                                                                                                         19

                                                                                                                                                                                                                          9

                                                                                                                                                                                                                         19

                                                                                                                                                                                                                         19
                                                                                                                                                                  01

                                                                                                                                                                                                                       01

                                                                                                                                                                                                                       01

                                                                                                                                                                                                                       01

                                                                                                                                                                                                                       01
                                                                                                                                       20

                                                                                                                                               20

                                                                                                                                                        20

                                                                                                                                                                        20

                                                                                                                                                                                 20

                                                                                                                                                                                       20

                                                                                                                                                                                                20

                                                                                                                                                                                                       20

                                                                                                                                                                                                                      20

                                                                                                                                                                                                                      20

                                                                                                                                                                                                                      20

                                                                                                                                                                                                                      20

                                                                                                                                                                                                                      20
                                                                                                                                                              r2

                                                                                                                                                                                                              t2

                                                                                                                                                                                                                    v2

                                                                                                                                                                                                                    c2

                                                                                                                                                                                                                    r2
                                                                                                                                      n

                                                                                                                                               b

                                                                                                                                                    ar

                                                                                                                                                                       ay

                                                                                                                                                                             ne

                                                                                                                                                                                      ly

                                                                                                                                                                                              g

                                                                                                                                                                                                     p

                                                                                                                                                                                                                    n

                                                                                                                                                                                                                    b

                                                                                                                                                                                                                  ar

                                                                                                                                                                                                                  ay

                                                                                                                                                                                                                  ne
                                                                                                                                                             Ap

                                                                                                                                                                                                                Ap
                                                                                                                                                                                                          Oc

                                                                                                                                                                                                                No

                                                                                                                                                                                                                De
                                                                                                                                            Fe

                                                                                                                                                                                                  Se

                                                                                                                                                                                                                Fe
                                                                                                                                                                                           Au
                                                                                                                                     Ja

                                                                                                                                                                                                                 Ja
                                                                                                                                                                                  Ju
                                                                                                                                                   M

                                                                                                                                                                                                                M
                                                                                                                                                                   M

                                                                                                                                                                                                                M
                                                                                                                                                                            Ju

                                                                                                                                                                                                               Ju
                                                                                                                                               US WMP prices in EUR                    YC prices in Europe
Gross Domestic product growth rate (per cent)*

7                                                                                                           6.6
                                                                                                                  6.3
6
                                                                             5.0 5.0
5
                                                                                                                            The milk production environment has been                                     geographies. Milk intake from Danish and UK
4       3.6
                3.3
                                                                   3.5                                                      challenging since the second half of 2018, mainly                            farmers increased by 1.0 per cent and 2.7 per cent
                                                             3.0
3                                                                                             2.7                           related to the drought in the summer of 2018.                                respectively, however milk intake from farmers in
                             2.1                                                                    2.2                     According to the Food and Agriculture Organization                           Central Europe and Sweden decreased by 5.1 per
2                                   1.6
                                             1.4 1.3                                                                        of the UN, global milk production is projected to be                         cent and 1.9 percent respectively. The main driver
1                                                                                                                           flat for the first half of 2019 compared to the first                        for the decrease in milk intake in Central Europe was
                                                                                                                            half of 2018.                                                                the mandatory transition of all owners in Arla
0                                                                                                                                                                                                        Central Europe to non-GMO feed, which lead to a
           World         European Union   Middle East and   Sub-Saharan    Southeast Asia   North America    China
                                           North Africa        Africa                                                       At Arla, milk intake from farmer owners remained                             number of farmers leaving the cooperative.
                                                                                                                            unchanged compared to the first half of 2018,
    2018        2019 (forecasted)                                                                                           however with some variances across core
* Source: IMF

13         ARLA FOODS         HALF-YEAR REPORT 2019
FINANCIAL PERFORMANCE
Competitive owner milk price                                  primarily driven by sales prices, M&A, currency,          Among our global brands, the key highlights are:        In the first half of 2019 our branded growth was also
in the first half of 2019                                     as well as a positive mix effect from our branded           Our milk-based beverages grew 11.9 per cent,       supported by the launch of our climate ambition to
During the first half of 2019, Arla’s performance             volume growth.                                                driven by innovative launches like StarbucksTM      produce carbon net zero dairy by 2050. Arla has always
price improved by 1.4 EUR-cent to 36.1 EUR-cent,                                                                            Almond, the Doubleshot and Skinny Latte.            been a forerunner in sustainable dairy production, and
compared to 34.7 EUR-cent in the first half of 2018.          M&A positively impacted revenue in the first half of        The Arla® brand grew 5.3 per cent, supported         now we are putting even more effort both into
This performance price is better than how our most            2019 by EUR 36 million, the key drivers being full            by 13.5 per cent growth of the successfully         transforming our ways of farming, production and
important European peers performed in the                     year effects from the Yeo Valley Dairies Ltd. licencing       re-launched Lactofree brand.                        packaging and into communicating our achievements.
same period, thus it is a key indicator that our              agreement in the UK, and the purchase of the                Lurpak® was up 1.6 per cent, driven by high sales    This reflects the very strong trend among consumers
transformation programme, Calcium, and our price              remaining shares of our ingredients business, Arla            of our innovative spreadable, Lurpak® Softest,      who are pushing for more sustainable foods, hence our
management strategy are improving Arla’s                      Foods Ingredients SA in Argentina.                            despite its high prices.                            climate agenda gives our brands extra credibility and
competitiveness in the European dairy market.                                                                             Puck® with 4.2 per cent growth. Our Middle East      competitive advantage. We have already seen the
                                                              Currency movements impacted revenue positively                star launched Puck® Squares in February, which      commercial impact in the successful relaunch of our
                                                              by EUR 34 million, however considering the size of            proved to be a fruitful innovation already in the   Organic line, while our switch to environmentally-
                                                              Arla’s overall currency exposure, this constitutes a          first months after launch.                          friendly brown carton has also led to higher sales.
Owner milk price (EURc/kg)                                    small impact in a historical perspective.                   Castello’s decline in volumes was due to a
                                                                                                                            challenging competitive environment across
37
                                                       36.1   Firm branded volume growth backed by                          Europe and certain international markets.
               35.8
36                                                            our sustainability agenda
35                               34.7                         Arla realised a firm strategic branded volume growth
                                                34.2
34                                                            of 4.6 per cent during the first half of 2019. This
        33.3
                          32.6                                increased our branded share of revenue to 45.7 per
33
                                                              cent, equalling an increase of 1.1 percentage points
32
                                                              compared to the first half of 2018. Hence we are on
31                                                            track to hit our 2019 branded share target of 46 per
         HY 2017           HY 2018               HY 2019
                                                              cent. Europe delivered 2.3 per cent branded volume               Branded volume growth by global brand (per cent)
     Prepaid milk price                 Performance price     growth in a saturated market, resulting in market

                                                                                                                               5.3 1.6 -4.1 4.2 11.9
                                                              share gains. Our international segment delivered
                                                              10.2 per cent branded volume growth, with Nigeria                                                                                                                      *
The prepaid milk price paid to our farmer owners was          and Southeast Asia performing ahead of targets, and
remarkably stable with only minor changes from                our early life nutrition business in China performing
February to June, while it improved by 1.5 EUR-cent           strong.
compared to 2018, reaching the highest level in the
past three years.                                             Branded volume growth development                                                                                                              *Milk-based beverages
                                                              HY 2017 to HY 2019                                                                                                                             (incl. Starbucks)
All drivers support
positive revenue developement                                 HY 2019                                          4,6%
During the first half of 2019, revenue grew 2.0 per
                                                              HY 2018                             3.0%
cent to EUR 5.2 billion, compared to EUR 5.1 billion
in the first half of 2018. Revenue growth was                 HY 2017             1.0%

14     ARLA FOODS         HALF-YEAR REPORT 2019
Commercial segment growth driven by brands

Europe: Brand and innovation drive top line             International: Double digit sales and                        AFI: Continued growth in value-added whey            Trading: Trading share proactively managed to
European retail and foodservice sales declined 1.5      branded volume growth                                        protein business and child nutrition                 optimize overall group profit
per cent to EUR 3,149 million in the first half of      Our international segment experienced the highest            In the first half of 2019, Arla Foods Ingredients,   Sales in our trading business increased by 8.3 per
2019, compared to EUR 3,197 million in the same         growth in the past three years. Sales grew 11.9 per cent     revenue grew 13.1 per cent to EUR 352 million from   cent to EUR 892 million in first half of 2019 from
period last year, due to the strategic decision to      to EUR 839 million in first half of 2019 compared to         EUR 311 million in the same period last year.        EUR 796 million in the same period last year.
discontinue selected loss-making private label          EUR 750 million in the same period last year, with
contracts and the depreciaction of the SEK.             strong development across regions. Our branded               The value-added business grew 14.7 per cent by       The value of protein continued to rise during the first
                                                        business grew 10.2 per cent in the first half of 2019,       successfully moving more volumes into value-added    half of 2019, supporting the value of both skim milk
The Europe segment has continued to push the            bringing our branded share of business to 85.4 per cent.     protein segments like alpha-lactalbumin, whey        powder and caseinate products for manufacturing in
sales of our higher margin, branded products, which                                                                  protein hydrolysates and whey protein isolate.       EU and for export. A strong export drive to China also
has resulted in strong branded volume growth of 2.3     With the recent approval of our early life nutrition (ELN)                                                        secured higher marginal value for powders in
per cent, bringing the brand share of business to       products’ registration, China had a very strong growth in    Revenue in our child nutrition manufacturing         general.
52.0 per cent. All core European markets but            the organic ELN business and liquid milk, enjoying more      business in China was stable, affected by the new
Denmark increased branded volume.                       than 50 per cent growth, both in volume and revenue.         regulation limiting the number of customers for      High milk intake in the UK in combination with Brexit
                                                        West Africa and South East Asia have also experienced        which a specific site can produce.                   initially projected at end of March, pushed more milk
Our strong focus on big bets and fast scaling of        double digit growth.                                                                                              into the liquid commodity market and lifted Arla’s
successes across Europe were the main drivers                                                                                                                             trading share marginally.
behind our branded volume growth and behind the         MENA, being our biggest commercial region in
continuing strong growth of the Arla® brand outside     international also delivered strong branded volume
Scandinavia.                                            growth and outperformed the market, leading to
                                                        increased market share in all key product categories. We
The branded growth was primarily driven by retail in    formally took over the Kraft® branded cheese business
the UK, the Netherlands, and Finland, and our           from Mondeléz International in May. The investment
foodservice segment. Within the product categories      and the following license agreement to use Kraft® for
main drivers were Lactofree, Skyr, cheese, milk-based   the next 12 years will have great strategic importance
beverages under the Arla® brand and StarbucksTM.        for the international zone going forward.

                                                        Sales in North America slightly declined due to a
                                                        strategic reset in the US with closing down some
                                                        business areas, however profitability improved
                                                        significantly.

                2.3%
 Strategic branded volume driven revenue growth
                                                                       10.2%
                                                         Strategic branded volume driven revenue growth
                                                                                                                                   14.7%
                                                                                                                               Growth in value-added products
                                                                                                                                                                                             892
                                                                                                                                                                                          Revenue, million EUR

15    ARLA FOODS      HALF-YEAR REPORT 2019
Our Calcium transformation programme                      Transformation pays off: Net profit improves                Cash flow impacted by high levels                        owners and our significant investments. On top of
delivers savings ahead of targets                         and ahead of expectations                                   of investment                                            this, the technical accounting change related to the
Our transformation programme, Calcium performed           In the first half of 2019, Arla achieved a net profit of    Arla delivered a cash flow from operating activities     implementation of the IFRS 16 leasing standard
strongly during the first half of 2019, delivering        EUR 122 million, or 2.3 per cent of revenue which is        of EUR 204 million in the first half of 2019. However,   had a modest impact on leverage due to a negative
savings of EUR 97 million. This means that halfway        slightly ahead of our expectations and 0.1 percentage       the extraordinary pay-out of the full 2018 profit        impact on net interest-bearing debt of EUR 188
into 2019 we have almost reached the high-end of          points ahead of last year’s level. This was driven          (EUR 289 million) to our farmer owners, the highest      million, countered largely by a positive impact on
our initial full year target of EUR 75-100 million. The   mainly by reduced costs, but also impacted by               level of investments in seven years in supply chain      EBITDA.
savings were achieved at same levels in marketing,        active price management in the European and                 and payments in relation to acquisitions as well as
indirect spend as well as production. We consider         international commercial segment.                           higher working capital resulted in a negative total      Overall, the leverage development is in line with
this a remarkable achievement showing the                                                                             free cash flow of EUR 134 million.                       expectations.
dedication and hard work delivered by the full Arla       The net profit improvement is particularly satisfying
organization to support our transformation.               when seen in combination with our competitive               We formally took over the Kraft® branded cheese
                                                          prepaid milk price during the first half of 2019.           business from Mondeléz International in May. The
                                                                                                                      investment and the following license agreement to
                                                          Working capital maintained at                               use Kraft® for the next 12 years will have great
                                                          historically low levels                                     strategic importance for the international segment
                                                          Net working capital increased by EUR 54 million to          going forward.
                                                                                                                                                                                  Financial leverage development
                                                          EUR 982 million, compared to EUR 928 million
                                                          during the same period last year. The increase is a         The biggest CAPEX investments for the first half of
                                                                                                                                                                                  HY 2019                                   3.0
                                                          result of lower inventory volumes offset by higher          2019 include two large investments in Arla Foods
                                                          prepaid and sales prices. Overall, this is a satisfactory   Ingredients: the construction of a new powder               HY 2018                             2.6

              2.3% Net profit
                                                          development reflecting our continued focus on
                                                          optimising our working capital positions. For more
                                                          details refer to page 25.
                                                                                                                      tower in Pronsfeld, Germany, as well as the
                                                                                                                      consolidation of our footprint for fermented
                                                                                                                      products in Northern Europe.
                                                                                                                                                                                  HY 2017                                         3.4

                                                                                                                      Leverage in target range as expected
                                                                                                                      The first half of 2019 ended with a financial leverage

                   97
               Calcium savings,
                                                                                                                      of 3.0, and hence in the middle of our target range
                                                                                                                      of 2.8-3.4. This constitutes an increase of 0.4
                                                                                                                      compared to the first half of 2018.
                                                                                                                                                                               As a further result of the full payout of the 2018
                                                                                                                                                                               profit, high levels of investment, and the
                                                                                                                                                                               implementation of the IFRS 16 leasing standard,
                 million EUR                                                                                          This development was driven by an increase in net        our equity ratio for the first half of 2019 decreased
                                                                                                                      interest-bearing debt, however countered by an           to 32 per cent, compared to 36 per cent at
                                                                                                                      increased EBITDA. The negative development in net        30 June 2018. This is in line with our previously
                                                                                                                      interest-bearing debt was driven by the extraordi-       communicated expectations.
                                                                                                                      nary payment of the 2018 profits to our farmer

16    ARLA FOODS       HALF-YEAR REPORT 2019
FINANCIAL OUTLOOK

Arla delivered strong results in the first half of 2019                                                           Expectations for 2019

with all financial and strategic KPIs tracking at or                                                                           Revenue                            Profit share                               Leverage
ahead of targets. The second half of 2019 will be
focused on securing delivery of our increased full                                                                   10.2-10.6 BILLION EUR
                                                                                                                                                            2.8-3.2%  OF REVENUE
                                                                                                                                                                                                       2.8-3.1
year targets, further strengthening our relative
competitiveness versus our peers and preparing
                                                                                                                             Brand share
ourselves for the potential adverse consequences
of Brexit that will affect our results into 2020.                                                                       ≥46.0%
                                                                                                                         International share                    Calcium savings                     Strategic branded volume
                                                                                                                                                                                                     driven revenue growth
Given the continued uncertainty around the adverse       and products related to our sustainability agenda
outcomes of Brexit, as well as the global market
economy being increasingly challenged by trade
conflicts, we believe that our performance in the
                                                         will be the main drivers of this increase. The strong
                                                         branded growth outlook also impacts our outlook
                                                         for delivering our branded share target. We expect to
                                                                                                                       ≥21.0%                                   ≥100  MILLION EUR
                                                                                                                                                                                                        ~3.5%
second half of 2019 could be negatively impacted         deliver at least 46 percent brand share level.
by external factors. Revenue in the UK amounted to                                                                  Guidance updated    Original guidance
EUR 1.4 billion in first half of 2019.                   We are also increasing the outlook for the
                                                         international share of retail and foodservice sales
For the full year 2019 we expect total group revenue     from 20 per cent to 21 per cent. This improvement
to come in within our communicated target range of       is driven by the strong branded growth realised in
EUR 10.2 billion to EUR 10.6 billion.                    our international markets during first half of 2019 as   Due to timing and phasing of Calcium initiatives we        We strengthen our year end 2019 leverage outlook
                                                         well as a strong momentum of commercial activities       expect the year on year delivery of Calcium savings        to 2.8-3.1.
Our branded growth outlook for the full year of          into the second half of 2019.                            to slow down in the second half of 2019.
2019 is increased to 3.5 per cent or above. This is up                                                                                                                       The global milk price environment has remained
from our previous guidance of 1.5-3.5 per cent.          Concerning our transformation programme,                 We confirm our year end 2019 net profit share              stable for the first months of the second half of 2019.
The strong first half of 2019 and the continued solid    Calcium, we increase our expectations, and now           outlook of 2.8-3.2 per cent of revenue unless              However, given the inherent volatility of the milk
market momentum in both our European and                 expect to deliver at least EUR 100 million versus our    significant adverse consequences of Brexit affect          markets and the significant price sensitivity to changes
international segment supports this positive             previous guidance of EUR 75-100 million in savings.      our results..                                              in supply and demand we do not provide guidance on
outlook. Higher sales from our “big bet” innovation                                                                                                                          the milk price outlook towards year end 2019.

17    ARLA FOODS      HALF-YEAR REPORT 2019
Our interim consolidated
financial statements
Income statement                                                                                                             Comprehensive income

(EURm)                                                                        Half-year   Half-year   Develop-   Full-year   (EURm)                                                          Half-year   Half-year   Full-year
                                                                                  2019       2018*       ment       2018*                                                                        2019       2018*       2018*

Revenue                                                                           5,232       5,127        2%      10,425    Profit for the period                                                129         120         301
Production costs                                                                 -4,167      -4,083        2%      -8,341
Gross profit                                                                      1,065       1,044        2%       2,084    Other comprehensive income
                                                                                                                             Items that will not be reclassified to the income statement:
Sales and distribution costs                                                      -701        -698         0%      -1,362    Remeasurements of defined benefit schemes                            -41          28          25
Administration costs                                                              -187        -216       -13%        -422    Tax on remeasurements of defined benefit schemes                       9          -5          -6
Other operating income                                                               23          45      -49%         118
Other operating costs                                                               -39         -24       63%          -43   Items that may be reclassified subsequently to the income
Share of results after tax in joint ventures and associates                          14          13        8%           29   statement:
Earnings before interest and tax (EBIT)                                            175         164         7%         404    Value adjustments of hedging instruments                             -22           -7          3
Specification:                                                                                                               Fair value adjustment of certain financial assets                      -1          -2         -3
EBITDA                                                                             382         338        13%         767    Adjustments related to foreign currency translation                     1           2        -10
Depreciation, amortisation and impairment losses                                  -207        -174        19%        -363    Tax on items that may be reclassified to the income statement           -           1         -1
Earnings before interest and tax (EBIT)                                            175         164         7%         404    Other comprehensive income, net of tax                               -54          17           8

Financial income                                                                     13          12        8%            2   Total comprehensive income                                            75         137         309
Financial costs                                                                     -44         -44        0%          -64
Profit before tax                                                                  144         132         9%         342    Allocated as follows:
                                                                                                                             Owners of Arla Foods amba                                             68         131         297
Tax                                                                                 -15         -12       25%          -41   Non-controlling interests                                              7           6          12
Profit for the period                                                              129         120         8%         301    Total                                                                 75         137         309

Non-controlling interests                                                            -7          -5       40%          -11
Arla Foods amba's share of profit for the period                                   122         115         6%         290

* Not restated following implementation of IFRS 16, please refer to page 29

19      ARLA FOODS           HALF-YEAR REPORT 2019
Balance sheet

(EURm)                                                                        Half-year   Half-year   Develop-   Full-year   (EURm)                                                 Half-year   Half-year   Develop-   Full-year
                                                                                  2019       2018*       ment       2018*                                                               2019       2018*       ment       2018*

Assets                                                                                                                       Equity and liabilities
Non-current assets                                                                                                           Equity
Intangible assets                                                                  958         819        17%         887    Common capital                                            1,784       1,815        -1%       1,814
Property, plant, equipment and right of use assets                               2,583       2,246        15%       2,308    Individual capital                                          432         464        -7%         456
Investments in associates and joint ventures                                       453         451         0%         439    Other equity accounts                                      -111          -84       32%          -89
Deferred tax                                                                        55          39        41%          30    Profit for the period                                       122         115         2%            -
Pension assets                                                                       -           -           -          4    Proposed supplementary payment to owners                      -            -          -        290
Other non-current assets                                                            22          25       -12%          29    Equity attributable to the owners of Arla Foods amba      2,227       2,310        -4%       2,471
Total non-current assets                                                         4,071       3,580        14%       3,697    Non-controlling interests                                    53           41       29%           48
                                                                                                                             Total equity                                              2,280       2,351        -3%       2,519
Current assets
Inventory                                                                        1,133       1,126         1%       1,074    Liabilities
Trade receivables                                                                  979         899         9%         989    Non-current liabilities
Derivatives                                                                         37          29        28%          37    Pension liabilities                                         244         227         7%         224
Other receivables                                                                  257         190        35%         254    Provisions                                                   21          14        50%          17
Securities                                                                         454         477        -5%         465    Deferred tax                                                103          57        81%          84
Cash and cash equivalents                                                          115         152       -24%         119    Loans                                                     1,743       1,298        34%       1,369
Total current assets                                                             2,975       2,873         4%       2,938    Total non-current liabilities                             2,111       1,596        32%       1,694

Total assets                                                                     7,046       6,453         9%       6,635    Current liabilities
                                                                                                                             Loans                                                     1,123         986        14%         860
                                                                                                                             Trade and other payables                                  1,130       1,097         3%       1,169
                                                                                                                             Provisions                                                   10           9        11%          11
                                                                                                                             Derivatives                                                 105         123       -15%          85
                                                                                                                             Current tax                                                   5          16       -69%           5
                                                                                                                             Other current liabilities                                   282         275         3%         292
                                                                                                                             Total current liabilities                                 2,655       2,506         6%       2,422

                                                                                                                             Total liabilities                                         4,766       4,102        16%       4,116

                                                                                                                             Total equity and liabilities                              7,046       6,453         9%       6,635

* Not restated following implementation of IFRS 16, please refer to page 29

20      ARLA FOODS           HALF-YEAR REPORT 2019
Equity

                                             Common capital                                         Individual capital                                       Other equity accounts

                                                                                                                                                                                                                                                      Total Equity after
                                                                 special purposes

                                                                                                                                                value adjustment

                                                                                                                                                                                                                                    Non-controlling
                                                                                                                                                                                                                  non-controlling

                                                                                                                                                                                                                                                      non-controlling
                                               Capital account

                                                                                                                                Supplementary
                                                                                                  Delivery-based

                                                                                                                                                                    Reserve for fair
                                                                                                                                                                    value through

                                                                                                                                                                                       adjustments
                                                                                    Contributed

                                                                                                                                                instruments

                                                                                                                                                                                                                  Total before
                                                                                                                                                of hedging
                                                                 Reserve for

                                                                                                                                                Reserve for

                                                                                                                                                                                       Reserve for
                                                                                                  certificates

                                                                                                                                                                                                     the period
                                                                                                                                                                                       exchange
                                                                                    individual

                                                                                                                   individual

                                                                                                                                                                                                     Result for
                                                                                                                                payment

                                                                                                                                                                                                                  interests

                                                                                                                                                                                                                                    interests

                                                                                                                                                                                                                                                      interests
                                                                                                                   Injected

                                                                                                                                                                                       foreign
                                                                                    capital

                                                                                                                   capital
                                                                                                  owner

                                                                                                                                                                    OCI
(EURm)

Equity at 1 January 2019                     928                 886                   222               72           162        290                    -72                 14               -31       -          2,471                 48            2,519
Profit for the period                           -                  -                      -               -             -           -                     -                  -                 -     122            122                  7              129
Other comprehensive income                    -32                  -                      -               -             -           -                   -22                 -1                 1       -             -54                 -               -54
Total comprehensive income                   -32                   -                      -               -             -           -                   -22                 -1                 1     122              68                 7                75
Payments to owners                              -                  -                    -10              -4            -9           -                     -                  -                 -       -             -23                 -               -23
Dividend to non-controlling interests           -                  -                      -               -             -           -                     -                  -                 -       -               -                -2                -2
Supplementary payment related to 2018           -                  -                      -               -             -       -289                      -                  -                 -       -           -289                  -             -289
Foreign exchange adjustments                    2                  -                     -1              -1             1          -1                     -                  -                 -       -               -                 -                 -
Total transactions with owners                  2                  -                   -11               -5            -8       -290                      -                  -                 -       -           -312                 -2             -314
Equity at 30 June 2019                       898                 886                   211               67           154                -              -94                 13               -30     122          2,227                 53            2,280

Equity at 1 January 2018                     895                 886                   243               79           180        127                    -75                 17               -19       -          2,333                 36            2,369
Profit for the period                          -                   -                      -                -             -          -                      -                  -                -     115            115                   5             120
Other comprehensive income                    23                   -                      -                -             -          -                     -7                 -2                2       -              16                  1               17
Total comprehensive income                    23                   -                      -                -             -          -                    -7                 -2                 2     115            131                   6             137
Payments to owners                             -                   -                    -14               -6           -13          -                      -                  -                -       -             -33                  -              -33
Dividend to non-controlling interests          -                   -                      -                -             -          -                      -                  -                -       -               -                 -1               -1
Supplementary payment related to 2017          -                   -                      -                -             -      -121                       -                  -                -       -           -121                   -            -121
Foreign exchange adjustments                  11                   -                     -2               -2            -1         -6                      -                  -                -       -               -                  -                -
Total transactions with owners                11                   -                   -16               -8           -14       -127                       -                  -                -       -           -154                 -1             -155
Equity at 30 June 2018                       929                 886                   227               71           166           -                   -82                 15               -17     115          2,310                 41            2,351

21    ARLA FOODS     HALF-YEAR REPORT 2019
Cash flow

(EURm)                                                                        Half-year   Half-year   Full-year   (EURm)                                                                            Half-year     Half-year     Full-year
                                                                                  2019       2018*       2018*                                                                                          2019         2018*         2018*

EBITDA                                                                             382         338         767    Financing
Reversal of share of results in joint ventures and associates                       -14         -13         -29   Supplementary payment regarding the previous financial year                             -289          -121          -121
Change in net working capital                                                       -76          70          90   Paid in and out from equity regarding individual capital instruments                      -23          -33            -38
Change in other receivables and other current liabilities                             8         -12         -73   Loans obtained, net                                                                      483            98              5
Reversal of other operating items without cash impact                               -51         -18         -43   Repayment of leases debt                                                                  -32            -              -
Dividends received, joint ventures and associates                                     -           1          11   Payment to pension liabilities                                                             -9          -15            -37
Interest paid                                                                       -33         -23         -46   Cash flow from financing activities                                                      130           -71          -191
Interest received                                                                     2           3           1
Taxes paid                                                                          -14         -15         -29   Net cash flow                                                                              -4           59               26
Cash flow from operating activities                                                204         331         649
                                                                                                                  Cash and cash equivalents at 1 January                                                   119            91            91
Investment in intangible fixed assets                                              -22         -25         -55    Exchange rate adjustment of cash funds                                                     -             2             2
Investment in property, plant and equipment                                       -195        -159        -383    Cash and cash equivalents at 30 June                                                     115           152           119
Sale of property, plant and equipment                                               16          12          13
Operating investing activities                                                    -201        -172        -425

Free operating cash flow                                                             3         159         224
                                                                                                                           Cash flow develops in line with expectations

Sale of financial assets                                                            20           -          44
                                                                                                                  Cash flow from operating activities decreased by              A supplementary payment of EUR 289 million
Acquisition of enterprises                                                        -163         -29         -51    EUR 127 million to EUR 204 million compared to EUR            was made in relation to the 2018 profit allocation,
Sale of enterprises                                                                  6           -           -    331 million in the first half of last year. The development   representing a one-time pay-out of the full profit for the
Financial investing activities                                                    -137         -29          -7    is mainly explained by changes in the working capital         year. Further payments amounting to EUR 23 million
                                                                                                                  positions.                                                    were paid out from individual capital, to owners who
Cash flow from investing activities                                               -338        -201        -432                                                                  resigned or retired.
                                                                                                                  Operating investment activities, driven by investments
                                                                                                                  in property, plant and equipment, were higher than the        Cash flow in the period was financed using credit
                                                                                                                  first half of last year. Financial investing activities       facilities. As a result, total cash and cash equivalents
Free cash flow                                                                    -134         130         217    increased to EUR 137 million primarily explained by the       decreased to EUR 115 million, compared to EUR 152
                                                                                                                  acquisition of operations of the Kraft® branded cheese        million at end of last half-year.
                                                                                                                  business in MENA from Mondeléz International and a
                                                                                                                  payment relating to Yeo Valley Dairies Ltd., UK, which        The cash flow has developed as expected and both the
                                                                                                                  were acquired in 2018. Cash flow from investing               leverage and the equity ratio at half year are considered
                                                                                                                  activities was EUR -338 million, compared to EUR -201         to be at a healthy level.
                                                                                                                  million in the first half of last year.

* Not restated following implementation of IFRS 16, please refer to page 29

22      ARLA FOODS           HALF-YEAR REPORT 2019
Revenue

        Continued revenue growth                                                                                               Revenue split by commercial segment,                          Revenue split by commercial segment,
                                                                                                                               Half-year 2019                                                Half-year 2018
Revenue increased by EUR 105 million or 2.0 per cent               Acquisitions attributed to an increase in revenue of EUR
to EUR 5,232 million, compared to EUR 5,127 million in             36 million compared to the first half of last year.
                                                                                                                                               Trading and                                                   Trading and
the first half of last year. The increase was mainly driven                                                                                    other sales                                                   other sales
by higher sales prices. Volume/mix effects increased               Finally, revenue was affected positively by currency
revenue by EUR 10 million.                                         effects of EUR 34 million. For more information on the
                                                                   development of our commercial segments refer to the                               17%                                                           17%
                                                                                                                              Arla Foods                                                    Arla Foods
                                                                   Financial review on page 15.                                                                                             Ingredients
                                                                                                                              Ingredients
                                                                                                                                                                                                             6%

                                                                                                                                                       5,232                                                         5,127
                                                                                                                                               7%

                                                                                                                                                                           60%     Europe                                                    62%    Europe

                                                                                                                                                             MILLION EUR                                     15%           MILLION EUR
                                                                                                                                               16%

                                                                                                                               International                                                 International

Development in revenue                                                                                                         Revenue by commercial segment, Half-year 2019
(EURm)                                                                                                                         (EURm)

5,400

5,300
                                                                                                   34        5,232
                                                                             36
5,200                                      25                 10
                        5,127
5,100                                                                                                                                                Europe                                    Arla Foods Ingredients

5,000

4,900
                                                                                                                                                3,149                                                 352
                                                                                                                                                 HY 2018: 3,197                                       HY 2018: 311

4,800
                      18

                                           s

                                                          x

                                                                           A

                                                                                             cy

                                                                                                           19
                                                           i
                                          e

                                                                          M&
                                                        /m
                                       ric

                                                                                               n
                     20

                                                                                                          20
                                                                                           rre
                                                          e
                                       p

                                                      lum
                   HY

                                                                                                        HY
                                                                                        Cu
                                   les
                                  Sa

                                                   Vo

                                                                                                                                                                           International                                       Trading and other sales

                                                                                                                                                                           839                                                       892
                                                                                                                                                                           HY 2018: 750                                             HY 2018: 869
23      ARLA FOODS        HALF-YEAR REPORT 2019
Costs

        Calcium enabled higher prepaid price                                                                                          Operational costs split by functions                                                      Half-year   Half-year
                                                                                                                                      (EURm)                                                                                        2019        2018
Operational costs amounted to EUR 5,055 million                         Sales and distribution costs increased due to modest
compared to EUR 4,997 million in the first half of last                 increases in salary and distribution costs, offset by lower   Production costs                                                                              4,167      4,083
year, representing an increase of 1.2 per cent.                         marketing spend.                                              Sales and distribution costs                                                                    701        698
                                                                                                                                      Administration costs                                                                            187        216
The cost of production increased to EUR 4,167 million                   Administration costs decreased by EUR 29 million due
                                                                                                                                      Total                                                                                         5,055      4,997
from EUR 4,083 million in first half of last year.                      to savings in 2019 related to the Calcium project as well
                                                                        as 2018 restructuring costs that were not repeated in
Excluding the cost of raw milk, the cost of production                  2019.                                                         Specification:
decreased EUR 57 million to EUR 1,698 million from                                                                                    Weighed-in raw milk                                                                           2,469      2,328
EUR 1,755 million. The strong cost reduction was                        Staff costs decreased to EUR 625 million, compared to         Other production materials*                                                                     930        992
mainly driven by our transformation programme,                          EUR 628 million in the first half of last year. Savings in    Staff costs                                                                                     625        628
Calcium.                                                                our administrative functions more than offset an
                                                                                                                                      Transportation costs                                                                            282        266
                                                                        increase within sales and distribution functions.
The cost related to weighed-in raw milk increased by                                                                                  Marketing costs                                                                                 116        139
EUR 141 million. The prepaid milk price to farmer                       Costs also increased by EUR 29 million as a result of         Depreciation, amortisation and impairment                                                       206        174
owners increased EUR 116 million compared to first half                 aquisitions. Further currency developments led to an          Other costs**                                                                                   427        470
of last year. Cost of other milk increased by EUR 25                    increase in operational costs by EUR 17 million.              Total                                                                                         5,055      4,997
million mainly due to the acquisition of Yeo Valley
Dairies Ltd. in July 2018. The increased milk price
contributed positively due to the revaluation of inventory.                                                                           Average number of full-time employees                                                        19,016     19,207

                                                                                                                                      *Other production materials includes packaging, additives, consumables and changes in inventory
                                                                                                                                      **Other costs mainly includes maintenance, utilities and IT
Development in costs
(EURm)

5,400

5,300
                                                                                                                                      Weighed-in raw milk                                                  Half-year            Half-year
5,200                                                                                                                                 (EURm)                                                                  2019                 2018
                                     141          -40
                                                                 9                -98                                                                                                                Weighed in           Weighed in
5,100
                                                                                            29            17        5,055                                                                               mio. kg      EURm    mio. kg     EURm
                     4,997
5,000
                                                                                                                                      Owner milk                                                          6,332        2,207        6,332      2,091
4,900                                                                                                                                 Other milk                                                            684          262          691        237
                                                                                                                                      Total                                                               7,016        2,469        7,023      2,328
4,800
                   18

                                     t

                                                                x

                                                                                           A

                                                                                                        y

                                                                                                                   19
                                                 ati y

                                                                               l c in
                                    s

                                                              mi

                                                                                                      nc
                                                                                          M&
                                              alu tor
                                 co

                                                    on

                                                                                     ts
                  20

                                                                                                                 20
                                                                             na es
                                                            e/

                                                                                  os

                                                                                                    rre
                                           rev nven
                                lk

                                                                          tio ng
                                                           lum
                HY

                                                                                                               HY
                                                                                                   Cu
                               Mi

                                                                       era ha
                                              I

                                                         Vo

                                                                     op her c
                                                                      Ot

24      ARLA FOODS           HALF-YEAR REPORT 2019
Net working capital

        Net working capital impacted by higher prices                                                                     Net working capital                                      Half-year   Half-year
                                                                                                                          (EURm)                                                       2019        2018
Net working capital increased by EUR 54 million to EUR      We continuously strive to optimise our net working
982 million, which corresponds to an increase of 5.8 per    capital positions through initiatives such as increased use   Inventory                                                    1,133       1,126
cent compared to 30 June 2018.                              of global procurement agreements, optimisation of             Trade receivables                                              979         899
                                                            inventory levels, improved payment terms, as well as          Trade and other payables                                    -1,130      -1,097
Trade receivables increased by EUR 80 million to            utilisation of financing programmes with customer and
                                                                                                                          Net working capital                                            982         928
EUR 979 million as a result of higher sales prices and      suppliers. Utilisation of supply chain finance programmes
timing of customer payments. Provision for expected         were at the same level as 30 June 2018.
losses remains on the same level as 30 June 2018. The
value of the inventory increased as a result of higher
prepaid milk prices, offset by lower volumes. Trade and                                                                   Inventory                                                Half-year   Half-year
other payables increased by EUR 33 million to EUR                                                                         (EURm)                                                       2019        2018
1,130 million.
                                                                                                                          Inventory before write-downs                                1,153       1,153
                                                                                                                          Write-downs                                                    -20         -27
                                                                                                                          Total inventory                                             1,133       1,126

                                                                                                                          Raw materials and consumables                                 275         264
Net working capital                                                                                                       Work in progress                                              349         366
(EURm)                                                                                                                    Finished goods and goods for resale                           509         496
1,500                                                                                                                     Total inventory                                             1,133       1,126
                  1,342
                                                            1,220
                                            1,175                                                      1,141
                                                                                     1,091
1,000
                  1,053                     1,052           1,061
                                                                                                        982               Trade receivables                                        Half-year   Half-year
                                                                                     928
                                                                                                                          (EURm)                                                       2019        2018

 500                                                                                                                      Trade receivables before provision for expected losses        992         911
                HY 2015                 HY 2016            HY 2017                  HY 2018           HY 2019
                                                                                                                          Provision for expected losses                                  -13         -12
 Net working capital excluding owner milk                     Net working capital                                         Total trade receivables                                       979         899

25      ARLA FOODS        HALF-YEAR REPORT 2019
Non-current assets

         Significant investments and implementation of IFRS 16 leases                                                Intangible assets                                                            Half-year   Half-year
                                                                                                                     (EURm)                                                                           2019        2018
The carrying value of non-current assets increased          and right of use assets by EUR 196 million. The level
to EUR 4,071 million compared to EUR 3,580 million          of investments and depreciations related to property,    Goodwill                                                                          679         606
30 June 2018.                                               plant, equipment, and right of use assets increased by   Licenses and trademarks                                                            90          25
                                                            EUR 27 million and EUR 33 million respectively,          IT and development projects                                                       189         188
The level of intangible assets increased by EUR 139         compared to first half of 2018 as a result of IFRS 16
                                                                                                                     Total intangible assets                                                           958         819
million mainly driven by acquisitions and consolidation     implementation.
of Svensk Mjölk in 2018. No impairment of goodwill was
made in the first half-year of 2019.                        The recognised value of associates and joint ventures
                                                            was EUR 453 million compared to EUR 451 million          Property, plant and equipment including right of use assets                  Half-year   Half-year
The carrying value of property, plant and equipment,        30 June 2018. This primarily consist of investments in   (EURm)                                                                           2019       2018*
including right of use assets, increased by EUR 337         Mengniu and LRF. The Group’s proportionate share of
million to EUR 2,583 million. The main drivers for the      the net asset value of COFCO including the investment    Land and buildings                                                                911         824
development were increased CAPEX investments, the           in Mengniu was EUR 327 million, compared to EUR 311
                                                                                                                     Plant and machinery                                                             1,069       1,049
acquisition of operations of the Kraft® branded cheese      million 30 June 2018. The carrying amount of the
business in MENA from Mondeléz International                investment in COFCO includes goodwill amounting to       Fixtures and fittings, tools and equipment                                        205         132
amounting to EUR 46 million and the implementation of       EUR 148 million.                                         Assets in the course of construction                                              398         241
IFRS 16, which increased the property, plant, equipment                                                              Total property, plant and equipment                                             2,583       2,246
                                                                                                                     *
                                                                                                                      Hereof financial leases amounting to EUR 46 million at 30 June 2018

Investments and depreciation property, plant, equipment and right of use assets
(EURm)                                                                                                               Hereof right of use assets                                                   Half-year   Half-year
                                                                                                                     (EURm)                                                                           2019       2018*
250
                                                                                                                     Land and buildings                                                                 93            -
                                                                                                     222             Plant and machinery                                                                24            -
200                                                                                                                  Vehicles, fixtures, fittings, tools and equipment                                  79            -
                                                                                                                     Total right of use assets                                                         196            -
                                                                                                             175
150                     160                                                    161
                150                              148             149                   147
                                       137                                                                           Associates and joint ventures                                                Half-year   Half-year
                                                          116                                                        (EURm)                                                                           2019        2018
100

                                                                                                                     Share of equity in COFCO/Mengniu                                                  179         166
 50                                                                                                                  Goodwill in COFCO/Mengniu                                                         148         145
                                                                                                                     Share of equity in immaterial associates                                           90         102
                                                                                                                     Recognised value, material associates                                             417         413
  0                                                                                                                  Share of equity in non-material joint ventures                                     36          38
                  HY 2015                HY 2016       HY 2017                   HY 2018                 HY 2019
                                                                                                                     Recognised value                                                                  453         451
     Investments property, plant and equipment              Depreciation property, plant and equipment               *Not restated following implementation of IFRS 16, please refer to page 28

26      ARLA FOODS          HALF-YEAR REPORT 2019
Net interest-bearing debt

           Increased net interest-bearing debt                                                                                                                Leverage                                                Leverage

                                                                                                                                                    3.0                                                     2.6
The Group’s financial leverage at half-year was 3.0,                 The maturity profile of debt decreased from 6.0 years
representing an increase of 0.4 compared to first half of            to 4.3 years due to lapse of time and increased debt
last year. Net interest-bearing debt increased as a result           temporarily financed by short term credit facilities.
of, the acquisitions of enterprises, the implementation of           Average interest costs, excluding pensions, was 3.1 per
the new IFRS leases standard and an increase in net                  cent compared to 3.4 per cent in the first half of last year.
working capital. The lease obligations are discounted                The liquidity reserves have been assessed as adequate for                              Half-year 2019                                         Half-year 2018
with the incremental borrowing rate (between 1.75 per                the coming 12 months. After closing Arla has obtained a
cent and 7.5 per cent). Furthermore, increased CAPEX                 new five year loan of EUR 100 million which is not
investments have also increased the net interest-bearing             disclosed in the half year figures 2019.
debt. The net pension liability increased compared to
the first half of last year, due to actuarial losses, payments
to the pension schemes and currency effects.

Net interest-bearing debt                                                                                                            Maturity of net interest-bearing debt excluding        Maturity of net interest-bearing debt excluding
(EURm)                                                                                                                               pension liabilities at 30 June 2019                    pension liabilities at 30 June 2018
                                                                                                                                     (EURm)                                                 (EURm)
3000                                                                                                                            5    600                                                    600
                       310

2500                                                                                                                                 500                                                    500
                                                                                                                244
                                                                                                                                4
                                                                   357
                                                346

2000                                                                                                                                 400                                                    400
                                                                                          227

                                                                                                                                3

1500                                                                                                                                 300                                                    300

                                                                                                                                2
1000                                                                                                                                 200                                                    200

                                                                                                                                1
  500                                                                                                                                100                                                    100
                       2,383

                                                1,949

                                                                   1,972

                                                                                          1,688

                                                                                                                2,311

      0                                                                                                                         0      0                                                      0
                   HY 2015                  HY 2016              HY 2017               HY 2018               HY 2019                        0-1Y 1-2Y 2-3Y 3-4Y 4-5Y 5-6Y 6-7Y 7-10Y >10Y          0-1Y 1-2Y 2-3Y 3-4Y 4-5Y 5-6Y 6-7Y 7-10Y >10Y

       Leverage                                                                                                                         Unused committed facilities                            Unused committed facilities
       Net pension liabilities                                                                                                         Debt                                                  Debt
     	Net interest-bearing debt excluding pension liabilities
       Target range leverage 2.8 - 3.4

27        ARLA FOODS           HALF-YEAR REPORT 2019
You can also read