2019 US Real Estate Market Outlook - HubSpot
←
→
Page content transcription
If your browser does not render page correctly, please read the page content below
2019 US Real Estate Market Outlook
Executive Summary
Much of the research today on the US consumer real estate market illustrates a compelling story of recov-
ery. But after 10 years of economic prosperity, the market is now at a pivotal inflection point. The Federal
Reserve plans to increase interest rates over the next two years, driving up mortgage rates for new home-
buyers across the country. At the same time, more tech-enabled real estate services are gaining a foothold
in a market that was once dominated by full-service agents. What do these changes mean for the growth
of the overall market? How will the influx of digital service providers affect buyer and seller behaviors?
This report aims to provide answers to these questions and discuss four implications that they will have on
the residential real estate market over the next several years.

      1. Housing market will likely enter a “cooling period” over next 2 years
         Growth of total value of homes sold in the US is projected to slow YoY to ~4%, down from 7% annual
         growth since 2009

         Demand for homes is projected to remain flat through 2020 (-0.4% growth), driven by sharp decreases
         in demand in the West and Northeast

         Home prices have been growing ~5.5% per annum (p.a.) since 2012, and are expected to slow to ~4.7%
         p.a., driven by a slow-down in price appreciation in the West

         Inventory levels likely to recover from historical lows; overall composition will continue to be skewed
         toward existing homes

         Housing starts will slow over the next two years from ~7% growth p.a. to ~2% growth p.a., driven by
         the increased cost of construction associated with recent tariffs on Canadian lumber and Chinese goods

         2. Buyers’ and Sellers’ demographics, needs, and behaviors will shift, driven by increased
         share of millennials and the prevalence of technology
         Millennials (≤37 years old as of 2018) are currently the largest segment of the buyer market (~36%)
         and account for ~20% of the seller market; their share in both markets has risen by 4 points (ppts) and 5
         ppts respectively since 2014

         Baby boomers (53-71) are the largest segment of the sellers market (45%) and have been growing
         share, but a massive housing sell-off in the future is not likely to happen

         Both buyers and sellers are increasingly using technology to self-direct more of the buying/selling pro-
         cess vs. using a full-service traditional agent

         3. Affordability will be a key obstacle in the next two years, though looser credit restrictions
         should offset lower demand
         Affordability is currently at its lowest level in 10 years, decreasing ~13% since 2013, putting pressure
         on budget-conscious buyers

         At the same time, credit restrictions have actually loosened in recent years, which should offset a much
         larger negative impact on demand due to higher interest rates

            2019 US Real Estate Market Outlook                                                                       2
Overall, interest rate hikes are projected to increase 30-year Fixed Rate Mortgage (FRM) costs by 160
     basis points through 2020, decreasing total loan value by $200B by 2020, though the majority of the
     decrease will be attributed to refinance originations. Purchase originations will continue to grow, albeit
     at a slower pace (4% vs. 6% historically)

   4. Multi-service tech providers will gain share in the market and offer buyers & sellers more choices

     Three types of tech service providers will gain a stronger foothold in the market relative to traditional
     agents: 1) discount service providers, 2) full-service digital brokers, and 3) iBuyers

     Full-service digital brokers provide buyers and sellers with the highest savings of ~10% lower cost
     relative to traditional brokers

     iBuyers are ~10% more costly for sellers than traditional brokers but offer the convenience of selling
     quickly, without the hassle (e.g., repair costs, closing costs, etc.)

APPENDIX:
   5. Local market analysis – some metro areas are poised to weather the market better than others

   We performed a scorecard analysis, analyzing key market health indicators for the following metro areas:

           CA: SF, San Jose, Sacramento, Fresno, Los Angeles, Orange County, San Diego
           FL: Tampa, Miami, Orlando
           GA: Atlanta
           IL: Chicago
           TX: Dallas, Houston, San Antonio, Austin
           AZ: Phoenix, Tucson
           VA: Northern VA (Washington D.C.), Richmond, Tidewater area (Virginia Beach)

   Dallas and San Francisco are currently the strongest markets, driven by high household income growth, low
   unemployment, and healthy competition between buyers and sellers

           The Dallas market prosperity is driven by local area advantages, such as lower cost of living, lower
           relative taxes, and growth of millennial buyers flocking to the area

           SF metro area has enjoyed years of rapid price appreciation and household income growth (~5%
           p.a. over the past 5 years); sellers on average sell their homes for 3% above asking price, given intense
           buyer competition

     Virginia Beach and Chicago are among the weakest markets, driven by the proportion of underwater
     mortgages, frequency of foreclosure, and slower than average growth in price and demand (in the
     last two years)

           Virginia Beach has the highest % of underwater mortgages in the country (~16.5%), driven by a
           large proportion of homes purchased with zero down payment loans, which has led to significantly
           higher than average delinquencies and foreclosures

           The Chicago metro area has the second highest % of underwater mortgages (~15.7%), primarily
           concentrated in lower-income, impoverished neighborhoods

         2019 US Real Estate Market Outlook                                                                            3
Housing market will enter a
  “cooling period” in next 2 years
A. Consumer housing market has been growing, driven by strong demand and increasing prices
The market has been on a steady recovery path since the 2008 housing crisis. Since 2009, aggregate transaction value for
homes sold in the US totaled about ~$1.8T and has grown ~7% per year. Overall growth has been driven in large part by
a swift recovery in demand for homes (~3%% growth p.a. since 2009 and an increase in median selling price (~5% growth
p.a.). The total market value in 2018 is expected to reach ~$1.9T, implying a YoY growth of ~3%, primarily driven by price
increases (~5.1%) and offset by negative YoY demand growth of -1.7%.

In 2019, overall growth is expected to slow down given further anticipated interest rate hikes. That said, pricing growth
continues to be strong, enabling a modest market growth of ~4% p.a. through 2018 and 2019.

            Exhibit 1-1: Home sales growing steadily at ~7% p.a. from 2009-2017

                                                  Source: US Census Bureau, National Association of Realtors, Home Bay internal estimates

             2019 US Real Estate Market Outlook                                                                                        4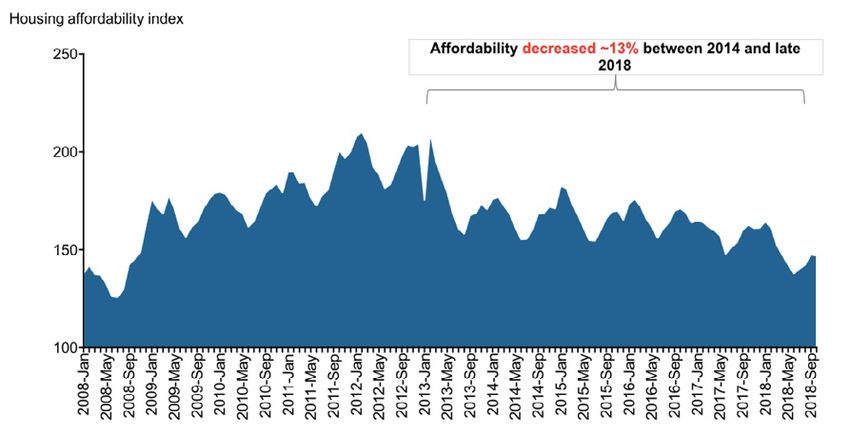
Housing Demand

Housing demand growth from 2009 to 2017 was consistent across all regions of the U.S. In 2018, demand slowed across
all regions, particularly in the West and Northeast, where YoY growth is expected to drop to -4.9% and -4.7% respectively.
According to Redfin, these markets posted double-digit gains in prior years. Rapid price appreciation has slowed growth
in markets such as New York, Denver, San Francisco, and Seattle. Other regions, such as the Midwest and the South, have
yet to see the same slowdown in growth, given that housing is still relatively affordable in these regions.

            Exhibit 1-2:Demand for homes showing slower growth

                                                                          Source: US Census Bureau, National Association of Realtors

            Exhibit 1-3: Slowdown in 2018 demand driven by slowdowns in the West and Northeast

                                                                          Source: US Census Bureau, National Association of Realtors

             2019 US Real Estate Market Outlook                                                                                   5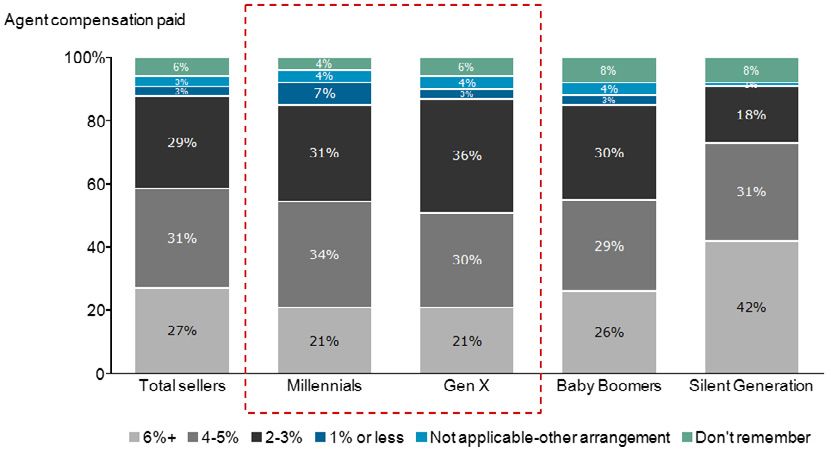
Home Prices

Home prices exhibited even more pronounced demand trends, with growth driven primarily by the West and South regions.
Median selling prices have been steadily growing since 2009, increasing by 3.8% p.a. and have accelerated in recent years
(~6-7% growth in 2017). However, according to Freddie Mac, recent interest rate hikes are expected to temper growth
significantly to 5.1% in 2018 and 4.3% in 2019.

            Exhibit 1-4: Home prices grew by ~5-6%% p.a. on average since 2012, slow-down expected post
            2017

                                                                         Source: US Census Bureau, National Association of Realtors

            Exhibit 1-5: Pricing growth will vary depending on the region, West and South regions expected
            to slow

                                                                                                   Source: US Census Bureau, NAR

              2019 US Real Estate Market Outlook                                                                                 6
B. Inventory levels are rising, signaling a slowdown in demand
The residential real estate market has seen steady inventory decreases of 3.8% p.a. from 2013 to 2017. Housing invento-
ry shortages are symptomatic of the strong price appreciation. Given these trends, market experts expected the summer
of 2018 to be “the most competitive housing market in recorded history,” according to Realtor.com.

However, recent research shows the contrary. Rising inventory levels, following the summer of 2018, provided
long-awaited signals that the housing market is “cooling down.” Inventory is forecasted to rise, post 2018, driven by ad-
ditional new homes on the market. Housing starts have grown significantly in prior years (~7% p.a.), and are forecasted
to continue growing (albeit at a slower rate of ~2%).

The expectation is that this rise, combined with rising interest rates, will likely curb demand through 2019.

            Exhibit 1-6A: Inventory levels and month of supply expected to rise in 2018

                                                                                                  Source: NAR, US Census Bureau

            Exhibit 1-6B: Housing start growth expected to slow through 2020 after rapid growth in sin-
            gle-family homes

                                                                                                                  Source: NAHB

             2019 US Real Estate Market Outlook                                                                              7
C. Recent tariff increases on Canadian lumber and Chinese goods will likely strain pricing and housing starts

Canadian lumber has been a source of US-Canadian dispute for the past two decades, primarily because Canadian firms
sell lumber into the US at highly subsidized rates, cutting out US lumber producers in the process. In April of 2017, the
US imposed a ~20% anti-subsidy tariff on imported Canadian lumber in an effort to promote competition. Given that Ca-
nadian lumber accounts for 40% of US lumber imports, the construction industry has been hit hard by the tariffs. Accord-
ing to the National Association of Home Builders (NAHB), the average cost of building a home has increased on average
~$8K-10K since the tariffs have been imposed — a price increase that would contribute to rising new home prices and
decreased demand.

And, unfortunately, the news only gets worse for the residential construction industry. A recent 10% tariff on $200B of
Chinese goods will likely increase residential construction costs by an additional ~$10B overall, according to the NAHB.
These goods include imported cement, granite, ceramic tiles, iron/steel, and other basic building materials, which are vital
to new home construction and home renovation.

Overall, it appears that recent tariffs have worked against the real estate sector, though historically high demand has
softened the direct blow of higher input costs for now. A forecasted cooldown in the industry would be exacerbated by
further planned tariffs.

            Exhibit 1-7: Post Canadian lumber tariffs, month-over-month average cost of constructing a new
            home has increased by ~$8K-$10K

                                                                                                Source: NAHB, US Census Bureau

             2019 US Real Estate Market Outlook                                                                             8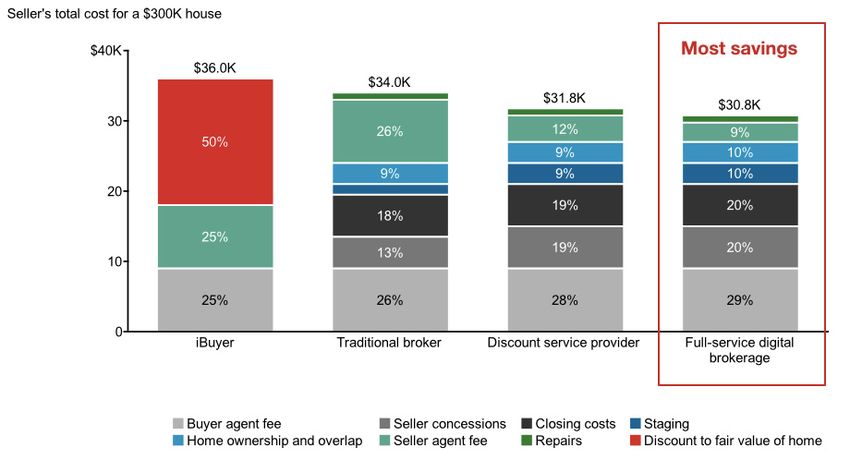
D. Imminent increases in interest rates likely to slow market growth over the next two years

The Federal Reserve expects to increase the federal funds rate twice more in 2019 to reach approximately 3.0%. The
federal funds rate is the benchmark by which other important interest rates (e.g., mortgage rates) are determined. If the
federal funds rate increases, so do others.

Empirically, it has been hard to correlate how interest rates affect the performance of the residential real estate mar-
ket. Over the past 30 years, there have been about six periods of significant interest rate hikes. In all of these instances,
mortgage rates increased accordingly, leading to a reduction of mortgage originations, home sales, and housing starts. In
none of these periods, however, did rate hikes temper growth in aggregate real estate sales. Price appreciation remained
strong during those times, enabling the market to squeeze out a ~2% price increase.

After the first few interest rate hikes in 2018 in June and September, it appears that home sales have not been materially
affected (beyond seasonal effects), but it is too early to tell.

According to estimates by Freddie Mac, the increase in interests rates will actually have a net negative effect on home
price appreciation through to 2020F but will not slow down home sales. Thus, the market should still benefit from contin-
ued growth, albeit slower, compared to prior years.

            Exhibit 1-8: Increases in federal interest rate likely to drive down home price appreciation but not
            affect demand

                                                                                                             Source: Freddie Mac

              2019 US Real Estate Market Outlook                                                                              9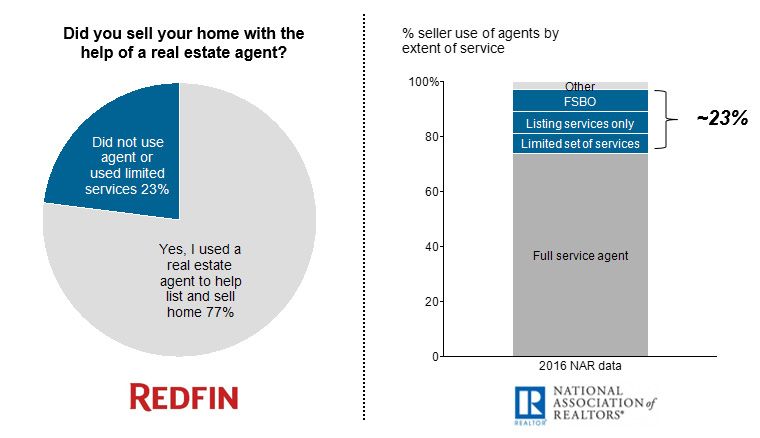
Home Buyers
A. Among homebuyers, millennials are the largest segment and
will grow share
                                                                                   Buyers’ and Sellers’
Today, the average homebuyer is about 44 years old. However, a deeper              demographics, needs,
dive into the population of homebuyers reveals interesting buying trends
within specific age groups. Millennial home buyers (37 years old or young-         and behaviors will shift,
er in 2018) appear to be the largest share of homebuyers in the market             driven by increased
(~36%), and this share is increasing over time (+4 ppts since 2014).               share of millennials and
This insight runs contrary to the popular belief that millennials are destined
                                                                                   the prevalence of
to be “generation renters,” given fears of another recession, furthering ed-       technology
ucation, and student loans. Instead, older millennials are beginning to have
children and are now viewing a home investment as an important way to
grow their nest egg.

            Exhibit 2-1: Share of Millennial home buyers has increased by 4 percentage points since 2014

                                                                                                                Source: NAR
B. Buyers value the use of technology from their real-estate brokerage partners
Cost of purchasing is not the only concern that is top of mind for buyers in today’s market. Receiving value-added services
and quality service are key concerns as well. With the rise of real estate technology and innovations, buyers have grown to
expect more from agents, especially if they are expected to pay lofty fees.

For example, a recent survey conducted by Owners.com found that homebuyers want their agents to use more technolo-
gy throughout the process. The survey sampled more than 1,000 recent homebuyers (defined as those who purchased a
home within the last 4 years). The conclusion: 36% of recent homebuyers wished their agent leveraged more technology
tools. Buyer responses indicated three primary agent activities they’d prefer to do through technology or a mobile app: 1)
keep track of appointments (46%), 2) schedule viewings online (42%), and 3) manage all communications through a mobile
app (30%).

              2019 US Real Estate Market Outlook                                                                         10
Exhibit 2-2: Activities that homebuyers would like to conduct through technology with their agent
Source: Owners.com
Among agents and brokerages that do leverage the use of technology, buyers have indicated higher satisfaction levels, and
higher satisfaction isn’t always linked to cost savings.
According to a survey conducted by Redfin in 2015, both homebuyers and home sellers believe that agents who use tech-
nology are more efficient (60%), higher quality (58%), and more cost-effective (~30%). The results indicate that buyers
value and expect speed and quality from their agents as well, putting market pressure on real estate service providers
across the spectrum to differentiate.
Exhibit 2-3: Home buyers value the use of technology in the home purchasing process
Source: Redfin
2019 US Real Estate Market Outlook 11C. Homebuyers are increasingly using the internet to perform parts of the homebuying process themselves
Today, about 13% of home buyers elect to purchase their home without the help of an agent, and this share has remained
steady over time. However, recent research indicates that while buyers still prefer to use an agent in the process, they are
increasingly starting to perform parts of the homebuying process themselves.
According to NAR, 95% of today’s buyers use the internet in search of their first home, a ~15% increase over the past de-
cade. Further, of those buyers who used the internet to find their homes, about 90% reported finding their homes through
an online website (in tandem with their agent), whereas only 40% found their home exclusively with an agent.
These findings suggest that digital channels are enabling homebuyers today to increasingly become more independent of
their agent, performing parts of the process that agents used to do on behalf of buyers in the past (e.g., finding a home).
However, most buyers still prefer to use the internet as a complement to their agent, rather than a substitute. In fact, ac-
cording to Zillow, those who used both online resources and agent assistance in tandem reported being more satisfied with
the overall process.
Exhibit 2-4: 95% of buyers use the internet in their home search process
Source: NAR
Exhibit 2-5: 90% of buyers who used the internet found their eventual house through the internet
Source: NAR
2019 US Real Estate Market Outlook 12Home Sellers
A. Among sellers, millennials and baby boomers are growing share
Millennials are also a growing share as sellers, increasing from just 15% of all sellers in 2014 to 20% in 2017. While
younger Millennials are purchasing their first homes, older ones are beginning to sell their starter homes and purchase
their second. This high turnover is driven by the fact that, according to a recent NAR report on Home Buyers and Sellers,
millennials have the shortest expected tenure in the homes that they purchased (~10 years), compared to ~20 years for
baby boomers.
Exhibit 2-6: Share of Millennial and Young Boomers home sellers has been increasing over time
Source: NAR
Millennials are not the only segment that appears to be growing share amongst sellers. Baby boomers (ages 53-71)
grew overall share of the sellers market from 41% of the market in 2016 to 45% in 2017 (combining both young and old
boomers). Today, more Baby boomers are starting to become empty nesters and are beginning to downsize their current
homes for smaller ones (a decrease of ~100 square feet on average).
2019 US Real Estate Market Outlook 13Exhibit 2-7: Baby boomers are more likely to sell off their homes for smaller ones
Source: NAR
B. Massive baby boomer sell-off not likely in the next few years
Baby boomers will comprise the largest population of retirees over the next several years. And while baby boomers have
indeed grown share as sellers over the last year, an anticipated “massive sell-off” as the boomers enter retirement age is
not materializing and likely won’t occur over the next several years.
According to a recent survey by Realtor.com, 85% of baby boomers indicated that they are not planning to sell their
home in the next year. This trend has materialized gradually over the years, as median seller tenure in their previous home
has increased from 6 years to 10 years since 2008.
According to Trulia, this is being driven by the fact that baby boomers are working for a longer period of time, and are
thus entering the “retirement age” later. Another driver of this trend is that baby boomers seem to be parenting older, and
longer, driving a need to hold onto larger houses.
These factors considered, a massive sell-off from the boomers may likely be on the horizon, given recent inventory short-
ages, but a sell-off will likely not happen in the immediate future.
Exhibit 2-8 85% of baby boomers are unlikely to sell their home in the next year
Source: Realtor.com
2019 US Real Estate Market Outlook 14Exhibit 2-9: Median seller tenure in previous home has increased from 6 years to 10 years
Source: NAR
C. Self-directed selling is more prevalent than the industry thinks
Given rising home prices and the increasing importance of technology, should we expect to see an increase in sellers tack-
ling the process on their own? The answer depends on who you ask. Currently, there is no consensus on the true percent-
age of buyers and sellers who do not use an agent in their transactions.
Self-directed transactions are defined as buyers and sellers using limited services of an agent or not using an agent at all
(e.g. for-sale-by-owner (FSBO), limited service agencies).
For home sellers, NAR states that for-sale-by-owner transactions have been on the decline in recent years, dipping as
low as 8% (from a high of 21% in 1981). NAR cites the challenges of selling without an agent as too great given the cost-
tradeoffs with having an agent. Redfin and Zillow, however, have found through consumer surveys that the percentage of
FSBO is hovering around 10-13% of all sellers. The difference may be driven by how NAR defines “FSBO transactions,”
which classifies any sale involving an agent, even if the agent provided limited services (e.g., just listing), as “non-FSBO.”
Exhibit 2-10: No consensus on % of sellers who do not use an agent in the selling process
Source: 2018 Home Buyer and Seller Generational Trends Report (NAR), 2018 Consumer
Housing Trends Report (Zillow), 2015 Homebuyer and Seller Survey (Redfin)
2019 US Real Estate Market Outlook 15However, there is consensus on the share of sellers who self-direct their process, According to both NAR and Redfin,
~23% of sellers elect to self-direct their process. And it appears that this percentage has been increasing over the last
two years. According to a recent NAR survey on Home Buyers and Sellers, the percentage of sellers using limited ser-
vices has increased from 23% to 24% over last year, driven by more sellers using agents to only list their house for sale,
while the seller handled the rest of the work themselves..
Exhibit 2-11: 23% of sellers use limited services of an agent, according to both Redfin and NAR
Source: Redfin, NAR
Exhibit 2-12: Percentage of sellers using limited services has gone up slightly, driven by more
sellers using an agent to list their homes only
Source: NAR
2019 US Real Estate Market Outlook 16Affordability will continue to be a
key obstacle for buyers and sellers
A. Affordability is at its lowest in 10 years, motivating both buyers and sellers to reduce costs where they can
Home affordability has been decreasing. Strong price appreciation for several years has consistently outpaced median
wage growth. To provide some perspective, home prices have been increasing by ~4% on average each year. At the same
time, median household income for the average homebuyer has increased around ~2%. Compounded yearly effects have
eroded the affordability gains by ~13% since 2014.
Exhibit 3-1: Affordability has decreased by ~13% since 2014 driven by rising prices
Source: NAR
Decreased affordability can impact multiple market participants. Price-sensitive buyers are especially impacted, forcing
them to seek every opportunity to cut down on the costs associated with purchasing a home, if they decide to purchase at
all.
B. The traditional costs of buying and selling a home are deteriorating
Buyers
For buyers, there are two primary costs associated with purchasing a home: 1) the downpayment for the house and 2)
closing fees. Typically, the conventional buyer puts down ~20% of the value of the home as an upfront payment. Closing
fees can cost anywhere from 2-5% of the overall cost of the house. Given that housing prices have increased much faster
than the median income of a buyer (~4% vs. ~2%), this means that in today’s market, the total out-of-pocket cost of buying
a ~$300K house can be as much as $71K on average, or ~80% of total income, compared to just ~70% in 2014.
2019 US Real Estate Market Outlook 17Exhibit 3-2: Buyer costs have increased from 69% of median income to nearly 80% of median
income over the last 4 years
Source: Open Door, Home Bay internal analysis
Sellers
There are a multitude of costs associated with selling a house, the largest of which is the agent fee (5-6% of sales price).
Other costs include staging (~1%), seller concessions (e.g., costs of negotiating) (~2%), additional repairs to the house
(~$1K), home ownership and overlap costs (e.g., living elsewhere while home is being sold: ~1%), and closing costs (~2%).
Assuming the same house is being sold as in the prior scenario, total seller costs can reach as much as $37K, or 37% of
median household income for the average seller, +5-6 ppts higher than in 2014.
Exhibit 3-3: Seller costs have increased from 32% of median income to nearly 37% of median
income over the last 4 years
Source: Open Door
2019 US Real Estate Market Outlook 18C. Awareness of rising costs amongst buyers and sellers Do buyers and sellers feel the pain of rising costs? Recent consumer research indicates that buyers and sellers are split. Buyers While the price of purchasing a home has been increasing by ~4% per year, demand has grown steadily in tandem, im- plying that buyers are still prioritizing purchasing a home. And according to NAR, despite rising home prices, buyers do not seem to be substituting to lower-cost homes. In 2015, homes that sold for over $300K made up ~30% of the market. Today, that share has increased to ~34%. Conversely, at the lower end of the market, homes
Exhibit 3-5: Agent compensation paid by age group

                                                                        Source: Zillow Consumer Housing Trends Report 2016

D. Interest rate hikes will lead to a sharp decrease in refinance mortgage originations over the next 2
years, and purchase originations growth will slow

In November 2018, Freddie Mac released a revised outlook on mortgage originations until 2020. The conclu-
sion was clear — planned interest rate hikes over the next two years will decrease total mortgage originations
by ~$200B. However, nearly all of the decrease will be attributed to a drop in refinance mortgages.

Refinance originations are, unsurprisingly, expected to decrease by ~27% in the midst of interest rate hikes.
With rates still relatively low, most homeowners will hold off on refinancing their mortgages until rates come
back down or stabilize.

However, purchase originations growth is expected to continue, albeit slower, to 4% p.a. through 2020, down
from 6% p.a. through 2017. This growth is in line with overall house price appreciation, implying that overall
demand for mortgages on newly purchased homes is likely to slow but not be significantly affected by interest
rate hikes. This expectation is also in line with how consumers are feeling about interest rates. According to a
recent consumer sentiment survey by Redfin, 32% of consumers would slow their search if interest rates were
to rise above 5%, but the overall impact on home-buying plans would not change significantly.

            2019 US Real Estate Market Outlook                                                                          20
Exhibit 3-6: Mortgage originations projected to decrease by 4% p.a. over the next 4 years, driven
by a sharp decrease in refinancing mortgages
Source: Mortgage Bankers Association, Freddie Mac
Exhibit 3-7: 32% of buyers will likely slow down search if rates were to increase above 5%
Source: Redfin
2019 US Real Estate Market Outlook 21E. Credit eligibility has expanded recently, which should offset the negative demand effects of higher
interest rates
Although rates are rising, homebuyers shouldn’t have to worry about tightening credit requirements in the near future.
Fannie Mae and Freddie Mac have actually loosened restrictions over the past few years, making it easier for homebuyers
to borrow. The following outlines a few recent changes:
Both agencies allow borrowers to finance up to 97% of a home’s purchase price (a high loan-to-value
ratio by all comparisons)
In May 2017, Fannie Mae increased its maximum DTI (debt-to-income) ratio to 50%, up from 45%
Some conventional lenders (e.g., non-government-sponsored) have rolled out new “low down-payment
programs” without private mortgage insurance in exchange for higher interest rates
The nation’s major credit rating agencies (Equifax, TransUnion, and Experian), will drop tax liens and civil
judgments from consumer profiles if information is incomplete, thereby raising FICO scores
While requirements today are still might tighter than they were prior to 2008, these laxer requirements should provide
homebuyers with some confidence over the next two years despite rising interest rates.
F. Options for first time buyers
For buyers anxious about the current lending environment, there are many programs that offer financial assistance for
first-time buyers and help allay concerns. The table below includes some of the largest federal programs for buyers who
are purchasing or remodeling a home:
2019 US Real Estate Market Outlook 22Federal programs and grants for first-time buyers
Name
Name Description
Description Cost
Cost Requirements
Requirements
FHA loan • Mortgage is insured by the Fed- • 3.5-10% down • FICO score > 580
eral Housing Administration payment
• Popular with first-time buyers
USDA loan • Program focused on homes in • No down pay- • FICO score >640
certain rural areas ment required • Add’l documenta-
• Loan guaranteed by the US tion required for
Dept. of Agriculture lower scores
VA loan • Program for active-duty mili- • Competitive • Minimum credit
tary members, veterans, and interest rates score of 500
surviving spouses • No down pay-
• The VA guarantees part of the ment
loan
Good • Program for law enforcement, • Discount pro- • Must be in a “revi-
Neighbor firefighters, emergency med gram talization area” to
Next Door technicians, and teachers qualify (see pro-
• Discount of up to 50% on a gram’s website)
home
Fannie Mae • Government sponsored enti- • As low as 3% • Varies
or Freddie ties, focused on low & moder- down payment
Mac ate income families
Energy-ef- • Designed to help homeown- • Varies • Only for home-
ficient ers make improvements to owners making
mortgage home that are environmentally “environmentally
(EEM) friendly friendly improve-
ments”
FHA Sec- • Designed for remodels, • As low as 3% • Varies
tion 203(k) down payment
Native • For Native American Veter- • No down pay- • Varies
American ans and their spouses to buy ment required
Direct Loan homes on Federal Trust Lands • 30-year fixed
(VA is the lender) rates
Local
grants and • Varies by state and city – visit www.hud.gov to learn more about local options
programs
Source: Bankrate
2019 US Real Estate Market Outlook 23Multi-service tech providers will gain
share in the market and offer
buyers & sellers more options
A. Digital engagement is on the rise, giving foothold to real estate tech disruptors
Digital channels, tools, and platforms have become ubiquitous in the industry, as buyers and sellers have adopted more
technology in their quest for more information and access.
According to Statista, there are approximately 2.5 billion smartphone users worldwide, and this number is growing every
year. Embracing the power of mobile apps has become necessary in almost every consumer-facing business, and real es-
tate is no exception. With the rise of real estate technology giants such as Zillow and Redfin, mobile has become a critical
channel in a market continually being disrupted by new technology and changing consumer behaviors.
Exhibit 4-1: Zillow mobile app usage has skyrocketed since 2015
Source: DMR
Reliable data on mobile app trends are still in their infancy, but preliminary findings shows that real estate mobile app
downloads are skyrocketing. Zillow’s mobile app is regarded as the gold standard in the industry, and its app user growth
is a testament to that reputation. From 2015 to 2018, Zillow’s mobile app user growth has averaged ~30% p.a., bringing
its total user count to 188M as of 2018. Other real estate companies across the spectrum will need to solve for mobile if
they don’t want to be left behind.
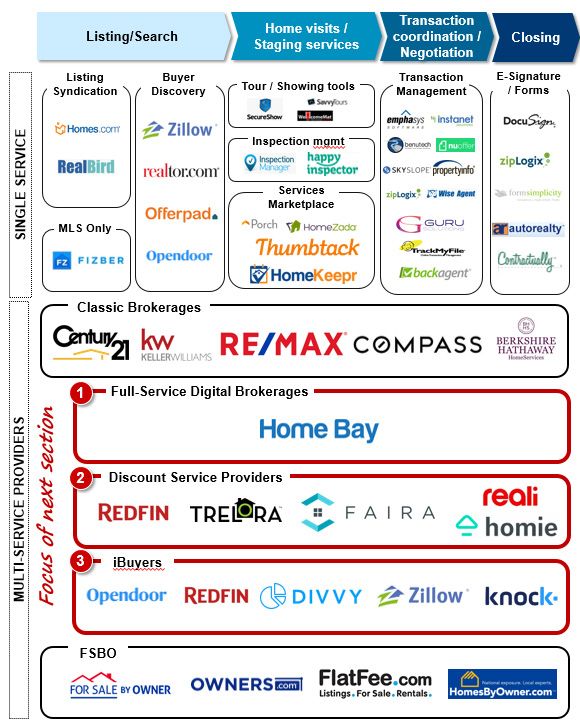
2019 US Real Estate Market Outlook 24B. Three types of tech players have entered the market giving both buyers and sellers more choice — 1)
discount service providers, 2) tech-enabled providers, and 3) iBuyers
The real estate market landscape is vast and expanding rapidly each year, and so are the options for both buyers and
sellers. There are countless ways to survey the industry, but the most comprehensive method would be to look at today’s
offerings at each stage of the buyer and seller journey.
While the classic brokerage firm could be relied upon to accompany the buyer and seller through all stages, today there are
a multitude of industry specialists who own a discrete part of the value chain. Should a buyer or seller want to venture off
on their own, they could customize their own journey by choosing from an “a la carte menu” of real estate service providers.
At the same time, buyers and sellers want to keep the process as simple as possible, given how complex and taxing it is
already. Thus, three new types of multi-service providers are gaining a foothold in the market, all vying for the opportunity
to unseat the classic brokerage model.
Full-Service Digital Brokerages
These firms differ from the traditional broker in that all interactions between their agent and customers are con-
ducted completely digitally. Full-service digital brokers offer customers the choice to customize their journey so
that they only pay for services that really need. Full-service digital brokerages typically charge their customers a
fixed percentage or flat selling fees, or typically issue refunds (at a fixed percentage of commission) to buyers.
Discount Service Providers (DSPs)
As with traditional brokerages, discount service providers rely upon agents in the field to guide the buyer and
seller through their journeys. They create value by leveraging technology to increase the efficiency of their
agents, while passing on savings to their customers. DSPs typically charge a flat fee to customers selling their
homes or a discounted commission percentage. For buyers, they typically issue a rebate on the buyer’s commis-
sion they receive. DSPs are different from full-service digital brokerages in that they have in field agents, which
enables them to meet with customers in-person.
iBuyers
These companies will make quick cash offers on homes (within minutes or days) based on a proprietary valu-
ation model. If the seller chooses to accept the price, they can sell and close in as little as a couple of days. The
seller is typically charged full commission, and there is usually a built-in discount to the fair value of the home —
a cost that comes from the “liquidity premium” of selling a home for cash quickly.
2019 US Real Estate Market Outlook 25Exhibit 4-2: Real Estate Market Landscape
Buyer & Seller Journey
2019 US Real Estate Market Outlook 26Exhibit 4-3: Overall cost comparison between different brokerage models (% indicate percent-
age of price of home)
Traditional Bro- Full-Service Digi- Discount Service iBuyer(3)
ker tal Brokerage(1) Provider(2)
Price of home $300K $300K $300K $300K
Buyer economics
Down payment 20% 20% 20% 20%
Closing cost 2.5% 2.5% 2.5% 2.5%
Refund 0% -1.5% -1.0% 0%
Total out of pocket cost 22.5% 21.0% 21.5% 22.5%
(% of house)
Seller economics
Buyer agent fee 3.0% 3.0%
3.0%
3.0%
Seller agent fee 3.0% ~1% 1.25% 3.0%
Staging 0.5% 1.0% 1.0% 0.0%
Seller concessions 1.5% 2.0% 2.0% 0.0%
Repairs $1K (0.3%) $1K (0.3%) $1K (0.3%) $0
Home transition/overlap 1.0% 1.0% 1.0% 0.0%
Closing costs 2.0% 2.0% 2.0% 0.0%
Discount on home 0.0% 0.0% 0.0% 6.0%
Total out of pocket cost 11.3% 10.3% 10.6% 12.0%
(% of house)
Source: NAR, Open Door, Home Bay, Redfin, Trelora websites
1. Buyer and seller pricing from Home Bay website
2. Uses both Redfin and Trelora buyer and seller
models, currently assumes fixed fee model (Trelora)
3. Discount on fair value determined through lit search
2019 US Real Estate Market Outlook 27C. Full-service digital brokerages can provide anywhere from 7%-14% of savings off total out-of-pocket
costs for both buyers and sellers
For an average priced house of ~$300K, full-service digital brokerages provide the highest level of savings on average vs.
DSPs, but both provide a 7-14% lower cost when compared to traditional brokers.
DSPs vs. full-service digital brokerages
For buyers, the biggest source of savings comes from the commission rebate that many companies have incorporated
into their pricing structure. DSPs (e.g., Redfin, Trelora), and full-service digital brokerages (e.g., Home Bay), will offer to
pass on up to 50% of their buyers commissions to the buyer as an incentive to buy through their platform. Small nuances
in this rebate (e.g., fixed percentage of commission vs. excess of $3K in commissions goes to the buyer) can very well
change the economics.
Comparing models currently on the market, full-service digital brokerages provide the most savings to the buyer, driven
by an average rebate of about ~1.5% of the price of the home (~50% of the buyer agent fee), which is slightly higher
than the ~1-1.5% rebate for DSPs.
DSPs who elect to refund in excess of a certain amount of commissions(e.g., Trelora) provide more savings at higher
home values, though this model is less prevalent.
Exhibit 4-4: Full-service digital brokerages provide the most savings to buyers
Source: Home Bay internal estimates
For sellers, the biggest source of savings comes from lower sellers fees that full-service digital brokerages and DSPs
charge. Typically, a seller would have to pay 1-1.5% in sellers agent commissions vs. the standard 3% that would be paid
to a traditional broker. Full-service digital brokerages currently offer the most savings on average, charging about a 1%
total sellers fee, while DSPs charge about a 1.25% fee. This difference results in about $1K higher savings using full-ser-
vice digital brokerages, assuming a house priced at ~$300K.
2019 US Real Estate Market Outlook 28Exhibit 4-5: Full-service digital brokerages provide the highest level of savings for sellers
Source: Home Bay internal estimates
iBuyers
iBuyers are the most expensive option for sellers, primarily driven by the expected discounted offers they are likely to
receive on their homes. The average discount on the fair value of a home will depend on current regional market condi-
tions, but current research indicates that it can be anywhere from a 5-7% discount and up to 30% for highly distressed
assets (e.g., when a home is in disrepair). This amount would effectively double the buyer’s and seller’s commission that
sellers would still be expected to pay. However, sellers using this model wouldn’t have to pay any of the additional costs
typically associated with selling a home (e.g., staging, repairs, closing costs, etc.). Sellers who choose to utilize iBuyers are
typically those who value a quick and painless process versus getting the best price.
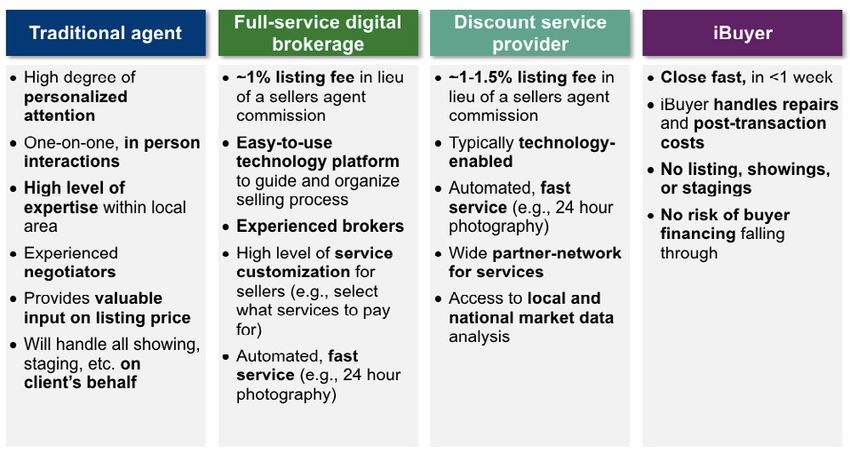
2019 US Real Estate Market Outlook 29Which one is best?
The main takeaway here is that there is no single “one-size-fits-all” model (see exhibit 4-7). For buyers and sellers who
care about cost, customization, and access to a full range of services, full-service digital brokers and DSPs are certainly
cheaper alternatives than traditional brokers. For those who value more personal, face-to-face interactions with a broker,
then a traditional broker may be the best option. iBuyers provide the most convenience for sellers who value a quick and
painless process. Buyers and sellers should think carefully about what resources and support they need in their journey
and choose the provider that best addresses those needs. Despite what market challenges lay ahead, there is one certain
upside in today’s market — buyers and sellers have more choice than they did years ago.
Exhibit 4-6:Key benefits for sellers within each brokerage model
2019 US Real Estate Market Outlook 30Appendix:
Local markets deep dive – some are likely to weather the storm better than other
Market Health Sales Activity Inventory
Current Market % of mortgag- Buyer (10) vs. 13-18 Growth 13-18 Growth Monthly inven-
Health Index (1 es that are Seller market in Home sales in Median Price tory growth
to 10) underwater (0)
LA
LA // Orange
Orange
County
County 8.00 4.7% 4.19 -0.3% 7.0% -2.2%
Chicago 0.55 15.5% 9.49 5.4% 7.4% -2.4%
Dallas 9.95 0.0% 5.00 2.6% 10.2% -2.0%
Houston 5.47 0.0% 7.67 5.6% 7.6% -0.8%
Northern VA 1.75 11.3% 5.73 3.6% 3.3% 5.1%
Miami 9.05 8.7% 8.02 -0.5% 7.5% -0.8%
Atlanta 7.05 9.9% 2.52 -6.4% 8.3% 0.4%
San Francisco 9.84 3.1% 0.40 0.5% 4.8% -1.9%
Phoenix 6.96 8.7% 4.27 3.0% 6.4% -1.1%
San Diego 8.43 5.3% 5.80 -0.3% 7.5% -4.0%
Tampa 9.08 7.5% 8.95 4.4% 8.8% -5.1%
San Antonio 4.14 0.0% 5.97 3.1% 6.2% -3.3%
Orlando 8.55 7.8% 8.60 7.5% 8.6% -0.3%
Austin 8.46 0.0% 5.81 2.0% 6.0% 3.7%
Tidewater area 0.14 16.7% 6.77 5.2% 3.2% -2.6%
Richmond, VA 1.88 9.1% 5.25 6.9% 7.3% N/A
Tucson, AZ 2.80 10.7% 3.36 5.7% 5.1% -9.7%
Fresno, CA 3.68 10.5% 4.06 3.5% 6.1% 6.5%
National aver-
age 5.0 7.8% 5.4 5.0% 5.3% --5%
Source: Zillow, US Census Bureau, NAR
2019 US Real Estate Market Outlook 31Local Market Deep Dive:
Chicago (1 of 2)
Chicago rated among the lowest in Zillow’s Market Health Index
for 2018. There are 3 key factors that land Chicago near the bot-
tom of the list across US metro areas.
Slowing price appreciation and sales
Home sales have grown since 2013 (~5.4% p.a.) but have slowed
significantly over the last two years, growing at ~0.6% and 0.4%
respectively. Home price appreciation has grown since 2013 but
has slowed in recent years (from ~7% per year to 2.4% per year.
High % of underwater mortgages
One key factor affecting home sales is affordability of current
homes. Chicago residents have more underwater mortgages than
any other US city. An underwater mortgage is a mortgage with a
higher principal than the free-market value of the home. Accord-
ing to Gord Collins, ~250K homes in Chicago have underwater
mortgages, which is ~16.6% of homeowners in the metro area.
A market that is heavily in the buyer’s favor
With a Buyer-Seller Index score of 9.49, the Chicago market favors buyers significantly more than sellers. That is because
the average sales-list price ratio in Chicago is about 96%, meaning that buyers get an average discount to fair value of
about 4%, which is lower than the national average of ~2%.
That said, housing demand is not skyrocketing, driven mainly by the affordability challenges in the market. Many sellers are
not selling, even if they wanted to.
2019 Forecast
In 2019, home sales are projected to fall as much as ~7.4% and median sale price is projected to decrease by ~1.9%,
according to a new forecast from Realtor.com. This places Chicago near the bottom of the list relative to other metro
areas.
Affordability is the primary reason why market hardships may affect Chicago more than others. While higher mortgage
rates and a decrease in the federal deduction for property taxes will affect the entire market, Chicago will likely feel the
brunt of it given its already high taxes (e.g., Chicago levies the highest statutory tax rate on 10 of the 24 “everyday taxes
and fees” according to illinoispolicy.org), and amount of high value homes. That said, this outlook is not bad news for
everyone. The market will continue being a buyer’s market, and buyers may want to invest now.
2019 US Real Estate Market Outlook 32Local Market Deep Dive:
Chicago (2 of 2)
2019 US Real Estate Market Outlook 33Local Market Deep Dive:
Tidewater Area (1 of 2)
The Tidewater area, which includes Virginia Beach, Norfolk, and
Chesapeake, had a Zillow Market Health Index score of 0.14
(14th percentile). Here’s why:
Underwater mortgages
At 16.7%, the Virginia Beach metro area has one of the highest
proportions of homeowners with underwater mortgages.
The primary driver of this statistic stems from the demographic
in the metro area. Hampton Roads is home to one of the world’s
largest populations of military personnel, many of whom would
qualify for zero down payment VA loans. Driven by the risk as-
sociated with VA Loans, the Department of Veteran Affairs has
created a “Compromise Sale Program” designed to help military
personnel recover from underwater mortgages. It is essentially a
short sale program that covers the resulting mortgage debt after
a sale.
Inventory
While inventory levels have risen throughout 2018, the supply of homes in the Virginia Beach metro area dropped in
2017 by 6% and the final 2018 figures appear likely to show an even steeper drop of ~10%. The toll of supply shortages
affected demand negatively in 2018, registering a drop in estimated home sales of ~5-6%.
2019 Forecast
Strained inventory levels will likely put more pressure on new home construction, resulting in sharp expected increases in
average price. The median price is likely to increase this year by ~4% despite a nearly 10% drop in overall demand.
Lower inventory levels, however, can be a good thing for sellers in the market. With less competition, rising prices, and
a higher supply of buyers, sellers may be able to find good deals on their homes. These conditions may actually tip the
scales even more slightly to suppliers in a market that has historically been weighted in the favor of buyers.
2019 US Real Estate Market Outlook 34Local Market Deep Dive:
Tidewater Area (2 of 2)
2019 US Real Estate Market Outlook 35Local Market Deep Dive:
Dallas (1 of 2)
With a score of 9.95, the Dallas metro area comes in near the top
of all metros when it comes to local real estate health. There are
three primary explanations for this:
1) low unemployment, 2) high income growth, and 3) low taxes
Dallas currently enjoys a lower than average 3-3.5% unemploy-
ment rate and a steady ~3-4% p.a. growth in household income.
The underlying market prosperity, combined with the low cost
of living, low cost of doing business, and tax efficiency are a few
local reasons why the Dallas market has remained strong. Af-
fordability hasn’t reached the same levels of concern in Dallas as
it has in other parts of the country. Consumers have more confi-
dence in investing and are reaping the benefits.
Strong market fundamentals
Home sales have continued to exhibit strong five-year growth, growing around ~3% per year over the last five years.
Prices have increased steadily as well, growing at ~10% p.a. Mortgage payments as a percentage of total household
income sits around ~16%, a 5 ppts increase over where it was five years ago, but still below the national average of 18%.
Healthy competition between buyers and sellers
Dallas’ Buyer-Seller index score sits at a balanced 5, indicating that neither buyers nor sellers have the upperhand in the
market. Typically this is driven by an equilibrium between demand and supply for houses on the market and healthy com-
petition for homes. Sales-to-list price (the % of list price that homes are typically sold at) ratio sits squarely around 98%
which is in line with the national average, and it has remained steady over the last several years.
2019 Forecast
The story will only likely get better for Dallas, as more millennials are participating in the market, increasing demand
despite forecasted softening elsewhere across the country. “The growth in population is skewed towards younger folks
in Dallas,” Mitch Roschelle,” partner at PwC, said. “The growth in the 0 to 24 age category is high and in the 25 to 40
category. The population is becoming younger, and those people are all workers in the future.
2019 US Real Estate Market Outlook 36Local Market Deep Dive:
Dallas (2 of 2)
2019 US Real Estate Market Outlook 37Local Market Deep Dive:
San Francisco (1 of 2)
With a score of 9.84, the SF metro area also comes in near the
top of all metros when it comes to local real estate health. There
are three primary explanations for this:
Buyer competition is intense
Buyers are flocking to the Bay Area in droves. With a Buyer-Seller
Index score of 0.4, it’s a great time be a seller in the market, with
booming demand. The sale-to-list price ratio of a home is 1.03,
meaning that sellers typically benefit from bidding wars between
multiple buyers for a home.
Strong household income growth, low unemployment
The median household income in the SF metro area is about $103K,
and the area is among the most affluent metros in the country.
At the same time, income growth has been increasing steadily as
well, growing at ~5.5% over the last 5 years. The current unem-
ployment rate of 2.1% sits far below the national average of 4%.
Skyrocketing home prices
Home prices in the Bay Area continue to exceed prices. Median prices have grown by ~5% on average per year, with
some sub-areas exhibiting YoY price growth of close to ~9-10%.
2019 Forecast
Despite increasing prices, economists anticipate that San Francisco may be showing signs of softness and cooling in the
next few years as demand begins to taper off. Rapid price growth, according to economists from Zillow, is not sustainable
over the long term, and the overheating that has been seen in San Francisco typically cools off. This already seems to
bear true, as final data for 2018 will likely show demand fell by ~5%, and it will likely continue falling through 2019. This
does not mean, however, that prices will decrease. Bay Area prices will likely continue to grow, albeit at a slightly slower
rate than we’ve seen historically.
2019 US Real Estate Market Outlook 38Local Market Deep Dive:
San Francisco (2 of 2)
2019 US Real Estate Market Outlook 39You can also read