DEFENDING GROWTH AT ALL COSTS - 2020-21: Global Economic Outlook Economic, Capital Markets and Industry Research - Allianz

Page created by Jeanette Miles
 
CONTINUE READING
DEFENDING GROWTH AT ALL COSTS - 2020-21: Global Economic Outlook Economic, Capital Markets and Industry Research - Allianz
2020-21:
DEFENDING
GROWTH AT ALL
COSTS
Economic, Capital Markets
and Industry Research

Global Economic Outlook
as of January 2020

© Copyright Allianz
DEFENDING GROWTH AT ALL COSTS - 2020-21: Global Economic Outlook Economic, Capital Markets and Industry Research - Allianz
LESSONS LEARNED FROM 2019
1. US-China rivalry escalated at a rapid pace
   The US average import tariff increased from 3.5% in 2018 to close to 8% in 2019. Lessons learned: a continuation of very high uncertainty,
   at least until the 2020 election. While tariffs shaved -0.2pp off global GDP growth, we estimate the annual cost of uncertainty at -0.3pp of
   global GDP growth. China has prioritized economic transformation over stabilization, with measured stimulus. Lessons learned: The global
   economy will have to rely less on Chinese policy action to support growth.

2. Environmental focused regulations had global repercussions
   The regulatory shock in the automotive sector has almost pushed Germany into recession and had global repercussions. Major climate
   events (fires in the US, Brazil and Australia) occur at more frequent pace. Concomitantly, the new European Commission announced a
   Green Deal that will include a Just Transition Mechanism worth EUR100bn. Lessons learned: The implementation of new green and ESG
   policies has started to bite companies, with further adjustments to be seen and new initiatives to support energy transition.

3. (Geo)political and social risk has soared
   Increasing inequality over the past decade and high fiscal pressures on households have resulted in outbreaks of social crisis in several
   countries. Unexpected protests escalated across regions, such as Hong Kong, several countries in Latam (Chile, Colombia), and France.
   Geopolitical tensions also prevailed in the Middle East, particularly between Saudi Arabia and Iran. Lessons learned: A more reactive and
   redistributive fiscal policy is to be expected to respond to growing social tension. The pace of structural reforms will slow down amid growing
   reform fatigue.

4. Monetary policy has come to the rescue and helped avoid a broad-based recession
      Monetary policy’s reaction to the external shock was swift and sizeable in 2019. The number of central banks initiating a monetary policy
      easing has reached a record high since 2009. Both the Fed and the ECB did not hesitate to increase the use of unconventional monetary
      policy tools to inject liquidity while cutting interest rates further. Lessons learned: The protracted usage of unconventional monetary policy
© Copyright Allianz                                                                                                                                2
      tools has pushed interest rates into negative territory. Efficiency is put to the test.
KEY TICKET ITEMS FOR 2020
1.       Global economic growth to remain muted in 2021-21 after bottoming out at the turn of 2019

2.       US-China trade tensions should not escalate, nor de-escalate much further in 2020

3.       The US to further explore higher public and corporate debt when face with electoral uncertainty

4.       The global economy cannot rely on a new Chinese bazooka stimulus

5.       Eurozone growth below potential at +1.0% and +1.3% in 2020-21 respectively

6.       Monetary policy is the safety net for growth and markets. Mind negative spillovers

7.       Persistently high social discontent will call for fiscal policies to become more redistributive

8.       Domestic sectors will continue to outperform

9.       (Unusually) low volatility and correlation between asset classes for longer

10. A -4% depreciation of the Dollar depreciation is expected to support Emerging Markets assets
© Copyright Allianz                                                                                        3
BUSINESS CONFIDENCE IS IMPROVING FROM LOW
LEVELS THANKS TO MONETARY EASING
       World Manufacturing PMI vs net number of Central                                       Global M2
              Banks cutting rates, 10-month lag                    (incl. Eurozone, China, United States, Japan, South Korea, Australia)

      Sources: Markit, Bloomberg, Euler Hermes, Allianz Research   Sources: Bloomberg, Euler Hermes, Allianz Research
       The cycle of monetary policy easing continued               Global monetary impulse rebounded above LT
       in Q4 2019 which should boost activity in H1                average in October 2019, but more needs to be
       2020. We expect one rate cut in March 2020 in               done to boost growth above its current levels.
       the US and one by the ECB in April.
© Copyright Allianz                                                                                                                        4
GLOBAL TRADE: DON’T SELL THE BEAR’S SKIN
BEFORE KILLING IT
 World trade in goods and services, growth in volume and                                      Share of Total U.S. imports coming from China,
                      value (%, y/y)                                                               comparison between tariff tranches
 15%                                                                                     100%
                      Volume       Price           Value
                                                                                                                                        Tranche           86%
                                                 9,9%                                     90%
                                                                                                                                        initially to be
 10%
                                                         9,2%                             80%                                           imposed on
                                                                                                                                        Dec.. 15

                                                                                                                                                                Consumer goods
                                                                                          70%
   5%      3,3% 3,9%                                                2,3%
                          2,9% 2,5%                                              4,5%     60%
                  2,8%                     5,7% 3,7%       1,2%
                       2,0%                                                      2,5%
                                                                                          50%
   0%
                                         -1,7%                   -1,7%1,8%                40%

  -5%                                                                                     30%                                                24%
                                                                                                                              21%
                                                                                          20%                    13%
                                                                                                     7%
-10%                            -10,3%                                                    10%
                                                                                            0%
                                                                                                  Tranche 1 Tranche 2 Tranche 3 Tranche 4 a Tranche 4b
-15%
                                                                                                 (USD34bn) (USD16bn) (USD200bn) (USD 116bn) (USD 160bn)
             13       14   15     16       17       18     19e     20f     21f
Sources: IHS, Euler Hermes, Allianz Research                                            Sources: Bloomberg, Euler Hermes, Allianz Research

Trade growth could bottom out but not significantly                                     U.S.-China mini-deal not a game changer, only
accelerate in 2020 (+1.8%), in 2021 higher demand                                       superficial. But tariff escalation unlikely: (i) 86% of goods
should lift trade (+2.5%) amid a lasting trade feud but                                 in tranche 4b come from China (i.e. no substitution
no significant U.S.-China escalation.                                                   possible); (ii) consumer goods would see biggest
© Copyright Allianz                                                                     increases in tariff coverage; (iii) 2020 US election                                     5
GLOBAL GROWTH RECOVERING BUT CAPPED BY
UNCERTAINTY
                      World GDP, quarterly growth, y/y                                                  World GDP, annual growth
                                                                                                           2016              2017              2018      2019   2020   2021

                                                                  World GDP growth                          2.7               3.3                  3.1   2.5    2.4    2.8
                                                                  United States                             1.6               2.4                  2.9   2.3    1.6    2.0

                                                                  Latin America                             -1.1              1.0                  1.0   0.0    1.1    2.0
                                                                  Brazil                                    -3.3              1.3                  1.3   1.1    2.0    2.5

                                                                  United Kingdom                            1.9               1.8                  1.4   1.2    1.0    1.6
                                                                  Eurozone members                          1.7               2.7                  1.9   1.2    1.0    1.3
                                                                  Germany                                   2.1               2.8                  1.5   0.6    0.6    1.1
                                                                  France                                    1.0               2.4                  1.7   1.2    1.2    1.4
                                                                  Italy                                     1.4               1.8                  0.7   0.1    0.4    0.8
                                                                  Spain                                     3.0               2.9                  2.4   2.0    1.6    1.4

                                                                  Russia                                    0.3               1.6                  2.3   1.1    1.3    1.5
                                                                  Turkey                                    3.2               7.5                  2.8   0.1    2.3    3.5
                                                                  Asia                                      5.0               5.3                  4.9   4.4    4.4    4.6
                                                                  China                                     6.7               6.9                  6.6   6.2    5.9    5.8
                                                                  Japan                                     0.6               1.9                  0.8   0.8    0.9    1.6
                                                                  India                                     8.1               7.1                  6.8   5.2    6.0    6.2
                                                                  Middle East                               4.9               1.2                  1.1   0.5    2.1    3.1
                                                                  Saudi Arabia                              1.7               -0.7                 2.4   0.4    1.2    2.0
                                                                  Africa                                    1.2               3.2                  2.7   1.9    1.8    2.7
                                                                  South Africa                              0.6               1.4                  0.8   0.3    0.0    0.7

                                                                  * Weights in glob al GDP at market price, 2019
                                                                  NB: The revisions refer to the changes in our forecasts since the last quarter
                                                                  Fiscal year for India

    Sources: National sources, Euler Hermes, Allianz Research   Sources: National sources, Euler Hermes, Allianz Research

    The trough in global growth is expected in Q4 2019          Global GDP growth should go back to 2016 levels in
    due to the US, China and Japan, followed by                 2021 supported by very accommodative monetary
    moderate growth in the absence of a fiscal and              policies and higher fiscal support, notably from China
    monetary bazooka                                            and the US
© Copyright Allianz                                                                                                                                                           6
GLOBAL POLITICAL LANDSCAPE
                                                                  Elections in Europe
               Trade tensions China/US                            Feb 2020: Slovakia (Smer-SD expected to win), Italian regional
               Trade feud: Phase 1-deal not                       election in Emilia Romagna and Calabria
               a game changer, phase 2                            Dec 2020: Romania (Liberals expected to win)
               issues much harder to solve.                       Sept/Oct 2021: Germany (CDU/Greens coalition expected to win                         Key Summits
               No significant U.S.-China                          with higher public investment for greening the economy)                              G7: June 10-12, 2020
               escalation or improvement.                         Sep 2021: Russia Duma (United Russia expected to win)                                G20: November 21-22, 2020
                                                                  Oct 2021: Czechia (ANO expected to win without a majority)
                                                                  Nov 2021: Bulgaria (GERB expected to win)
             November 03, 2020
             US presidential election
             Predicted outcome:
             55% Democrats win                                                                                                                         Elections in Asia
             45% Republicans win                                                                                                                       Jan 2020: Taiwan (Tsai expected to be re-elected)
                 (Trump re-election)                                                                                                                   Apr 2020: South Korea (governing Democratic
                                                                                                                                                       party expected to win)
                                                                                                                                                       Sep 2020: HK (risk for governing pro-Beijing parties
                                                                                                                                                       to lose, given ongoing pro-democracy protests)
Latin America unrests                                                                                                                                  By April 2021: Singapore (governing PAP expected
-   Bolivia: high risk for companies, tensions remain with                                                                                             to win)
    clashes between pro and anti Morales                                                                                                               Oct 2021: Japan (governing LDP expected to win)
-   Brazil: October 2020 local elections (challenging for
    Bolsonaro’s new party), risk of social tensions with public
    sector reform
-   Chile: April 2020 (referendum on Constitution), October                                                                        Middle East main tension points
    2020 (local elections and potential election of                                                                                Large scale anti-government protests in Lebanon, Iraq and Iran
    constitutional convention). Expect more social protests +            Elections in Africa                                       -   Iran: impact of US withdrawal from JCPOA and new US
    uncertain business environment                                       Oct 2020: Morocco (PJD expected status-quo with               sanctions, as well as potential counter measures.
-   Colombia: protests against pro-business reforms. Recent              poor majority and delayed entry into office)                  Parliamentary election in February as a potential source of
    constitutional blow to tax reform should hamper                      Oct 2020: Ivory Coast (Ouattara expected to be re-            geopolitical tension
    confidence and delay reforms. Risk is increasing.                    elected but with political instability)                   -   Lebanon: political uncertainties and potential new proxy war
-   Ecuador: mass protests triggered by the decision to scrap            Nov 2020: Burkina Faso (Kaboré expected to be                 between Saudi and Iran
    fuel subsidies, which was overturned. Future IMF                     re-elected but with period of political paralysis)        -   Yemen: Sunni v. Shia
    disbursements at risk                                                Nov 2020: Egypt (status quo to be expected)               -   Saudi vs. Iran, incl. Straits of Hormuz, revisited
-   Peru (January 2020): early parliamentary elections after             Dec 2020: Ghana (either incumbent Nana Akufo-             -   Qatar vs. Saudi Arabia, UAE, Bahrain, Egypt (blockade)
    President                                                            Addo or former president John Mahama to win)              -   Israel: impact of Jerusalem recognition by the US
     © Copyrightdissolved
                 Allianz Congress. No clear majority. Expect                                                                       -   Turkey: US sanctions                                         7
    delay in reforms + policy instability                                 Source: Euler Hermes, Allianz Research
MONETARY POLICY WILL REMAIN THE SAFETY NET
FOR GROWTH AND MARKETS
                       Fed funds rate vs. ECB deposit rate (%)                                Fed vs ECB balance sheet
                                                                                6                     Fed       ECB                6

                                                                 USD trillion

                                                                                                                                       EUR trillion
                                                                                5                                                  5

                                                                                4                                                  4

                                                                                3                                                  3

                                                                                2                                                  2

                                                                                1                                                  1

                                                                                0                                                  0
                                                                                    05   08   11        14       17      20   23

Sources: IHS, Allianz Research

 © Copyright Allianz
LIMITED UPSIDE POTENTIAL FROM FISCAL POLICY
          Taxes – companies vs households (OECD average)                          Fiscal balance, % of GDP

        Sources: OECD, Euler Hermes, Allianz Research        Sources: National sources, Euler Hermes, Allianz Research

        There is a higher potential to support              Most fiscal stimulus will come under the form of higher social
        households (and consumption) given the              and infrastructure spending. Europe announced EUR100bn
        trends in corporate vs personal income taxes        allocated for the Green Deal (0.8% of GDP). The fiscal
        since the last crisis and rise in social tensions   impulse will be more positive in 2021 as the US will spend
© Copyright Allianz                                         more and China will maintain its efforts of stabilization. 9
WHAT DOES IT MEAN FOR COMPANIES? MORE
  LEVERAGE, WEAKER PROFITABILITY
  Bank interest rates – growth differential, %     Non-financial corporations’ debt (NFC),                    Company profits, y/y
                                                            % of GDP, Q2 2019

Sources: Euler Hermes, Allianz Research          Sources: BIS, Euler Hermes, Allianz Research   Sources: Euler Hermes, Allianz Research

In the short-term, the fall in interest rate     …but over the medium-term, credit              Below long-term average corporate
growth differential has opened the door          risks remain elevated given the high           margins and too limited pricing power
for more sustainable debt financing…             corporate debt levels                          given the prolonged weakness of
                                                                                                demand, increase liquidity risk for
  © Copyright Allianz                                                                           companies in the medium run         10
GLOBAL INSOLVENCIES: ON THE RISE
                      EH Global and Regional Insolvency Indices                            EH regional Insolvency Indices
                                Yearly changes in %                                        Contribution to the Global Index

    Sources: national statistics, Euler Hermes, Allianz Research   Sources: national statistics, Euler Hermes , Allianz Research

The upside trend in global insolvencies, as measured by our Global Insolvency Index, is confirmed for 2019 (+9%) with still a
noticeable increase in Asia and Latam. We expect this trend to continue in 2020, for the 4th consecutive year, mainly due to
the prolonged weakness of demand. The easing of global monetary and financial conditions will contribute to limit the pace of
the increase, but the rise will remain broad-based with a rise across all regions and a majority of countries (4 out of 5).
© Copyright Allianz                                                                                                                11
WHAT DOES IT MEAN FOR MARKETS? AN OVERVIEW
                                                             2020   2021
                      EMU
                                Policy rate (deposit rate)   -0.6   -0.6
                                10y Bund                     -0.1   0.1

                                10y Swap                     0.2    0.3

                                Corporate IG spread (bp)     100    105

                                MSCI EMU (TR, % p.a.)        3.1    4.8

                      USA
                                Policy rate                  1.25   1.50

                                10y UST                      1.9    2.3

                                Corporate IG spread (bp)     120    130

                                MSCI USA (TR, % p.a.)        2.1    2.0
                        Source: Allianz Research

© Copyright Allianz                                                        12
GLOBAL ECONOMY: DOWNSIDE AND UPSIDE RISKS
                                                                 High
                                                                                60%

                                                                                      Partial rollback of
                                                                                        existing U.S.
                      Escalation in        Oil price                                        tariffs
                      global trade          shock
                                                   Longer                       40%

                                                                   Likelihood
                        dispute                  manufacturing
                                                  recession                                                              Moratorium on trade
                         Emerging market                                                                                   protectionism
                           debt crisis
                                                      HK                                                             Large fiscal
                                                                                30%
                                      US credit     spillover                                                        stimulus in
                        Equity market
                                        event                                                                       China / Europe
                          correction
                                  Major central                                                       Large FTAs
             Climate            bank policy error                                                     (EU-China /
           change crisis                                                                               EU-USA)         Global
                                              Trump       No Deal               10%                                  Green Deal
          Chinese debt                    impeachment Brexit
              crisis                                                                                                      Major technological
                       Italexit                                                 5%
      High                                                        Low                                                         innovation          High

      Negative                                          Medium-term economic impact                                                    Positive
© Copyright Allianz                                                                                                                                      13
UNITED STATES

01
© Copyright Allianz
US: PROVING MORE RESILIENT
                                US Real GDP index                                              Contribution to growth (pp)

   650

                                                                1961-1970
   550

   450

   350                                                       1982-1990

   250                                1949-1953
                                           1975-1980
                                       1991-2001 2001-2008
   150

    50
          1           20   40    60    80    100       120    140    160

  Sources: Bloomberg, Euler Hermes, Allianz Research                        Sources: Bloomberg, Euler Hermes, Allianz Research

  We are now in the longest cycle of expansion in the                       The labor market proved more resilient than
  US. This is also the slowest, suggesting stronger                         expected and the monetary policy turned more
  footing for this cycle. We expect 2% of growth in                         expansionary than initially thought. This reduced the
  2021 compared with 1.6% in 2020 and 2.3% in 2019                          probability of recession in H1 2020.
© Copyright Allianz                                                                                                                 15
US: FISCAL SUPPORT TO INCREASE AFTER THE
ELECTIONS
                       Long-term fiscal projections (USD trillion)                       Long-term projections on fiscal deficit (% of GDP)
     12                                                                      12     4                                                                  4
                                   Public exp. Warren / Sanders
                                   Public rev. Warren / Sanders                                   Warren / Sanders         Trump         Biden
                                                                                    2                                                                  2
     10                            Public exp. Biden                         10
                                   Public rev. Biden
                                   Public exp. Trump                                0                                                                  0
      8                            Public rev. Trump                         8
                                                                                   -2                                                                  -2

      6                                                                      6     -4                                                                  -4

                                                                                   -6                                                                  -6
      4                                                                      4
                                                                                   -8                                                                  -8
      2                                                                      2
                                                                                  -10                                                                  -10

      0                                                                      0    -12                                                                  -12
          98      01     04   07    10     13    16    19     22   25   28              00   03     06    09    12   15     18     21   24   27   30
    Sources: Bloomberg, Euler Hermes, Allianz Research                            Sources: Bloomberg, Euler Hermes, Allianz Research

    Biden is much less aggressive in terms of tax hikes for                       A too liberal approach of fiscal approach would
    companies and wealthy people. He only intends to rise                         endanger the US debt sustainability. We expect a
    this amount of tax by USD 3.4 trillion compared with                          Democrat win (55% probability), albeit with a trajectory
    USD 30 trillion for Warren and Sanders                                        close to Biden’s proposal as any new US Democrat
© Copyright Allianz                                                               President would have to compose with the Congress                          16
US: GROWTH WILL BE INCREASINGLY DOMESTIC
DRIVEN
30-year mortgage rates vs average hourly                  US profits and GDP growth (%, y/y)                       Investment in the US (%, y/y)
            earnings growth

Sources: Bloomberg, Euler Hermes, Allianz Research   Sources: Bloomberg, Euler Hermes, Allianz Research   Sources: Bloomberg, Euler Hermes, Allianz Research

The Fed will explore lower levels of                   The global shock on trade impairs                  US investment, except residential
unemployment rates. This will boost                    profits of US large companies, which               investment, is badly oriented, even if
wage growth and contribute via low                     have large exposure to foreign                     the stabilization of external conditions
interest rates to stronger demand in                   demand                                             will bring some support
residential
© Copyright Allianz investment                                                                                                                                 17
US: THE TRUMP FACTOR TO BE AT WORK
              Impeachment and President Trump’s popularity                       Trump Anger index is constructed in function of S&P
                                                                             performance (-), USD appreciation (+) and the approval rate
      5000                                                              45                              (-)
                         Number of times "impeachment is mentioned in
                                                                             2500                                                       100
                         Bloomberg articles, LHS
                                                                        44                                    Trump tariff index, LHS
                         President Trump approval rate, %, RHS                                                                          75
      4000                                                                                                    Trump Anger Index, RHS
                                                                        43   2000
                                                                                                                                        50
                                                                        42
      3000                                                                                                                              25
                                                                             1500
                                                                        41
                                                                                                                                        0
      2000
                                                                        40   1000                                                       -25
                                                                        39
                                                                                                                                        -50
      1000                                                                    500
                                                                        38                                                              -75

           0                                                            37      0                                                       -100
           02-17 06-17 10-17 02-18 06-18 10-18 02-19 06-19 10-19                12-17           06-18           12-18           06-19
               Sources: HIS, Bloomberg, Allianz Research                     Sources: HIS, Bloomberg, Allianz Research

             The impeachment procedure does not seem to                          Times of higher anger correspond with more
             have any influence on President Trump’s                             frequent tariffs threats triggering a strong
             approval rate for now. However, it can open                         correction in equity markets
             Pandora’s box by increasing Trump’s Anger Index
© Copyright Allianz                                                                                                                            18
US 10Y YIELDS: A CAUTIOUS NORMALIZATION
5%                        10Y US Gov. Bond
                                                                                             • Our base line scenario shows a continuous climb from
                          In Sample Estimate
                                                                                               current levels to a fundamental upper-range of 2.3% at the
                          Out-of-sample Estimate                                               end of 2021.
4%                        +/- 1 std. dev.
                           Base line scenario
                          Muddle through (55%)                                               • At 2.3% by the end of 2021 long-term UST yields will be
                                                                                               between fair value and slightly overvalued.
3%
                                                                                             • 10y UST yields are expected to remain roaming below our
                                                                                               fundamental fair value estimate (1.9%) before the 2020
                                                                                               elections to be followed by long slow climb on the back of
2%                                                                                             subdued future but positive economic optimism and
                                                                                               reanchored inflation expectations.

1%                                                                                           • The base line path finishes the forecasting timeframe 2021
                                                                                               with a steeper yield curve that should however reverse in
                                                                                               afterwards.

0%
  2011                2013                2015     2017           2019               2021
                                                      Sources: Refinitiv, Allianz Research

 Model’s standard deviation: 50 - 60bps

 Allianz Research – Capital Markets Research
 © Copyright Allianz   21-Jan-20                                                                                                                            19
US 10Y YIELDS: CENTRAL BANK IN THE DRIVING SEAT
       12m changes in valuation components (bps)                                                Market – based Inflation Expectations
bps                                   Inflation Expectations
300
                                      1y ahead monetary policy expectations
                                      Model Residual
200

100

  0

-100

-200

-300
       2008         2010            2012        2014        2016           2018          2020
                                                       Sources: Refinitiv, Allianz Research                                                     Sources: Refinitiv, Allianz Research

                                                                                                   Our proprietary model of market-based inflation expectations shows that
 Since the beginning of 2015 changes in UST long-term yields (represented
                                                                                                   the upside potential of inflation expectations is limited (50bps). As
 by our fundamental model residual), can be explained by a mix between
                                                                                                   current fundamental inflation valuations show that at 1.6% long-term
 changes in inflation expectations and changes in monetary policy
                                                                                                   inflation expectations are correctly priced-in, if were markets to start
 expectations. Currently, changes in monetary policy expectations are of
                                                                                                   discounting a sizeable fiscal stimulus (reflation), the upside potential in
 upmost importance in the determination of long-term UST yields.
                                                                                                   the inflation component of long-term US yields would be capped at ~2%.
  Allianz Research – Capital Markets Research
  © Copyright Allianz   21-Jan-20                                                                                                                                                      20
US IG: POSTPONING THE CREDIT RERISKING
bps
                                                               US IG Corporate Index (OAS**)
700                                                                                                    • US investment grade corporates are expected to
                                                                                                         remain anchored around current levels (100-
                                                               Muddle  through
                                                                Base line      (55%)
                                                                          scenario
                                                                                                         120bps) in 2020 as a combination of a dovish Fed
600                                                                                                      and the proximity of the US presidential elections
                                                                                                         should not grant a free ticket for markets to take
500                                                                                                      strong positions.

400
                                                                                                       • The slow structural widening in investment grade
                                                                                                         corporate spreads within the 2020/2021 time span
                                                                                                         is fueled by the beginning of a mild corporate risk
300                                                                                                      repricing as a direct consequence of the implied
                                                                                                         shift of the ongoing discussion on corporate debt
200                                                                                                      sustainability.

                                                                                                       • Importantly, our base linescenario is based on the
100
                                                                                                         empirical fact that the Fed stops hiking when credit
                                                                                                         spreads are rapidly widening.
 0
      1996      1999        2002        2005        2008       2011      2014       2017       2020
                                                                Sources: Refinitiv, Allianz Research

 ** Index: ICE Bank Of America United States Corporate Index
 IG: Investment grade ; OAS: Option Adjusted Sprea
  Allianz Research – Capital Markets Research
  © Copyright Allianz    21-Jan-20                                                                                                                              21
US IG: UNDERESTIMATING CORPORATE CREDIT RISK
   12m changes in spreads model                                                       Underestimated US corporate credit risk

                                               Sources: Bloomberg, Allianz Research                                             Sources: Bloomberg, Allianz Research
Our proprietary corporate spreads model shows no much room for                         By looking at the US corporate debt level consistent with the current
narrower spreads in 2020 and extremely muted widening forces over the                  interest to EBITDA ratio it is clear that US corporate debt is being
forecasting period. The combination of the muted widening potential with               massively underestimated. This non-negligible imbalance may well be a
the Fed’s prescribed hiking path limits the fundamental implied re-risking             source of extreme downside risk beyond 2023 with no clear sign of a
of corporate spreads in the 2020-2023 timespan.                                        circuit break mechanism that would alleviate this US credit event.

 Allianz Research – Capital Markets Research
 © Copyright Allianz   21-Jan-20                                                                                                                                  22
MSCI USA: PLEASE DON’T STOP THE MUSIC
                 MSCI USA TOTAL RETURN (in EUR)
                                                                                    • Trade war remains unsolved and investors
  16000                                                                      1
                                                                                      temperamental on trade news
                                                                             0,9
  14000
                                                                                    • Mini-cycle: earnings growth forecasts will likely to be
                                                                             0,8      revised down
  12000
                                                                             0,7
                                                                                    • Equities further fueled by share buybacks and financed
  10000                                                                               by cheap debt
                                                                             0,6

    8000                                                                     0,5    • Yield hunting attracts more investors
                                                                             0,4
    6000                                                                            • The sugar rush from the fiscal stimulus fades away
                                                                             0,3
    4000                                                                            • The volatility may occur within a year
                                                            Recessions
                                                                              0,2
                                                            In Sample
    2000                                                    Actual                  • Democrat president might reverse Tax Cuts and Jobs
                                                                              0,1
                                                            Muddle
                                                            Base    through
                                                                 line  scenario
                                                                                      Act of 2017
         0                                                                   0
          1999        2002   2005      2008   2011   2014   2017   2020

Sources: Refinitiv, Allianz Research

© Copyright Allianz                                                                                                                             23
CHEAP DEBT AND SHARE BUYBACKS – FUEL FOR
THE MARKET
               USA: Net Debt to EBITDA                             EMU: Net Debt To EBITDA                                EM: Net Debt to EBITDA
2,50                                                 1800   3,50                                           1800   2,50                                          1800
                                                     1600                                                  1600   2,25                                          1600
2,25                                                        3,00
                                                     1400                                                  1400   2,00                                          1400
                                                            2,50                                                  1,75
2,00                                                 1200                                                  1200                                                 1200
                                                            2,00                                                  1,50
                                                     1000                                                  1000                                                 1000
1,75                                                                                                              1,25
                                                     800    1,50                                           800                                                  800
                                                                                                                  1,00
1,50                                                 600                                                   600    0,75                                          600
                                                            1,00
                                                     400                                                   400    0,50                                          400
1,25                                                        0,50                                           200                                                  200
                                                     200                                                          0,25
                                                            0,00                                           0      0,00                                          0
1,00                                                 0

                                                                                                                         Recessions
              Recessions                                           Recessions
              Net Debt to EBITDA Non-Financials (L.H.S)                                                                  Net Debt to EBITDA Non-Financials (L.H.S)
                                                                   Net Debt to EBITDA Non-Financials (L.H.S)
              Spread (R.H.S)                                                                                             Spread (R.H.S)
                                                                   Spread (R.H.S)
Sources: Refinitiv, Allianz Research

© Copyright Allianz                                                                                                                                                  24
VALUATIONS: STRETCHED IN THE US

                      CAPE MSCI USA                               CAPE MSCI EMU                             CAPE MSCI EM
45                                                    60                                           35
40                                                                                                 30
                                                      50
35
                                                                                                   25
30                                                    40
25                                                                                                 20
                                                      30
20                                                                                                 15
15                                                    20
                                                                                                   10
10
                                                      10                                            5
 5
 0                                                     0                                            0
  1996          2000    2004   2008    2012    2016     1997   2001    2005   2009   2013   2017     2004   2008   2012      2016

                       MSCI USA         Avg.                          MSCI EMU       Avg.                    MSCI EM      Avg.

  High valuations in the US restrains the growth potential. Valuations are inflated by the technology sector. The EMU and
  EM are fairly valued based on the long-time average of the Cyclically Adjusted Price/Earnings ratio.

Sources: Refinitiv, Allianz Research

© Copyright Allianz                                                                                                                 25
CHINA

02
© Copyright Allianz
CHINA: THE SLOWDOWN CONTINUES
Household income, PMI employment index                         Fixed Asset Investment, nominal ytd %y/y                 GDP growth & breakdown of contributions
                            National disposable                                                                                                    Net exports
                                                               35                                                      14
21                          income %y/y, nominal                                                                                                   Gross Capital Formation
                                                        54
                                                                                                                                                   Government Consumption
19                          Official PMI surveys'                                                                                                  Private Consumption
                                                        53     25                                                                                  GDP %y/y
                            Employment index
17                          (simple average),                                                                           9
                            leading 2Q (rhs)            52
15                                                             15
13                                                      51
                                                                 5                                                      4
11
                                                        50
  9
                                                        49     (5)
  7                                                                  12   13   14   15   16    17    18      19   20    -1
  5                                                     48            Total FAI                  Manufacturing FAI
      09 10 11 12 13 14 15 16 17 18 19 20                             Real estate FAI            Infrastructure FAI
Source: National Statistics, Euler Hermes, Allianz Research   Source: Wind, Euler Hermes, Allianz Research             Source: National Statistics, Euler Hermes, Allianz Research

Private consumption may not perform                           Investment slowed in 2019. The real                      Trade tensions, the global slowdown
as well as in 2019 going forward, as the                      estate sector has been the bright spot,                  and weak business sentiment mean
labour market has deteriorated and the                        while investment in infrastructure and                   that China will continue to slow. We
support of past fiscal reforms peters out.                    manufacturing slowed.                                    expect GDP to grow by 6.2% in 2019,
                                                                                                                       5.9% in 2020 and 5.8% in 2021.
© Copyright Allianz                                                                                                                                                            27
CHINA: FURTHER POLICY EASING TO COME, IN A
MEASURED WAY
Size of fiscal stimulus package (% of GDP)                            Interest rates (%)                   Housing affordability (cost as % of income)
                                                      10                          Policy rate
  3.5                                                                             Average lending rate     300%                                   2018     2017
     3                                                                            Average mortgage rate
                                                                                  Average interbank rate   250%
                                                       8                                                                                                  Less
  2.5                                                                                                                                                     affordable
     2                                                                                                     200%
                                                       6
  1.5                                                                                                      150%
     1                                                 4
                                                                                                           100%
  0.5
                                                       2                                                    50%
     0
                 2018          2019           2020E
                                                       0                                                      0%
                        Spending   Tax cuts                                                                          Shanghai     Beijing   Shenzhen Guangzhou
                                                           09 10 11 12 13 14 15 16 17 18 19 20
Source: Euler Hermes, Allianz Research                Source: Datastream, Euler Hermes, Allianz Research   Source: Bloomberg, Euler Hermes, Allianz Research

Fiscal easing will continue in 2020,                  On the monetary side, the PBOC                       The housing sector may not be used as
mostly through infrastructure. We                     should continue easing, in a prudent                 a cyclical stabiliser this time. Housing
expect 2.7% of GDP of fiscal support in               way. In 2020, we expect the policy rate              and construction policies are unlikely to
2020, vs. 5.7% in total over 2018-2019.               to be cut by 30bp, and the Reserve                   be loosened, as authorities are more
                                                      Requirement Ratios by 150bp.                         concerned with housing affordability.
© Copyright Allianz                                                                                                                                               28
CHINA: HIGH DEBT AND FINANCIAL STABILITY RISKS
DETER FROM AGGRESSIVE STIMULUS
    Breakdown of total debt (as % of GDP)                      Banks’ NPL and provision coverage ratios                 SME loan balance breakdown by bank type
300                                                                                                                     100
                                              253     258
250                              216
                                                              15                                                         80
                      181
200                                                                                                              200
         146                                                                                                             60
150                                                           10
100                                                                                                                      40
                                                                                                                 100
  50                                                           5
                                                                                                                         20
    0
          07 08 09 10 11 12 13 14 15 16 17 18                  0                                                   0      0
                Shadow banking                                     14        15    16     17     18     19
                Bonds, equities                                                                                               Q1 Q2 Q3 Q4 Q1 Q2 Q3 Q4 Q1 Q2 Q3 Q4
                State companies (loans)                                 Rural banks NPL ratio (%)                             16 16 16 16 17 17 17 17 18 18 18 18
                Private companies (loans)                               All banks NPL ratio (%)                           State-owned   Joint-stock    Urban
                Households (loans)                                      Rural banks provision coverage ratio (%), rhs
                Government                                              All banks provision coverage ratio (%), rhs       Rural         Foreign-funded
Source: National statistics, Euler Hermes, Allianz Research   Sources: Wind, Euler Hermes, Allianz Research             Sources: Wind, Euler Hermes, Allianz Research

China’s total debt stands at c.260% of                        Several bailouts this year have raised                    The share of SME loan balance
GDP, which is similar to the US and the                       concerns on banking sector stability, in                  provided by urban and rural banks went
Eurozone.                                                     particular for smaller (city-level and                    up from 43% at the end of 2015 to 52%
                                                              rural) banks.                                             at the end of 2018.
© Copyright Allianz                                                                                                                                                     29
EUROZONE

03
© Copyright Allianz
EUROZONE: GREEN SHOOTS ON THE SUPPLY SIDE
AND RESILIENCE ON THE DEMAND SIDE
  Inventory to new orders vs industrial production, 1Q lead                         Household consumption & wage growth, yoy
                      Inventory to new orders ratio (lhs, inverted)
                      Eurozone industrial production (yoy, rhs)

 0,5                                                                  10,0%

 0,7                                                                  5,0%

 0,9                                                                  0,0%

 1,1
                                                                      -5,0%

 1,3
                                                                      -10,0%
 1,5
                                                                      -15,0%
 1,7
                                                                      -20,0%
 1,9
                                                                      -25,0%
       01 02 03 04 05 06 07 08 09 10 11 12 13 14 15 16 17 18 19 20
Sources: Refinitiv, Euler Hermes, Allianz Research                             Sources: Refinitiv, Euler Hermes, Allianz Research
The high levels of inventories started to correct in Q3                         While employment growth has clearly slowed down
and should continue to do so in Q4. This should                                 in most Eurozone countries in 2019, it remains
support a pick-up in industrial production in Q1 2020                           clearly positive. Household consumption should be
                                                                                also propped up by still solid wage growth.
© Copyright Allianz                                                                                                                 31
EUROZONE: MONETARY POLICY HELPED STABILIZE,
FISCAL POLICY SHOULD TAKE THE BATON
M1 & Eurozone real GDP growth (y/y, %), 2 quarters lead                Fiscal impulse, pp of real GDP growth

Sources: Refinitiv, Euler Hermes, Allianz Research
                                                          Sources: Refinitiv, Euler Hermes, Allianz Research
M1 – the inflation-adjusted money supply suggests that
an uptick in Eurozone GDP growth is around the corner.    The policy mix in the Eurozone remains very
We expect the ECB to continue to ease policy in 2020      supportive. Since 2019 fiscal policy is providing some
with one additional rate cut to be implemented in H1,     tailwind and will continue to do so in 2020/21
continue QE until end-2020 and remain on hold in 2021.
© Copyright Allianz                                                                                                32
THE GREEN DEAL: LIMITED UPSIDE
                          EU Commission nnounced policy                     Sectors                     Time frame           Potential impact
                                                                                                                             Eur 4.3bn for each Eur 1/t resulting CO2 price
                          Review Emissions Trading Directive                All                         Expect 2020s         increase on incremental purchased credits
                          End fuel tax exemptions                           Airlines, shipping          Likely 2020s         +15% fuel cost increase for each Eur 0.1/l fuel tax
                          Extend carbon trading to marine                   Shipping                    Likely 2020s         Eur 215bn to 2030
                          Reduce Co2 allocations to airlines                Airlines                    Expect 2020s         Eur 7bn to 2030
                          Revision Energy Taxation Directive                Energy                      Expect 2020s         Eur 1.1bn for 1%
                          Reduce auto emissions from 95g/km to nil          Automotive, energy          2030s
                          Assess inclusion of road transport in EU ETS      Road transport              Possible mid 2020s   Eur 157bn to 2030
                                                                            Automotive, road
                          Smart mobility strategy                           transport, energy           2020                 EV targets, infrastructure upgrade
                          Energy Efficiency and Renewable Energy            Energy, retail,
                          Directive                                         construction, industrials   Expect early 2020s  Further renewables targets upgrade
                                                                            Telecommunications, IT                          Tightening obsolescence and recycling; energy
                          Green ICT sector                                  services                    Possible late 2020s consumption and efficiency mandates
                          Renovation wave initiative                        Construction                H1 2021 tbc         Rising demand for construction
                          EU ETS Innovation Fund                            IT, industrials, energy
                          Review all agriculture and forestry legislation   Agrifood, pulp&paper

                          Review air, water, chemicals legislation      Chemicals, industrials
                          Resubmit Eurovignette for heavy trucks        Road transport
                          Facilitate smart integration                  Energy, industrials
                          EU wide plan to close emissions ambitions gap                                 Potentially 2021
                                                                        Industrials, machinery,
                          Industrial strategy                           energy, metals                  March 2020
                          Construction productionsregulations revision  Construction, metals
                          Circular economy                              All
                          State aid review                              Energy, industrials             Likely 2020s         Greater distinction/bonus malus rules
                          strongly negative                             Neutral to negative             TBC
                          Negative                                      Positive

  The new European green deal: wide ranging and ambitious full decarbonisation 2050, -50-55% 2030
                                                                                                                                                                                   Sources: EU, Allianz Research calculations
  Strongest impact of incremental measures: Transport, energy; strong likelihood of EU ETS tightening/reform
  Carbon border tax: Controversial measure, in silage with new industrial policy, positive for industrials, metals, energy intensives, potential for wide
   ranging secondary impact
© Copyright Allianz                                                                                                                                                                                                             33
EUROZONE: TOO MUCH SAVINGS, NOT ENOUGH
PUBLIC SPENDING
                            6                                                                                -2%

                            5                                                                                -1%

                            4                                                                                0%

                            3                                                                                1%

                            2                                                                                2%

                                      EMU 10-year Government Bond yield (L.H.S)
                            1                                                                                3%
                                      EMU current account balance as a % of GDP (R.H.S inverted)

                            0                                                                                 4%
                             2000                    2005                      2010                2015   2020

                                    Source: Refinitiv, Allianz Research

Monetary policy is not the only, nor the major force pushing interest rates down. Excess savings are in the driving seat.
© Copyright Allianz                                                                                                         34
AUTOMOTIVE SECTOR: FRAGILE AND UNEVEN
  RECOVERY FROM REGULATORY CONSTRAINTS
             New passenger cars registrations                          German market and industry                  •   As expected, 2019 has been chaotic for
            cumulative 12 months (y/y change)                            (in millions of vehicles)                     monthly sales due to the implementation of
                                                                                                                       the WLTP in Sept 2018 which created a
                                                                                                                       strong basis effect
                                                                                                                   •   2019 will ended almost stable thanks to the
                                                                                                                       German market (+4% expected) while some
                                  WLTP implementation
                                  (Sept 2018))
                                                                                                                       markets are struggling to recover (Spain, UK)
                                                                                                                   •   Yet, the German industry has been strongly
                                                                                                                       impacted, with a extended loss in volume of
                                                                                                                       production and exports
                                                                                                                   •   2020 will remain challenging, with a small
                                                                                                                       decline in new registrations (-1%) due to a
                                                                                                                       prolonged ‘wait-and-see’ attitude of the
                                                                                                                       demand - despite a faster rolling out of new
                                                                                                                       vehicles, notably low-emitting ones, and
                                                                                                                       aggressive price competition ahead of the
                                                                                                                       CO2 emission requirements for 2021
                                                                                                                   •   We expect a better outlook for 2021 (+1% in
Sources: national sources, IHS, Allianz/Euler Hermes Research   Sources: VDA, IHS, Allianz/Euler Hermes Research       new registrations) when the European EV will
                                                                                                                       take off more significantly4
  © Copyright Allianz 21-Jan-20                                                                                                                                        35
GERMANY: INVENTORY HEADWINDS TO ABATE, BUT
PRODUCTION REBOUND NOT IN THE CARDS
        Firms’ inventory assessment vs. quarterly GDP growth    New manufacturing orders & industrial production
             contribution of inventory (four quarter sum)                   (3MMAV, y/y, in %)

           Sources: Refinitiv, Euler Hermes, Allianz Research   Sources: Refinitiv, Euler Hermes, Allianz Research
        Following a notable inventory correction over           A marked restart in production is not in the
        the past year, the worst is probably behind us.         cards looking at incoming order activity. Instead
        Going forward we expect the negative growth             we only expect a moderate industrial recovery.
        impact from stocks to fade.
© Copyright Allianz                                                                                                  36
GERMANY: CONSUMPTION TO SAVE THE DAY IN
2020, BUT INVESTMENT SET TO DECLINE
    Average contributions to quarterly GDP                  Fiscal & monetary policy mix                   New capital good orders (3MMAV, y/y, 3M
                 growth (pp)                                                                                   lag) vs. fixed investment (%, y/y)

                                                      *real policy rate minus r* estimated by HLW-Model;
                                                      **change in structural primary balance

Sources: Refinitiv, Euler Hermes, Allianz Research   Sources: AMECO, Euler Hermes, Allianz Research        Sources: Refinitiv, Euler Hermes, Allianz Research

Domestic demand has become much                      A big fiscal stimulus package is                      Fixed investment growth looks set to
more important to German GDP growth                  unlikely unless the economic outlook                  cool notably given the weak GDP
in recent years, in particular private               deteriorates further, but German                      growth outlook, subdued capacity
consumption.                                         domestic demand will benefit from a                   utilization rates and lingering elevated
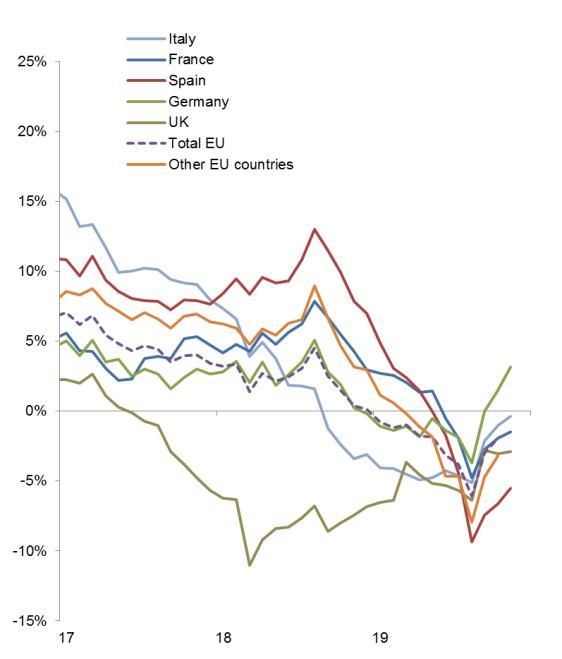
© Copyright Allianz                                  very supportive policy mix.                           uncertainty.                           37
FRANCE: INTERMEDIATE GROWTH MEANS WINNERS
AND LOSERS
               France: Manufacturing production, y/y change                                                                                                                                     France: Household confidence, durable goods spending
     12%                                                                                                                                                                                             Unemployment expectations (balance)
     10%                                                                                                                                                                                             Is it suitable time to make major purchases? (balance)
      8%                                                                                   2018Q2
                                                                                                                                                                                               80
      6%                                                                                   2019Q2
      4%                                                                                   2019Q3                                                                                              60
      2%
      0%                                                                                                                                                                                       40
     -2%
     -4%                                                                                                                                                                                       20
     -6%
     -8%                                                                                                                                                                                        0
               Total, Industry

                                 Agrifood

                                                                              Carmakers

                                                                                          Textile

                                                                                                                                                                           Transport equip.
                                                                                                                              Pharmaceuticals

                                                                                                                                                                  Metals
                                            Electronics

                                                                                                                  Chemicals

                                                                                                                                                Plastics/rubber
                                                          Electrical Equip.

                                                                                                    Wood, paper

                                                                                                                                                                                              -20

                                                                                                                                                                                              -40
                                                                                                                                                                                                    06 07 08 09 10 11 12 13 14 15 16 17 18 19
    Sources: Bloomberg, Allianz Research                                                                                                                                                      Sources: Insee, IHS Global Insight, Allianz Research

    French manufacturing sector entered later into recession                                                                                                                                  The consumer will save the day, but no free lunch:
    mode, but destocking into the car supply chain is now                                                                                                                                     Durable goods (construction, household equipment) will
    triggering a deterioration of the output. Pharmaceuticals                                                                                                                                 be among winners. But consumer spending will continue
    and transport equipment still in growing mode.                                                                                                                                            to experience a glass ceiling as a result of the impact of
© Copyright Allianz                                                                                                                                                                           the pension reform on household saving behavior.                38
ITALY: SLOW RECOVERY WITH LINGERING
POLITICAL RISK
                           Real GDP and components                       10yr Italian sovereign yields vs German Bund, in bp

        4,0                                                           600
                                                      Forecast
        3,0                                                           500
        2,0
                                                                      400
        1,0
                                                                      300
        0,0
       -1,0                                                           200
       -2,0                                                           100
       -3,0
                  2015    2016    2017     2018 2019e 2020f 2021f        0
                                                                          2003 2005 2007 2009 2011 2013 2015 2017 2019
               Consumption            Investment       Stocks
               Exports                Imports          Governmernt          Redenomination risk            Credit risk   Total risk premium
               real GDP (y/y %)
    Sources Refinitiv, Allianz Research                              Sources Refinitiv, Allianz Research

    Italy will show the same growth pattern as euro area,            With new coalition, redenomination risk has been
    however less dynamic, with consumption being a                   entirely priced out. If government succeeds in
    backbone of growth and investment with weaker                    reestablishing some fiscal credibility, credit risk
    momentum.                                                        premium should also narrow, especially in QE
© Copyright Allianz                                                  context.                                                                 39
SPAIN: CONSUMPTION STABILIZING, EXPORTS
SLOWING, COMPANY MARGINS DOWN
                       GDP growth and components                              NFC Profit & labor costs, share of Gross Value Added (GVA)
      4,5               Net exports                  Stocks
      4,0               Investment                   Public Spending                                    Gross profit share (lhs)
                        Consumer Spending            GDP                                                Share of labor cost (rhs)
      3,5                                                                     45%                                                               65%
      3,0
                                                          Forecasts           43%                                                               63%
      2,5                                           2,0
                                                              1,6
      2,0                                                              1,4    41%                                                               61%
      1,5
      1,0
                                                                              39%                                                               59%
      0,5
      0,0                                                                     37%                                                               57%
     -0,5
     -1,0                                                                     35%                                                               55%
                2015   2016    2017      2018      2019      2020     2021          01    03    05     07    09     11      13   15   17   19
    Sources: IHS, Euler Hermes, Allianz Research                             Sources: IHS, Euler Hermes, Allianz Research

    Higher labor costs => lower competitiveness =>                           (-) Savings ratio increasing; (-) Job growth is slowing.
    slower exports. Stable but slow consumption, slowing                     (+) Higher wages should be a buffer for consumption.
    investment. Political fragmentation mean no                              Companies pass it on margins, that are steadily
    structural reforms; social spending as a quick win.                      decreasing (43% of GVA, vs. peak of 44.2%); still
© Copyright Allianz                                                          higher than Eurozone average.                                            40
UNITED KINGDOM: BREXIT SHOULD BE DONE IN
2020, BUT MIND THE “NO TRADE DEAL” RISK
       Fiscal spending by party, % of GDP                       Inventory to orders ratio                          Consumer confidence

Sources: Manifestos, Euler Hermes, Allianz Research   Sources: Markit, Euler Hermes, Allianz Research   Sources: Eurostat, Euler Hermes, Allianz Research

The impact on GDP growth is positive                  55% of UK firms reported that Brexit              Consumer confidence remains weak
for all parties. We estimate GDP growth               was one of their top three sources of             despite pledge of fiscal spending
at 1.8% in 2021 for Labor led coalition               uncertainty in November. The stock                through tax cuts that have helped the
and 1.6% for Conservatives majority                   absorption will continue to be a drag             index improve in the past elections.
© Copyright Allianz                                   on growth                                                                                             41
EUR 10Y SWAP: UNDER THE ECB’S WATCH
4%                                                 10Y EUR Swap
                                                                                                  • The base line scenario shows a continuous climb
                                                   In Sample Estimate
                                                                                                    from current levels to a comfortable 0.3% at the end
                                                   Out-of-sample Estimate                           of 2021.
3%
                                                   +/- 1 std. dev.
                                                                                                  • 10y EUR swaps are expected to remain close to our
                                                    Base line
                                                   Muddle     scenario
                                                          through (55%)                             fundamental fair value estimate (0.2%).
2%
                                                                                                  • On the inflation side, inflation expectations are not
                                                                                                    expected to shows signs of a clear repricing over
                                                                                                    the forecasting period as underlying inflation is not
1%                                                                                                  expected to substantially accelerate.

                                                                                                  • The EMU rates prospect implies a slight
0%                                                                                                  fundamental yield overvaluation at the end of the
                                                                                                    forecasting period.

-1%
   2011                2013                 2015     2017               2019               2021
                                                    Sources: Refinitiv, Allianz Research

  Allianz Research – Capital Markets Research
  © Copyright Allianz   21-Jan-20                                                                                                                           42
10Y BTP: LOCKED-IN BY THE ECB
                                                                                                                             Spread decomposition of Italy 10y vs Germany 10y *
700                                                                                                                    700
                                                                     10Y BTP Spread
                                                                                                                                  Redenomination risk premium
                                                                      Base through
                                                                     Muddle line scenario
                                                                                    (55%)                              600        Idiosyncratic risk premium
600

                                                                                                                       500
500                                                                                                                                                             „Salvini“-Spread
                                                                                                                       400

400                                                                                                                    300

300                                                                                                                    200

                                                                                                                       100
200
                                                                                                                         0
                                                                                                                          2008      2010       2012        2014        2016            2018              2020
100
                                                                                                                                                                  Sources: Refinitiv, Allianz Research

  0                                                                                                                     A spread level significantly over 200bp would require repricing of
      1993           1998              2003              2008             2013              2018                        redenomination risk which can either be triggered by political activism or
                                                                                                                        emergence of doubts over robustness euro area architecture.
                                                              Sources: Refinitiv, Allianz Research                      BTPs are only expected to enter in such a described situation in our
   * Using variance decomposition of BTP yield movements in systemic part (explained by decoupling from Germany) and    global recession scenario.
   idiosyncratic part
 Allianz Research – Capital Markets Research
 © Copyright Allianz   21-Jan-20                                                                                                                                                                           43
EUR IG: FUNDAMENTALS HAVE NO POWER
bps
500
                                       Eurozone IG Corporate Index (OAS**)                      • EUR investment grade corporates are expected to remain
                                                                                                  anchored at current levels in 2020 as the ECB market
                                       Muddle through
                                        Base line     (55%)
                                                  scenario                                        presence should not grant a free ticket for markets to take
400                                                                                               strong positions.

                                                                                                • Importantly, the ECB market presence is expected to
300                                                                                               keep equity volatility anchored at current levels until the
                                                                                                  end of the forecasting period which is a key input for
                                                                                                  corporate spread widening.

200                                                                                             • The slow but steady increase (~105bps) should reflect the
                                                                                                  anticipation of the ECB’s market withdrawal.

100

 0
      1996     1999        2002        2005       2008   2011      2014       2017       2020
                                                         Sources: Refinitiv, Allianz Research
  ** Index: ICE Bank Of America Euro Corporate Index
  IG: Investment grade ; OAS: Option Adjusted Spread

  Allianz Research – Capital Markets Research
  © Copyright Allianz   21-Jan-20                                                                                                                               44
EMU EQUITIES: TIME FOR THE COMEBACK

                         MSCI EMU PRICE FORECAST                                  • Low valuations leave some room for European
                                                                                    equities to catch up
   600                                                                     1,00
                                                                                  • No trade tensions between the US and Europe
                                                                           0,90
   500                                                                            • Stable growth across the region and mild earnings
                                                                           0,80
                                                                                    recovery
                                                                           0,70
   400
                                                                                  • German economy recovers after almost technical
                                                                           0,60
                                                                                    recession and lifts European equity market
   300                                                                     0,50
                                                                                  • Diminished risk of the hard Brexit brings back the
                                                                           0,40
                                                                                    confidence
   200
                                                     Recessions
                                                                           0,30
                                                                                  • The volatility may occur within the year
                                                     In sample Forecast    0,20
   100
                                                     Actual
                                                                           0,10
                                                     Muddle
                                                     Base    through
                                                          line  scenario
       0                                                                   0,00
        1996           2000   2004     2008   2012   2016     2020

Sources: Refinitiv, Allianz Research
 © Copyright Allianz                                                                                                                     45
EMERGING MARKETS

04
© Copyright Allianz
EMERGING MARKETS: GROWTH SHOULD STABILIZE
      Emerging Markets: Manufacturing PMI, open vs. closed                              Emerging Markets: fiscal balance (% of GDP) vs. real
     60                   economies                                              5%                          policy rate
                                                                                      Real policy rate
                                                                                                                               MEX
                                                Closed        Open
                                                                                 4%
                                                                                                                                                   RUS
     55                                                                          3%
                                                                                             IND                       TUR
                                                                                 2%                    BRA
                                                                                                                               IDN
     50                                                                          1%                 ZAF          MYS
                                                                                                                                     THA
                                                                                 0%
                                                                                                                  ROU                 CZE      KOR
     45                                                                         -1%                                                POL

                                                                                -2%                                                HUN

     40                                                                         -3%                                                           Fiscal balance
          08     09   10   11   12   13    14      15    16     17   18   19       -10%       -8%      -6%       -4%         -2%         0%       2%     4%
    Sources: Bloomberg, Allianz Research                                       Sources: IHS Global Insight, Allianz Research

    The growth fatigue is broadening in Emerging                               Key Emerging Markets, such as EM Asia and EM Europe
    Markets: open economies still hit by the                                   still have a leeway to ease. Positive surprises could come
    protectionism wave, but quite closed economies such                        from Brazil, Russia, Eastern Europe. Bad surprises could
    as India, Russia and South Africa also disappointed.                       come from trade hubs (HK, Singapore, Taiwan), Mexico,
                                                                               Colombia, Saudi Arabia and Middle East. Weak spots
© Copyright Allianz                                                            prevailing: Argentina, Turkey, South Africa.             47
EMERGING MARKETS: MIND THE BAD CHOLESTEROL
       Emerging Markets (excl. China and Russia): Net capital            Public debt in % of GDP in EMs: level vs. change
                          flows, USD bn                                              (between 2013 and 2019)
      100
                                                                       70%     Change                                            AGO
        80                                                             60%
                                 Long-term average                                                                       ZMB     ARG
        60                                                             50%
                                                                                                     DZA
        40                                                             40%                                               TUN    COG
                                                                                                              BEN
                                                                       30%                           ECU
        20                                                                                                                              LBN
                                                                                                          GAB                   BRA
                                                                                                  CMRBOL ETH                           (155%
                                                                       20%              NGA           UKR
          0                                                                            CHL      UGA    GHA SEN TGO                     +20pp)
                                                                       10%          KAZ PER TZA COL KEN URY                     JOR
       -20                                                                                   IDN   CIV MEX MOR
                                                                                    BGR          THA    VNM IND
                                                                        0%               TUR             MYS
       -40                                                                        RUS   KHM ROU        SRB                      EGY
                                                                       -10%               BIH PHL    POL       HUN                    Level
       -60                                                            -10%       10%        30%         50%        70%         90%      110%
              12      13    14      15       16     17   18   19
    Sources: IHS Global Insight, Allianz Research                  Sources: IHS Global Insight, Allianz Research

    Capital flows are fickle. Their recovery is somewhat           The current yield seeking environment is conducive
    subdued, but push (low rates in advanced economies)            to too much debt accumulation in countries with low
    and pull (higher yields in emerging markets) are               domestic savings, so unable to repay at the end with
    financing a strong pipe of primary issuance in high-yield      a higher likelihood.
    EM and frontier markets.
© Copyright Allianz                                                                                                                             48
ASIA: MORE SLOWDOWN INTO 2020, WITH POLICY
BUFFERS IN PLACE
                      Real GDP growth                                          Monetary policy leeway                                                         Fiscal policy leeway
                                                                                                                                                                   Fiscal      Public
12%                                                                                                         Inflation            Monetary         2019E           balance       debt
                                                                                                                                                                                          Fiscal
                                                                                 Inflation    Inflation                 Policy                                                            leeway
                                              forecasts                                                      latest               policy                          % of GDP    % of GDP
10%                                                                               Target      2019 Q3                    rate
                                                                                                             month                leeway
                                                                                                                                                  Australia         -0.7%      42%
                                                              Australia      2%-3%              1.7%          1.7%      0.75%
  8%                                                          China           3.0%              2.9%          4.5%      4.20%
                                                                                                                                                  China             -6.6%      56%
                                                                                                                                                  Hong Kong         -0.3%       0%
  6%                                                          India           4.0%              3.5%          4.6%      5.15%
                                                                                                                                                  India             -8.0%      69%
                                                              Indonesia    3.5% +/-1%           3.4%          3.0%      5.00%
                                                                                                                                                  Indonesia         -2.0%      30%
  4%                                                          Japan           2.0%              0.3%          0.2%      -0.10%
                                                                                                                                                  Japan             -3.0%      238%
                                                              Malaysia*         -               1.3%          1.1%      3.00%
                                                                                                                                                  Malaysia          -3.4%      56%
  2%                                                          New Zealand    1%-3%              1.5%          1.5%      1.00%
                                                                                                                                                  New Zealand       0.1%       30%
                                                              Philippines   3% +/-1%            1.7%          1.3%      4.00%
  0%                                                          South Korea     2.0%              0.0%          0.0%      1.25%
                                                                                                                                                  Philippines       -1.1%      39%
                                                                                                                                                  Singapore         3.2%       114%
                                                              Taiwan*           -               0.4%          0.6%      1.38%
 -2%                                                                                                                                              South Korea       0.7%       40%
                                                              Thailand    2.5% +/-1.5%          0.6%          0.2%      1.25%
           10 11 12 13 14 15 16 17 18 19 20 21                                                                                                    Taiwan            -1.3%      34%
                                                              Vietnam*          -               2.2%          3.5%      6.00%
            Japan                China                                                                                                            Thailand          -1.1%      42%
                                                              * no explicit inflation targeting framework
            India                APAC 4 Tigers                                                                                                    Vietnam           -4.5%      54%
                                                              Light red when policy rate < latest inflation, green otherwise
            ASEAN                                                                                                                                 Light red        if < -3%    if > 50%

Source: National Statistics, Euler Hermes, Allianz Research   Source: National Statistics, Euler Hermes, Allianz Research                   Source: National Statistics, Euler Hermes, Allianz Research

We expect Asia-Pacific GDP growth at There are policy buffers in place.                                                                     On the fiscal side, China, India, Japan, the
4.3% in 2019, 4.2% in 2020 and 4.5% Central banks are in easing mode, as                                                                    Philippines and South Korea will
in 2021.                             inflationary pressures in most countries                                                               implement relatively large support. More is
                                     are relatively subdued.                                                                                needed in countries that have much fiscal
                                                                                                                                            leeway, such as Singapore, Indonesia,
© Copyright Allianz                                                                                                                                                                49
                                                                                                                                            Taiwan and Thailand.
EMERGING EUROPE : FISCAL POLICY CAN SUPPORT BUT
WATCH FOR PRICE PRESSURES
 Nominal wage growth (%; 4-qtr mov. avg.)                                   Monetary policy leeway                                              Fiscal policy leeway, 2019f
 20          Bulgaria         Czechia             Hungary               Inflation Inflation Inflation Policy Monetary                                 Fiscal  Public                Fiscal
 18          Poland           Romania             Slovakia                target Q3 2019 latest        rate    policy
                                                                                             month            leeway
                                                                                                                                                     balance   debt                 policy
             Russia
 16                                                                                                                                                 % of GDP % of GDP              leeway
                                                             Poland       2.5%     2.7%      2.5%     1.50%
 14                                                          Czechia      2.0%     2.8%      3.1%     2.00%                          Poland           -1.9%   47.5%
                                                             Romania      2.5%     3.8%      3.8%     2.50%                          Czechia           0.3%   32.0%
 12
                                                             Hungary      3.0%     3.3%      3.4%     0.90%
 10                                                          Slovakia*
                                                                                                                                     Romania          -3.8%   36.0%
                                                                          2.0%     2.9%      2.9%     0.00%
  8                                                          Croatia         -     0.9%      0.6%     2.50%                          Hungary          -2.0%   69.0%
                                                             Bulgaria** 2.0%       2.7%      2.4%     0.00%                          Slovakia         -1.2%   48.0%
  6
                                                             Russia       4.0%     4.3%      3.5%     6.25%                          Croatia           0.1%   71.5%
  4                                                          Turkey       5.0%     13.6%     10.6% 12.00%
                                                                                                                                     Bulgaria          0.9%   21.0%
  2                                                          * Slovakia is a Eurozone member, thus monetary policy is set by
                                                                the ECB.                                                             Russia            2.5%   14.0%
  0                                                          ** Bulgaria has currency board with a peg to the EUR, thus it follows   Turkey           -3.1%   32.3%
  -2                                                            the monetary policy of the ECB.
       12   13    14     15     16      17   18       19                                                                             Orange            if 50%
Sources: National statistics, Eurostat, Allianz Research     Sources: National statistics, IHS Markit, Allianz Research              Sources: Eurostat, IHS Markit, Allianz Research

Wage growth has peaked in most economies                     Monetary policy is already loose in many                                Most countries have fiscal policy leeway.
(but still rising in Slovakia and Bulgaria).                 countries.                                                              Most of them have already announced or are
Yet it remains elevated, reflecting labor                    Inflationary pressures remain present in some                           implementing some fiscal stimulus measures
shortages in most countries.                                 countries (Czechia, Romania, Hungary,                                   such as rises in public sector wages and social
                                                             Slovakia).                                                              benefits.
It affects corporate margins as firms can pass
                                                             Russia and Turkey likely to cut rates further in                        Caution is warranted in Romania, Hungary,
on the rising costs only partly to consumers
                                                             Q1 2020 but will need to watch currency                                 Croatia and Turkey.
(CPI
©       inflation
  Copyright Allianz remains moderate).                                                                                                                                                       50
                                                             volatility.
LATAM: POLITICAL RISK AND A STALLING REFORM
MOMENTUM LIMIT GROWTH ACCELERATION
              BB2      Mexico
                                                                       D4     Venezuela                                                                      Monetary and fiscal policy leeway
                      1% 1.7%
              0.0%

              2019 2020
              2019  2020 2021
                           2021
                                                                        -35%
                                                                                   -10% -5%                                                                        Inflation   Inflation  Inflation     Policy   Monetary
                                   3.1%
                                          2.2% 2.3%
                                                                            2019     2020     2021
                                                                                                                                                                    target     Q3 2019 latest month      rate  policy leeway
                  BB2 Colombia                                                                                                                         Argentina    30.0%       53.3%      51.4%        58.00%
                                                                        2019                2021
                                   2019  2020
                                   2019 2020    2021
                                              2021                                                                                                        Brazil     4.5%        3.2%       3.3%        4.50%
                                      C3    Ecuador                                                                     B2 Brazil                          Chile     3.0%        2.2%       2.7%        1.75%
                                                                                                                                       2.5%            Colombia      3.0%        3.8%       3.9%        4.25%
                                                                                                                                 2%
                                            -0.5% 0.5% 1.1%                                                            1.1%
                                           2019    2020    2021
                                                                                                                                                         Mexico      3.0%        3.3%       3.0%        7.50%
                                                                                                                      2019      2020
                                                                                                                       2019 2020 2021
                                                                                                                                       2021
                                                                                                                                                           Peru      2.0%        2.0%       1.9%        2.25%
                                   BB1 Peru
                                                           3.2% 3.3%                                                                                                       Fiscal balance Public debt     Fiscal policy
                                                    2.2%
                                             2019          2021                                         Uruguay BB2                                                           (% GDP)      (% GDP)           leeway
                  Low risk                                                                                                                                    Argentina        -4.0%        96.0%
                                                  2019  2020 2021
                                                              2021                                                 1.4% 2%
                                                   2019 2020                                                0.3%
                  Medium risk                                                                                                                                    Brazil        -6.7%        90.6%
                                                                                                     1.5%
                  Sensitive risk                         Chile BB2                                          2019  2020
                                                                                                            2019 2020    2021
                                                                                                                       2021                                       Chile        -2.5%        28.2%
                  High risk                                                                                                                                   Colombia         -1.7%        50.4%
                                                              3.2%
                                                                                                            D4 Argentina                                        Mexico         -2.6%        53.8%
                                                    1%
                                                          0.6%                     -3.5% -4%                                                                      Peru         -1.5%        27.0%
     Data as of Q4 2019                                                            2019     2020     2021                                                  Light red           if 50%
                                                  2019  2020   2021
                                                  2019 2020  2021

    Sources: IMF WEO, Euler Hermes, Allianz Research
                                                   2019                                              2021                                     Sources: IMF WEO, Euler Hermes, Allianz Research

    After stalling in 2019 (+0.6% exc. Venezuela), LatAm                                                                                      Most central banks have already eased monetary
    will miss the 2% threshold of growth in 2020 (+1.3%)                                                                                      policy. Few countries have fiscal leeway: Chile will
    for the 7th straight year. In 2021, GDP growth should                                                                                     increase social spending next year. Hot spots for
    accelerate to a modest +2.2%.                                                                                                             2020: Colombia and Mexico. Brazil’s risk picture
© Copyright Allianz                                                                                                                           improving but window for reform is narrowing.                                    51
LATAM: REDISTRIBUTION AND POLITICAL REFORMS
NEEDED TO RESPOND TO PROTESTS
                                                                                   160%
       Perceptions of progress, confidence in government and                                          Convergence towards US GDP per capita
                                                                                   140%
                    satisfaction with democracy
       55                                                                          120%
                                                                                                                                                        Change in 2000s
                           Confidence in Executive Government                                                                                           Change in 2010s
                                                                                   100%
       50
                           Perception of Economic Progress
                                                                                   80%
       45                  Satisfaction with the functioning of democracy
                                                                                   60%
       40                                                                          40%

       35                                                                          20%

                                                                                    0%
       30
                                                                                   -20%
       25                                                                    24
                                                                                   -40%
                                                                             22

                                                                                                      Brazil

                                                                                                                                             Ecuador

                                                                                                                                                                         Chile
                                                                                                                                                                Mexico

                                                                                                                                                                                 Colombia

                                                                                                                                                                                                       Peru

                                                                                                                                                                                                                                              Turkey
                                                                                                               South Africa

                                                                                                                                                                                                                         Poland
                                                                                          Argentina

                                                                                                                              Saudi Arabia

                                                                                                                                                       Russia

                                                                                                                                                                                                                                  Indonesia

                                                                                                                                                                                                                                                                     India

                                                                                                                                                                                                                                                                             China
                                                                                                                                                                                            Thailand

                                                                                                                                                                                                              Malaysia

                                                                                                                                                                                                                                                       Philippines
       20                                                                    20
       15
            10        11     12      13     14      15      16     17       18
    Sources: Latinobarometro, Euler Hermes, Allianz Research                      Sources: IMF; Euler Hermes, Allianz Research

    Confidence in political institutions, satisfaction with                       Lost decade: in the 2010s see that Latin American
    democracy and perception of progress have almost                              countries have either lagged the U.S. per capita
    halved since 2010. This is one clear pattern that                             growth or converged at a much slower rate compared
    could explain renewed social demands and protests.                            to the 2000s and compared to other main EM.
© Copyright Allianz                                                                                                                                                                                                                                                                  52
AFRICA: NO COUNTRY FOR OLD MEN

               Africa: Growth ranking from over-performers to                                                                                                                                                                     Morocco and South Africa: Insolvencies
                             under-performers
     10%                                                                                                                                                                                                              10000                                                               3000
                                       Average last 5 years                                                                                                                                                            9000
      8%                               2020 Forecast                                                                                                                                                                                                                                      2500
                                                                                                                                                                                                                       8000

      6%                                                                                                                                                                                                               7000
                                                                                                                                                                                                                                                                                          2000
                                                                                                                                                                                                                       6000
      4%
                                                                                                                                                                                                                       5000                                                               1500

                                                                                                                                                                                                                       4000                   Morocco (left)
      2%
                                                                                                                                                                                                                                                                                          1000
                                                                                                                                                                                                                       3000
                                                                                                                                                                                                                                              South Africa (right)
      0%                                                                                                                                                                                                               2000
                                                                                                                                                                                                                                                                                          500
                              Kenya

                                                                                                                                   Benin
             Africa

                                                                                              Morocco

                                                                                                                                                                                                            Angola
                                                                                                        Tanzania
                                      Ghana
                                              Congo, DR
                                                          Senegal

                                                                                                                                           Ethiopia
                                                                                                                                                      Nigeria

                                                                                                                                                                                    Zambia
                                                                                   Cameroon

                                                                                                                                                                Tunisia
                                                                                                                                                                          Algeria
                      Egypt

                                                                                                                   Côte d'Ivoire
                                                                    Burkina Faso

                                                                                                                                                                                             South Africa
                                                                                                                                                                                                                       1000
     -2%
                                                                                                                                                                                                                           0                                                              0
                                                                                                                                                                                                                                12     13     14     15    16       17   18   19f   20f
    Sources: IHS Global Insight, Allianz Research                                                                                                                                                                    Sources: StatSSA, Inforisk, Allianz Research

    Growth is disappointing in many countries in Africa                                                                                                                                                              Low growth is the way for a deterioration of the
    from those exhibiting a deceleration from a high to an                                                                                                                                                           payment behavior, as shown particularly in Morocco
    intermediate level to those where growth                                                                                                                                                                         (+7% in 2019 and +5% in 2020) and South Africa
    disappeared almost completely                                                                                                                                                                                    (+6% and +4%).
© Copyright Allianz                                                                                                                                                                                                                                                                              53
US-IRAN: PARTIAL DÉTENTE, REGIONAL INSTABILITIES
  Lasting de-escalation (but not                              Intensified but controlled                            Full-fledged war (35%)
necessarily conflict resolution) (5%)                            confrontation (60%)
Oil price:                                            Oil price:                                           Oil price:
• Average oil price of 62 USD/bbl (Brent) in 2020     • Average oil price of 66 USD/bbl (Brent) in 2020    • Average oil price of 80 USD/bbl (Brent) in the
Iran actions:                                         Iran actions:                                          12 months following the outbreak
• No further direct retaliatory actions against the   • Further retaliatory actions against targets with   Iran actions:
  US                                                    links to the US, most likely through proxies in    • Further direct retaliatory actions against US
• Continued moderate non-compliance with                the region                                           targets, possibly also outside the region
  JCPOA, but no acceleration                          • Acceleration of non-compliance with JCPOA          • Acceleration of non-compliance with JCPOA
• Moderate actions by Iran proxies against US         • Attacks against oil infrastructure and shipping    • Attacks against oil infrastructure and shipping
  allies in the region                                  of GCC states                                        of GCC states
US actions:                                           US actions:                                          • Blocking of Strait of Hormuz
• No further US sanctions                             • US sanctions stepped up in 2020, but with          US actions:
• No further US attacks                                 limited or no impact as existing sanctions         • US sanctions stepped up in 2020, but with
                                                        already pose maximum impact                          limited or no impact as existing sanctions
Elsewhere in the Middle East:
                                                      • “Proportionate” retaliation in the event of          already pose maximum impact
• Iraq: US and NATO remain on site, maintaining
  the status quo
                                                        attacks on US assets                               • Attacks on Iranian soil
• Syria: increasing influence of Russia and           Elsewhere in the Middle East:                        Elsewhere in the Middle East:
  Turkey                                              • Iraq: US + NATO possibly forced out; greater       • Iraq and Syria: US and NATO forced out;
• Israel and Lebanon: no impact                         influence of Iran; resurgences of IS possible        greater influence of Iran, Russia and Turkey;
                                                      • Syria: increasing influence of Russia and            resurgences of IS possible
Global capital markets:                                 Turkey                                             • Lebanon: increased political instability
• Some ST volatility (already seen); no LT impact
                                                      • Israel and Lebanon: no impact                      • Israel: Hamas, Islamic Jihad and Hezbollah will
                                                      Global capital markets:                                join in a war against Israel
                                                      • Some ST volatility; no LT impact                   Global capital markets:
                                                                                                           • ST volatility. Significant LT impact on MSCI
                                                                                                             only if oil prices remain at 80 USD/bbl for
© Copyright Allianz                                                                                          longer. Gold price to be likely winner.           54
LEBANON: RISK OF CAPITAL CONTROLS AND DEFAULT
SAUDI ARABIA: GROWTH TO REMAIN SUBDUED IN 2020-2021
       Lebanon: History of huge twin deficits                Lebanon: Bank deposits and FX reserves down                             Saudi Arabia: Oil still determines growth
10%                                                          10%                                                             20             Real GDP growth (%)               Oil price (USD/bbl)
                      Fiscal balance (% of GDP)
                      Current account balance (% of GDP)
                                                                                                                                  11%                                                                120
                                                              8%                                                             18
  5%                                                                                                                              10%                                        OPEC+ agreed            110
                                                                                                                             16                                              oil output cuts
                                                              6%                                                                   9%
                                                                                                                                                                             implemented             100
  0%
                                                                                                                                   8%
                                                                                                                             14                                                                      90
                                                              4%                                                                   7%
 -5%                                                                                                                  13.6
                                                                                                                             12                                                                      80
                                                                                                                                   6%
                                                              2%                                                                                                                                     70
                                                                                                                                   5%                                4.1%
-10%                                                                                                                         10
                                                              0%                                                                   4%                                                                60
                                                                                                                             8     3%                                            2.4%                50
-15%                                                                                                                                                                                        2.0%
                                                             -2%                                                                   2%
                                                                                                                             6                                                                       40
-20%                                                                                                                               1%                               1.7%
                                                             -4%                                                                                                                          1.2%       30
                                                                              Bank Deposits (% y/y)                          4     0%
                                                                                                                                                                                     0.4%            20
-25%                                                         -6%                                                                  -1%
                                                                              Import cover (months)                          2                                              -0.7%
                                                                                                                 -5.8%            -2%                                                                10
-30%                                                         -8%                                                            0     -3%                                                                0
        09 10 11 12 13 14 15 16 17 18 19f 20f 21f               01.17             01.18             01.19              01.20              09 10 11 12 13 14 15 16 17 18 19f 20f 21f
          Sources: IHS Markit, IMF, Allianz Research                    Sources: Byblos Bank, IMF, Allianz Research                     Sources: IHS Markit, National statistics, Allianz Research

• Unsustainably high twin deficits have made Lebanon highly dependent on capital inflows (remittances from                        • Recession in H1 2019.
   expats and aid flows mainly from Gulf region).                                                                                 • Monetary easing (in line with US Fed) and heavy
• This financing model is now at risk...                                                                                            fiscal stimulus is underway.
• …as confidence in both the fragile political system and the banking system is unravelling rapidly.                              • Yet, annual GDP growth to remain weak as long
• The risks of stepped-up USD shortages, LBP devaluation, liquidity stress in the banking sector (bank runs),                       as the “OPEC+ agreed oil output cuts” remain in
   shortages of basic goods, non-payment risks for imports, and of a debt restructuring have risen.                                 place (agreed until March 2020; we expect an
• ©“Soft” capital                                                                                                                   extension at least until end-2020).
    Copyright Allianz controls introduced by Lebanese Banking Association (such as restrictions on transfers abroad,                                                                                 55
   caps on USD withdrawals).
EM EQ: EM EQUITIES HAVE DISAPPOINTED FOR A
      LONG TIME
                  EM equities vs EMU equities: relative total return                                    EM vs EMU: Equities and Bonds relative unhedged
                      in common currency terms (unhedged)                                                                 total return
350                                                                                      90%      350

                                                                                                                              Equities
300                                                                                      60%      300                         HC Bonds
                                                                                                                              LC Bonds

250                                                                                      30%      250

200                                                                                      0%       200

150                                                                                      -30%     150

100                                                                                      -60%     100

 50                                                  Deviation from trend - (R.H.S)      -90%      50
                                                     Equities - MSCI EM / MSCI EMU
                                                     Long-term trend
  0                                                                                       -120%     0
   1989               1994              1999        2004        2009         2014     2019           1987 1990 1993 1996 1999 2002 2005 2008 2011 2014 2017 2020
      Sources: Refinitiv, Allianz Research

      Allianz Research – Capital Markets Research
      © Copyright Allianz   21-Jan-20                                                                                                                       56
INVESTMENT FLOWS & RETURNS: A CHICKEN AND
EGG PROBLEM?
              50                                                                                                                           8%
                                        NET ISSUANCE OF U.S ETF's SHARES: EMERGING MARKETS
                                                       12-month ETF issuance at annual rate (LHS)                                          7%
              40                                       MSCI EM Perceived rate of return (RHS)
                                                                                                                                           6%
              30
                                                                                                                                           5%
              20                                                                                                                           4%
USD billion

              10                                                                                                                           3%

                                                                                                                                           2%
               0
                                                                                                                                           1%
              -10
                                                                                                                                           0%

              -20                                                                                                                        -1%
                    2005                      2007   2009         2011         2013          2015          2017                      2019
                                                                                                    Sources: Refinitiv, Allianz Research
Allianz Research – Capital Markets Research
© Copyright Allianz   21-Jan-20                                                                                                                 57
THANK YOU

    Economic Research

    Global Economic Outlook
    Q4 2019

© Copyright Allianz
You can also read