2020 EEI Financial Conference - Calvin Haack November 2020 - Berkshire Hathaway Energy
←
→
Page content transcription
If your browser does not render page correctly, please read the page content below

2020 EEI Financial Conference
                November 2020

                Calvin Haack
     Senior Vice President and Chief Financial Officer
Forward-Looking Statements
This presentation contains statements that do not directly or exclusively relate to historical facts. These statements are "forward-looking statements" within the
meaning of Section 27A of the Securities Act of 1933, as amended, and Section 21E of the Securities Exchange Act of 1934, as amended. Forward-looking
statements can typically be identified by the use of forward-looking words, such as "will," "may," "could," "project," "believe," "anticipate," "expect," "estimate,"
"continue," "intend," "potential," "plan," "forecast" and similar terms. These statements are based upon Berkshire Hathaway Energy Company (BHE) and its
subsidiaries, PacifiCorp and its subsidiaries, MidAmerican Funding, LLC and its subsidiaries, MidAmerican Energy Company, Nevada Power Company and its
subsidiaries or Sierra Pacific Power Company and its subsidiaries (collectively, the Registrants), as applicable, current intentions, assumptions, expectations
and beliefs and are subject to risks, uncertainties and other important factors. Many of these factors are outside the control of each Registrant and could cause
actual results to differ materially from those expressed or implied by such forward-looking statements. These factors include, among others:
        –     general economic, political and business conditions, as well as changes in, and compliance with, laws and regulations, including income tax
              reform, initiatives regarding deregulation and restructuring of the utility industry, and reliability and safety standards, affecting the respective
              Registrant's operations or related industries;
        –     changes in, and compliance with, environmental laws, regulations, decisions and policies that could, among other items, increase operating and
              capital costs, reduce facility output, accelerate facility retirements or delay facility construction or acquisition;
        –     the outcome of regulatory rate reviews and other proceedings conducted by regulatory agencies or other governmental and legal bodies and the
              respective Registrant's ability to recover costs through rates in a timely manner;
        –     changes in economic, industry, competition or weather conditions, as well as demographic trends, new technologies and various conservation,
              energy efficiency and private generation measures and programs, that could affect customer growth and usage, electricity and natural gas supply
              or the respective Registrant's ability to obtain long-term contracts with customers and suppliers;
        –     performance, availability and ongoing operation of the respective Registrant's facilities, including facilities not operated by the Registrants, due to
              the impacts of market conditions, outages and repairs, transmission constraints, weather, including wind, solar and hydroelectric conditions, and
              operating conditions;
        –     the effects of catastrophic and other unforeseen events, which may be caused by factors beyond the control of each respective Registrant or by a
              breakdown or failure of the Registrants' operating assets, including severe storms, floods, fires, earthquakes, explosions, landslides, an
              electromagnetic pulse, mining incidents, litigation, wars, terrorism, pandemics (including potentially in relation to COVID-19), embargoes, and
              cyber security attacks, data security breaches, disruptions, or other malicious acts;
        –     a high degree of variance between actual and forecasted load or generation that could impact a Registrant's hedging strategy and the cost of
              balancing its generation resources with its retail load obligations;
        –     changes in prices, availability and demand for wholesale electricity, coal, natural gas, other fuel sources and fuel transportation that could have a
              significant impact on generating capacity and energy costs;
        –     the financial condition and creditworthiness of the respective Registrant's significant customers and suppliers;
        –     changes in business strategy or development plans;
        –     availability, terms and deployment of capital, including reductions in demand for investment-grade commercial paper, debt securities and other
              sources of debt financing and volatility in interest rates;
        –     changes in the respective Registrant's credit ratings;
        –     risks relating to nuclear generation, including unique operational, closure and decommissioning risks;

                                                                                                                                                                    2
Forward-Looking Statements
        –    hydroelectric conditions and the cost, feasibility and eventual outcome of hydroelectric relicensing proceedings;
        –    the impact of certain contracts used to mitigate or manage volume, price and interest rate risk, including increased collateral requirements, and
             changes in commodity prices, interest rates and other conditions that affect the fair value of certain contracts;
        –    the impact of inflation on costs and the ability of the respective Registrants to recover such costs in regulated rates;
        –    fluctuations in foreign currency exchange rates, primarily the British pound and the Canadian dollar;
        –    increases in employee healthcare costs;
        –    the impact of investment performance and changes in interest rates, legislation, healthcare cost trends, mortality and morbidity on pension and
             other postretirement benefits expense and funding requirements;
        –    changes in the residential real estate brokerage, mortgage and franchising industries and regulations that could affect brokerage, mortgage and
             franchising transactions;
        –    the ability to successfully integrate the portion of the natural gas transmission and storage business acquired from Dominion Energy, Inc. on
             November 1, 2020, and future acquired operations into a Registrant's business;
        –    the expected timing and likelihood of completion of the proposed transaction to acquire the remaining portion of Dominion Energy, Inc.’s natural
             gas transmission and storage business, including the ability to obtain the required clearance under the Hart-Scott-Rodino Antitrust Improvements
             Act of 1976, as amended;
        –    unanticipated construction delays, changes in costs, receipt of required permits and authorizations, ability to fund capital projects and other factors
             that could affect future facilities and infrastructure additions;
        –    the availability and price of natural gas in applicable geographic regions and demand for natural gas supply;
        –    the impact of new accounting guidance or changes in current accounting estimates and assumptions on the consolidated financial results of the
             respective Registrants; and
        –    other business or investment considerations that may be disclosed from time to time in the Registrants' filings with the United States Securities and
             Exchange Commission (SEC) or in other publicly disseminated written documents.

Further details of the potential risks and uncertainties affecting the Registrants are described in the Registrants’ filings with the SEC. Each Registrant
undertakes no obligation to publicly update or revise any forward-looking statements, whether as a result of new information, future events or otherwise. The
foregoing factors should not be construed as exclusive.

This presentation includes certain non-Generally Accepted Accounting Principles (GAAP) financial measures as defined by the SEC’s Regulation G. Refer to
the BHE Appendix in this presentation for a reconciliation of those non-GAAP financial measures to the most directly comparable GAAP measures.

                                                                                                                                                                  3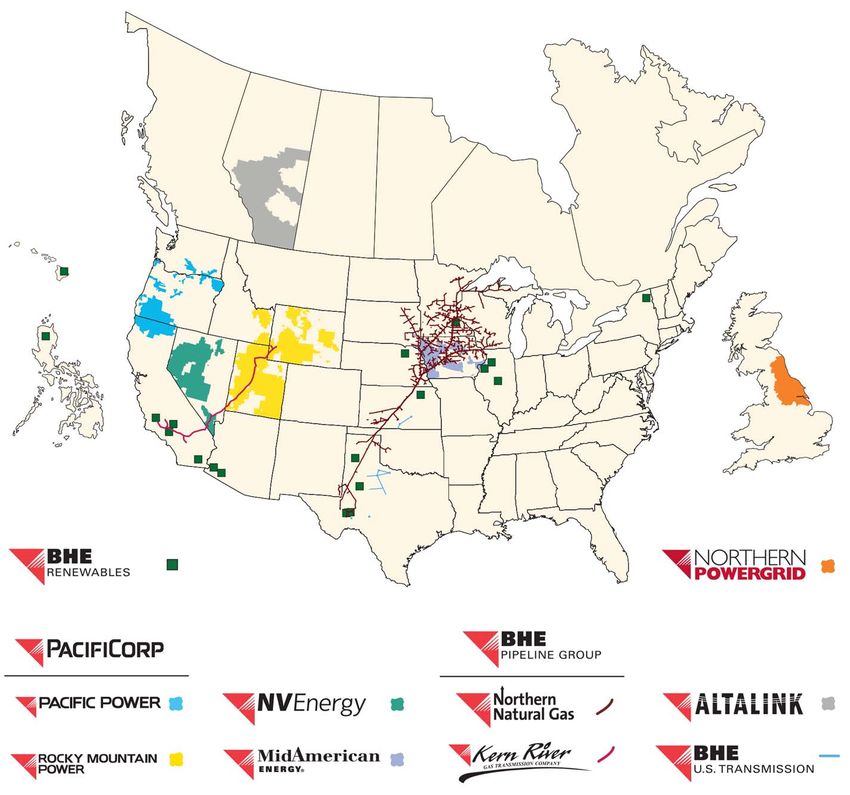
Berkshire Hathaway Energy

                                                      Vision
To be the best energy company in serving our customers, while delivering sustainable energy solutions

                                                     Culture
                                        Personal responsibility to our customers

                                                    Strategy
Reinvest in our businesses                                                 Invest in internal growth
• Continue to invest in our employees and                                  • Pursue the development of a value-enhancing
  operations, maintenance and capital                                        energy grid and gas pipeline infrastructure
  programs for property, plant and equipment                               • Create customer solutions through innovative
• Position our regulated businesses to meet                                  rate design and redesign
  changing customer expectations and retain                                • Grow our portfolio of renewable energy
  customers (reduce bypass risk) by providing
  excellent service and competitive rates                                  • Develop strong grid systems, including
                                                                             cybersecurity and physical resilience programs
• Reduce the carbon footprint of our operations
  by participating in energy policy development,
  resulting in the transformation of our
  businesses and assets
                                                         Acquire companies
• Advance grid resilience, cybersecurity and             • Additive to business model
  physical security programs

                                     Competitive Advantage
                                             Berkshire Hathaway ownership

                                                                                                                         4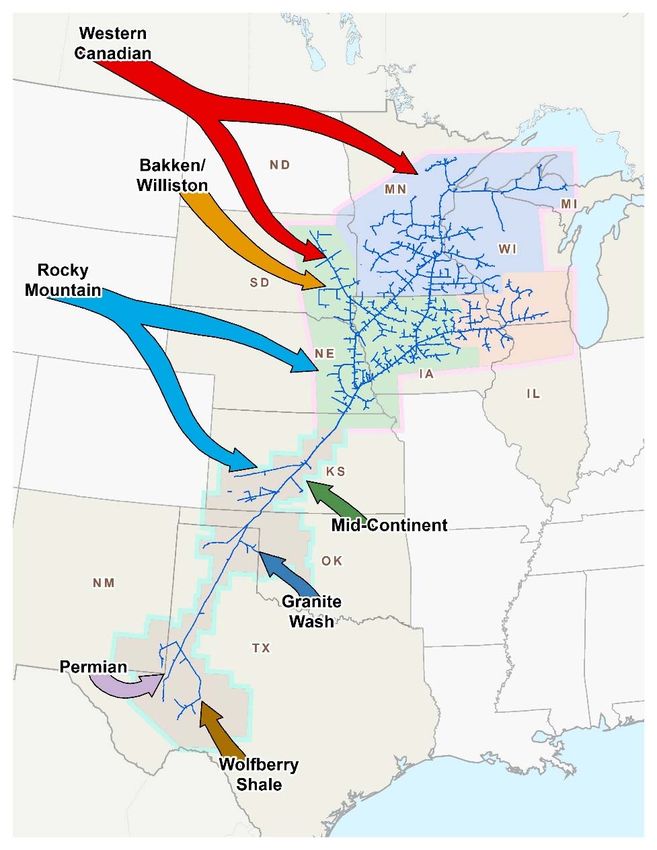
BHE GT&S Acquisition Overview
•   On July 3, 2020, BHE entered into a Purchase and Sale Agreement (GT&S PSA) with Dominion Energy, Inc. (DEI) and
    Dominion Energy Questar Corp. (Dominion Questar) to purchase substantially all of the natural gas transmission and
    storage business of Dominion for an equity purchase price of $4.0 billion and assuming approximately $5.7 billion of debt
    resulting in an enterprise value of $9.7 billion. The transaction included:
        – Pipeline and Storage Business: acquiring premier interstate pipeline companies with stable, demand-driven customers
             with long-term contracts
                • Includes 100% of Eastern Gas Transmission and Storage (EGTS; formerly Dominion Energy Transmission),
                    Questar Pipeline (expected close after receipt of HSR Approval, which is anticipated in early 2021) and Carolina
                    Gas Transmission; and 50% of Iroquois Gas Transmission System
        – Cove Point: acquiring 25% of the total limited partnership interests and 100% of the general partnership interest, resulting
             in a 25% economic ownership interest in Cove Point LNG, which is one of six liquefied natural gas export facilities in the
             United States. Post-closing, BHE will be the operator of Cove Point
•   On October 5, 2020, DEI and Dominion Questar, as permitted under the terms of the GT&S PSA, delivered notice to BHE
    of their election to terminate the transaction with respect to the acquisition of Questar Pipeline and its related entities. On
    the same date, BHE and Dominion Questar entered into a second purchase and sale agreement (Q-Pipe PSA) which
    separated the Questar companies from the other GT&S assets to enable a two-step closing. The acquisition of the Questar
    companies includes an equity purchase price of $1.3 billion and the assumption of $430 million of existing long-term debt
•   On November 1, 2020, BHE completed its previously announced purchase of a majority of DEI’s natural gas transmission
    and storage business (exclusive of the Questar companies) for an equity purchase price of $2.7 billion and assumed
    approximately $5.3 billion in debt resulting in an enterprise value of $8.0 billion
•   On November 2, 2020, BHE delivered the Q-Pipe Cash Consideration of $1.3 billion to DEI as required under the Q-Pipe
    PSA, subject to the terms and conditions thereof (including Dominion Questar’s previously disclosed repayment obligation if
    the Q-Pipe Transaction does not close). BHE expects to close in early 2021 on the remaining Questar companies upon
    FTC approval
•   BHE financed the acquisition with 4.0% perpetual preferred stock issued to certain subsidiaries of Berkshire Hathaway Inc.
    for $3.75 billion, which represents the equity purchase price, net of cash acquired and post-closing adjustments
•   BHE intends to pay down approximately $1.2 billion of maturing debt at Eastern Energy Gas Holdings (formerly Dominion
    Energy Gas Holdings) over the next year to strengthen the balance sheet and support its existing credit ratings                     5
Organizational Structure
2019 Berkshire Hathaway Inc. ($ billions)
Revenue         $ 254.6
Net Income(1)   $ 81.4                                                                                 Aa2/AA
Equity          $ 424.8
                                                                                                         90%

2019 Berkshire Hathaway Energy ($ billions)
Revenue         $ 19.8
Net Income      $ 3.0                                                                                    A3/A-

Equity          $ 32.4

                                                                                                                                         A/A(1)
      A1/A+ (1)                                                         Aa2/A+ (1)                                                   S&P / DBRS
  Regulated Electric                       Baa2/A-                   Regulated Electric                    Baa1/A-                 Alberta Canada
       Utility                        Holding Company                 and Gas Utility                 Holding Company           Regulated Transmission

                         Regulated                   Contracted                        Real Estate                                                                                              A2/A
                          Electric                 Non-utility Power               Brokerage, Mortgage                                            Regulated Natural                       Regulated Natural
                       Transmission                  Generation                      and Franchises                                               Gas Transmission                        Gas Transmission

                          Nevada Power         Sierra Pacific Power                       Northern Powergrid      Northern Powergrid                       Eastern Energy Gas
                            Company                  Company                               (Northeast) Ltd.         (Yorkshire) plc                          Holdings, LLC         Modular LNG,
                                                                                                                                                                 Baa1/A          Other Minor Assets
                             A2/A+(1)               A2/A+(1)                                      A3/A                    A3/A
                         Regulated Electric     Regulated Electric                          U.K. Regulated          U.K. Regulated
                              Utility            and Gas Utility                          Electric Distribution   Electric Distribution

(1) Warren Buffett’s 2019 Berkshire Hathaway Shareholder Letter states – “The components of that figure are                                   EGTS, Carolina Gas,
                                                                                                                                              Iroquois (A3/BBB+)        Cove Point LNG
    $24 billion of operating earnings, $3.7 billion of realized capital gains and a $53.7 billion gain from an increase
                                                                                                                                               Regulated Natural         25% Interest
    in the amount of net unrealized capital gains that exist in the stocks we hold.”
                                                                                                                                               Gas Transmission
(2) Ratings for PacifiCorp, MidAmerican Energy Company, Nevada Power Company, Sierra Pacific Power Company
    and AltaLink L.P. are senior secured ratings
                                                                                                                                                                                                         6
Diversity in Our Portfolio

Berkshire Hathaway Energy’s regulated energy businesses serve customers and
end-users across 28 U.S. states, and in Great Britain and Canada

                 Our integrated utilities serve approximately 5.1 million U.S. customers;
DISTRIBUTION     Northern Powergrid has 3.9 million end-users in northern England, making it
                 the third-largest distribution company in Great Britain
                 We own significant transmission infrastructure in 15 states and the province
TRANSMISSION     of Alberta; with our assets at PacifiCorp, NV Energy and AltaLink, we are the
                 largest transmission owner in the Western Interconnection
                 Northern Natural Gas and Kern River combined transported approximately
PIPELINES        8% of the total natural gas consumed in the U.S. during 2019. The addition
                 of BHE GT&S will further increase our strong market position
                 As of September 30, 2020, we owned 34,055 MW of power capacity in
GENERATION       operation and under construction, with resource diversity and a growing
                 renewable portfolio
                 As of September 30, 2020, we had invested $33 billion in solar, wind,
RENEWABLES       geothermal and biomass generation, and have commitments to spend an
                 additional $3 billion on wind generation by 2022

                                                                                              7
Energy Assets

                    As of and for the LTM ended
                                9/30/20

                  Assets                   $109.2 billion

                  Revenues                  $20.0 billion

                  Customers(1)                9.0 million

                  Employees                       22,100

                  Transmission Line               34,000
                  Miles

                  Natural Gas Pipeline            16,300
                  Miles

                  Power Capacity           34,055 MW(2)
                  Renewables                       42%
                  Natural Gas                      32%
                  Coal                             25%
                  Nuclear and Other                 1%

                (1) Includes both electric and natural gas
                    customers and end-users worldwide.
                    Additionally, AltaLink serves
                    approximately 85% of the population in
                    Alberta, Canada
                (2) Net MW owned in operation and under
                    construction as of September 30, 2020

                                                         8
Energy Assets including BHE GT&S
 The acquisition of BHE GT&S adds geographic diversification

                                                             Pro Forma(1)
                                               Assets                        $121.8 billion

                                               Revenues                        $21.9 billion

                                               Employees                              23,850

                                               Natural Gas Pipeline                   22,000
                                               Miles

                                               (1) Pro forma assets and revenues include amounts
                                                   from Eastern Energy Gas Holdings, LLC’s pro
                                                   forma balance sheet (adjusted to remove (i) $2.3
                                                   billion of affiliated note receivables and $0.9 billion
                                                   of pension and other postretirement benefit plan
                                                   assets not acquired by BHE) as of June 30, 2020,
                                                   and (ii) pro forma statement of income for the year
                                                   ended December 31, 2019, as included in Exhibit
                                                   99.1 to its Form 8-K/A filed with the SEC on
                                                   November 5, 2020

                                                                                                             9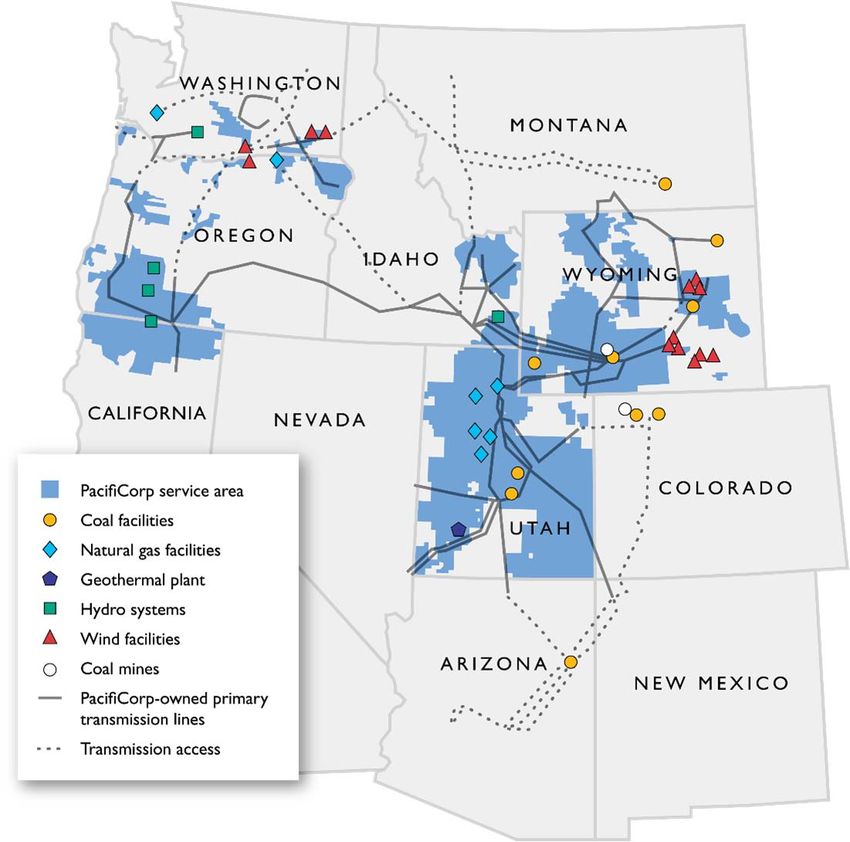
Competitive Advantage

• Diversified portfolio of regulated assets
   – Weather, customer, regulatory, generation, economic and catastrophic
     risk diversification
• Berkshire Hathaway ownership
   – Access to capital from Berkshire Hathaway allows us to take advantage
     of market opportunities
   – Berkshire Hathaway is a long-term holder of assets which promotes
     stability and helps make Berkshire Hathaway Energy the buyer of choice
     in many circumstances
   – Tax appetite of Berkshire Hathaway has allowed us to receive significant
     cash tax benefits from our parent, including $1.0 billion in the nine
     months ended September 30, 2020, and $942 million in 2019
• No dividend requirement
   – Cash flow is retained within the business and used to help fund growth
     and strengthen our balance sheet
                                                                              10
COVID-19 Update
Retail Electric Sales (Actual)
• Retail Sales – Electric retail customer volumes Year-to-Date
decreased 1.9% primarily due to the impacts of September 30 Variance
COVID-19 which resulted in lower commercial and (GWh) 2020 2019 Actual Percent
industrial usage and higher residential customer PacifiCorp
usage. Retail sales were positively impacted by Residential 12,699 12,213 486 4.0%
favorable weather as well as an increase in the Commercial, Industrial & Other 28,064 29,315 (1,251) -4.3%
Total 40,763 41,528 (765) -1.8%
average number of customers at PacifiCorp
MidAmerican Energy
• Operations – There have been no material Residential 5,226 5,105 121 2.4%
disruptions in the delivery of energy services to date, Commercial, Industrial & Other 14,801 14,697 104 0.7%
and there have been no material disruptions resulting Total 20,027 19,802 225 1.1%
from supply chain risks NV Energy
Residential 10,573 9,573 1,000 10.4%
• Cost Deferral Commercial, Industrial & Other 15,408 16,307 (899) -5.5%
– PacifiCorp – In March and April 2020, Total 25,981 25,880 101 0.4%
PacifiCorp filed applications requesting Northern Powergrid
authorization to defer costs associated with Residential 9,173 8,841 332 3.8%
Commercial, Industrial & Other 14,554 16,540 (1,986) -12.0%
COVID-19. Utah, Oregon and Idaho have Total 23,727 25,381 (1,654) -6.5%
approved and Wyoming has given preliminary
BHE Consolidated
approval. Approval in Washington is pending. Residential 37,671 35,732 1,939 5.4%
California has approved a request to establish a Commercial, Industrial & Other 72,827 76,859 (4,032) -5.2%
specific deferral account Total 110,498 112,591 (2,093) -1.9%
– MidAmerican Energy – In May 2020, the IUB issued an order authorizing MidAmerican Energy to use a regulatory
asset account to record and track increased costs and other financial impacts associated with COVID-19
– NV Energy – In March 2020, the PUCN issued an emergency order for Nevada Power and Sierra Pacific Power to
establish regulatory asset accounts related to the costs of maintaining service to customers affected by COVID-19
– Northern Powergrid – As part of the regulatory mechanism, lost revenue is recovered in future regulatory periods
generally with a two-year time lag. Equally, any supplier bad debts are recovered in future regulatory periods
11Capital Expenditures and Cash Flows
• Berkshire Hathaway Energy and its subsidiaries will spend approximately $19.4 billion(1) from
2020 – 2022 for growth and operating capital expenditures, which primarily consist of new wind
generation project expansions, repowering of existing wind facilities, and transmission and
distribution capital expenditures
$9,000
$8,000
$7,000
$6,000
Free Cash Flow
($ millions)
$5,000
$4,000
$3,000
$2,000
$1,000
$-
2015A 2016A 2017A 2018A 2019A 2020F 2021F 2022F
BHE Cash Flow from Operations BHE Total Capital Expenditures BHE Operating Capital Expenditures
2020 – 2022: $2.4 Billion Free + 2020 – 2022: $11.5 Billion Free
Cash Flow above Total Capex Cash Flow above Operating Capex
(1) Projections exclude BHE GT&S
12Regulatory Overview
Adjustment Mechanisms
Capital Renewable Energy
Fuel Recovery Transmission Forward
Recovery Rider Efficiency Decoupling
Mechanism Rider Test Year
Mechanism (REC/PTC/ZEC) Rider
PacifiCorp
Utah (1)
Wyoming (1)
Idaho
Oregon
Washington
California
MidAmerican Energy
Iowa – Electric
Illinois – Electric
South Dakota – Electric
Iowa – Gas
Illinois – Gas
South Dakota – Gas
NV Energy
Nevada Power
Sierra Pacific Power – Electric
Sierra Pacific Power – Gas
(1) PacifiCorp has relied on both historical test periods with known and measurable adjustments, as well as forecast test periods 13Revenue and Net Income Diversification
• Diversified revenue sources reduce regulatory concentrations
• For the last 12 months ended September 30, 2020, 80% of adjusted net income was from investment-
grade regulated subsidiaries. A significant portion of the remaining non-regulated adjusted net income
is from contracted generation assets at BHE Renewables
BHE LTM 9/30/20 BHE LTM 9/30/20
Energy Revenue(1): $15 Billion Adjusted Net Income(2): $3.4 Billion
Other HomeServices
Alberta 4% 7%
5% Nevada PacifiCorp
20% 21%
United BHE
Kingdom Renewables
7% 13%
FERC
8% BHE
Transmission
6%
Idaho
2%
Washington
Iowa
2%
16%
Illinois
BHE Pipeline MidAmerican
3%
California Group Funding
4% 12% 23%
Wyoming
6% Northern
Oregon Utah Powergrid NV Energy
8% 15% 7% 11%
• The addition of the BHE GT&S assets, acquired November 1, 2020, provide further diversification to the energy
revenue and adjusted net income amounts provided above
(1) Excludes HomeServices and equity income, which add further diversification
(2) Percentages exclude BHE and Other. See appendix for a detailed reconciliation of net income adjustments 14Net Income
($ millions) LTM Years Ended
Net Income Attributable to BHE 9/30/2020 12/31/2019 12/31/2018
PacifiCorp 776 $ 773 $ 739
MidAmerican Funding 854 781 669
NV Energy 416 365 317
Northern Powergrid 247 256 239
BHE Pipeline Group 448 422 387
BHE Transmission 230 229 210
BHE Renewables 491 431 329
HomeServices 256 160 145
BHE and Other (328) (240) (218)
(1)
Adjusted Net Income attributable to BHE 3,390 3,177 2,817
Unrealized Gain/(Loss) on BYD, net of Income Taxes 1,745 (227) (383)
2017 Tax Reform Benefits - - 134
Net Income attributable to BHE $ 5,135 $ 2,950 $ 2,568
(1) See appendix for a detailed reconciliation of net income adjustments
15Berkshire Hathaway Energy
Financial Summary
• Since being acquired by Berkshire Hathaway in March 2000, Berkshire Hathaway Energy
has realized significant growth in its assets, equity, net income and cash flows
Property, Plant and Equipment (Net) BHE Shareholders’ Equity
$ billions $ billions
$80 $73.3 $75.3 $40 $36.8
$65.9 $68.1 $32.4
$60 $32 $28.2 $29.6
$24
$40
$16
$20 $6.5 $8
$1.7
$0 $0
2001 2017 2018 2019 9/30/20 2001 2017 2018 2019 9/30/20
Net Income Attributable to BHE(1) Cash Flows From Operations
$ billions $ billions
$3.5 $3.2 $3.4 $7.5 $6.8
$2.6 $2.8 $6.1 $6.2 $6.1
$2.8 $6.0
$2.1 $4.5
$1.4 $3.0
$0.7 $1.5 $0.8
$0.1
$0.0 $0.0
2001 2017 2018 2019 LTM 2001 2017 2018 2019 LTM
9/30/20 9/30/20
(1) Starting in 2017, net income reflects adjusted net income. See appendix for detailed reconciliation
16Long-Term Perspective
Growing the Business
• We have significantly grown our assets while de-risking the business since being acquired by Berkshire Hathaway in
2000, reducing total debt(1) / total assets from 58% to 42% and improving our credit ratings
$120 $8,000
12/31/01 – 9/30/20 CAGR
Total Assets 12% $7,000
Net Income and Cash Flows From Operations
$100
Net Income 18%
Cash Flows From Operations 11% $6,000
Total Assets & Total Debt
$80
$5,000
($ billions)
($ millions)
$60 $4,000
$3,000
$40
$2,000
$20
$1,000
$- $-
2001 2002 2003 2004 2005 2006 2007 2008 2009 2010 2011 2012 2013 2014 2015 2016 2017 2018 2019 LTM
Sept.
Total Assets Total Debt Net Income(2)
Cash Flows From Operations 2020
(1) Total debt excludes junior subordinated debentures and Berkshire Hathaway Energy trust preferred securities. As of September 30, 2020,
$100 million of junior subordinated debentures remained outstanding
(2) Starting in 2017, net income is adjusted net income. See appendix for detailed reconciliation
17Power Diversification
2006 BHE Power Capacity – 16,386 MW 9/30/2020 BHE Power Capacity – 34,055 MW
Geothermal Coal
Hydro 1% 25%
Geothermal
Coal 4%
3%
Total Hydro 58% Solar
Renewables 8% 5%
16% Total
Wind Renewables
42%
5%
Nuclear and
Other Natural Gas
3% 32%
Wind
32%
Natural Gas
Nuclear and
23%
Other
1%
2006 BHE Power Generation – 83 TWh LTM 9/30/2020 BHE Power Generation – 118 TWh
Geothermal Coal
Geothermal Coal Hydro 2% 34%
Total 5% 74% 3%
Renewables(1) Hydro
12% Solar
5% Total
Wind 3%
Renewables(1)
2% 32%
Nuclear and
Other Wind
5% 24%
Natural Gas
9%
Natural Gas
Nuclear and
31%
Other
3%
• In 2006, Berkshire Hathaway Energy acquired PacifiCorp, and since this acquisition we have
significantly changed our generation mix by growing our renewable portfolio of assets
(1) All or some of the renewable energy attributes associated with generation from these generating facilities may be: (a) used in future years to comply with renewable
portfolio standards or other regulatory requirements, or (b) sold to third parties in the form of renewable energy credits or other environmental commodities 18Low-Cost Competitive Rates
Company Weighted Average Retail Rate ($/kWh)
U.S. National Average(1) $0.1071
Pacific Power $0.0925 14% lower than the U.S. National Average
Rocky Mountain Power $0.0779 27% lower than the U.S. National Average
MidAmerican Energy $0.0731 32% lower than the U.S. National Average
Nevada Power $0.1046 2% lower than the U.S. National Average
Sierra Pacific $0.0791 26% lower than the U.S. National Average
BHE Pipeline Group Mastio No. 1 for the 15th consecutive year
Highest Average Rates ($/kWh) by State(1): Hawaii – $0.2880; Vermont – $0.1567;
New York – $0.1432; Michigan – $0.1164; Arizona – $0.1154
(1) Source: Edison Electric Institute (Winter 2020) Total Retail
19Strong Credit Profile
Credit ratios continue to support our credit ratings
Credit Metrics
FFO Interest Coverage FFO / Debt Debt / Total Capitalization
LTM LTM LTM
(1)
Credit Ratings Average 9/30/20 2019 2018 Average 9/30/20 2019 2018 9/30/20 2019 2018
Berkshire Hathaway Energy(2) A3 / A- 4.5x 4.6x 4.5x 4.5x 15.8% 15.4% 15.8% 16.3% 55% 57% 57%
Regulated U.S. Utilities
PacifiCorp(2) (3) A1 / A+ 4.8x 4.6x 4.7x 5.1x 19.7% 17.7% 19.1% 22.3% 49% 48% 47%
MidAmerican Energy(2) (3) Aa2 / A+ 6.5x 6.3x 6.5x 6.8x 22.3% 22.1% 21.3% 23.4% 48% 50% 47%
Nevada Power(2) (3) A2 / A+ 4.9x 4.8x 5.1x 4.8x 25.9% 24.8% 29.8% 23.0% 46% 46% 49%
Sierra Pacific Power(2) (3) A2 / A+ 6.2x 5.2x 6.7x 6.8x 21.9% 19.7% 24.0% 22.0% 46% 46% 48%
Regulated Pipelines and Electric Distribution
Northern Natural Gas A2 / A 8.9x 9.3x 8.9x 8.6x 34.3% 38.5% 32.8% 31.5% 36% 38% 37%
AltaLink, L.P.(3) –/A/A 3.2x 4.0x 2.7x 2.9x 11.3% 11.9% 10.6% 11.3% 60% 60% 60%
Northern Powergrid Holdings Baa1 / A- 4.7x 5.1x 4.7x 4.4x 17.1% 17.4% 16.6% 17.2% 43% 44% 42%
Northern Powergrid (Northeast) A3 / A
Northern Powergrid (Yorkshire) A3 / A
Eastern Energy Gas Holdings Baa1 / A
(1) Moody’s / S&P / DBRS. Ratings are issuer or senior unsecured ratings unless otherwise noted
(2) Refer to the appendix for the calculations of key ratios
(3) Ratings are senior secured ratings
20Capital Investment Plan
$8,000 7,524
6,880
$7,000 6,228 6,341 Capex Current Plan Prior Plan
$6,000 by Type 2020-2022 2020-2022 Variance
5,060
($ millions)
$5,000 4,455 Operating $ 10,692 $ 8,837 $ 1,855
$4,000 Wind Generation
3,906 3,670 236
$3,000 (Growth)
$2,000 Other Growth 2,681 2,112 569
$1,000 Electric Transmission
2,170 2,420 (250)
$- (Growth)
2020 2020 2021 2021 2022 2022
Total $ 19,449(1) $ 17,039 $ 2,410
Current Prior Current Prior Current Prior
Operating Wind Generation (Growth)
Other Growth Electric Transmission (Growth)
Capex Current Plan Prior Plan
$8,000 7,524
6,880 by Business 2020-2022 2020-2022 Variance
$7,000 6,341
6,228 PacifiCorp $ 6,283 $ 6,555 $ (272)
$6,000
5,060 MidAmerican Funding 5,949 3,764 2,185
($ millions)
$5,000 4,455 NV Energy 2,432 1,669 763
$4,000 Northern Powergrid 1,989 1,865 124
$3,000 BHE Pipeline Group 1,546 1,559 (13)
$2,000 BHE Renewables 292 244 48
$1,000 BHE Transmission 900 1,227 (327)
$- HomeServices and
2020 2020 2021 2021 2022 2022 58 156 (98)
Other
Current Prior Current Prior Current Prior
Total $ 19,449(1) $ 17,039 $ 2,410
PacifiCorp MidAmerican Funding NV Energy
Northern Powergrid BHE Pipeline Group BHE Renewables (1) Projections exclude BHE GT&S
BHE Transmission HomeServices and Other 21PacifiCorp
• Six-state service territory
‒ Utah – Oregon
‒ Idaho – Washington
‒ Wyoming – California
• 5,150 employees
• 1.9 million retail electricity customers
• 141,400 square miles of service territory
• 16,600 transmission line miles
• 64,600 miles of distribution lines and 900
substations
(1)
• 12,059 MW owned capacity by fuel type:
9/30/20 3/31/06
Wind 19% 0%
Coal 47% 72%
Natural Gas 25% 13%
Hydro and other 9% 15%
(1) Net MW owned in operation and under construction as of September 30, 2020 22PacifiCorp – Business Update
• Actual retail load for the nine months ending September 30, 2020, was 40,763 GWh; a 765 GWh
(1.8%) decrease compared with the same time period last year, primarily due to unfavorable
industrial and commercial performance mainly in the extraction industries in Wyoming and Utah
• Energy Vision 2020 project nearing completion
– Completed construction of a new 140-mile, 500 kV transmission line and 230 kV substation
– Completed repowering of 999 MW of existing company-owned wind facilities
– New wind projects in construction totaling approximately 950 MW (TB Flats I & II, Ekola Flats and Cedar
Springs II), and an additional 200 MW of wind procured through a power purchase agreement
• Between 700 MW and 760 MW will be completed in 2020 (weather dependent), with the rest
completed in 2021
• Projects delayed to 2021 will remain eligible for the full 10 years of 100% production tax credits
(PTC), under revised IRS rules passed in early 2020
• Incremental Renewable Resources
– In construction, the 240 MW Pryor Mountain wind project in Carbon County, Montana, is scheduled to
have at least 80 MW complete in 2020 with the remaining portion of the project finished in 2021
– Acquired remaining 21.2% ownership in the 41 MW Foote Creek I wind facility. PacifiCorp now owns
100% of the capacity of Foote Creek I, and repowering is scheduled to be complete by December 2020
– Executed a purchase option agreement to acquire the Foote Creek II-IV facilities. Simultaneously,
executed a $35 million investment in turbine equipment, which secured a 60% PTC safe harbor position
to repower Foote Creek II-IV and other potential projects by 2024
23Regulatory Update
• Rate case filings in Pacific Power states of Oregon, Washington and California result in
customer price reductions while achieving full recovery for all Energy Vision 2020 investments,
wildfire investments, accelerated coal depreciation in Oregon and Washington, and converting
Washington from a western control area methodology to a full PacifiCorp system transmission
and renewables methodology for cost recovery
• Rate case filings in Rocky Mountain Power states reflect no customer price increase in Wyoming
and a modest customer rate increase in Utah while achieving full recovery for all Energy Vision
2020 investments and wildfire investments. Proposed 2021 rates will be lower than 2017 rates.
In response to a procedural delay in the Wyoming rate case, a deferral application was filed to
reflect the incremental depreciation expense from the latest depreciation study until the new rate
goes into effect in 2021. Reached agreement to defer a rate case in Idaho from 2020 to 2021
• A new interjurisdictional cost allocation methodology was approved in Idaho, Oregon, Utah and
Wyoming; approval is pending in Washington as part of the general rate case
• Energy cost adjustment mechanisms exist in all six states where PacifiCorp has operations
• A new customer generation program was implemented in California and Idaho to transition from
net metering to an export credit model that provides financial compensation for excess energy
exported to the grid rather than kilowatt-hour netting. The Utah transition program was closed,
and a new customer generation program went into effect to implement the full export credit
model
242019 Integrated Resource Plan
• PacifiCorp’s 2019 Integrated Resource Plan (IRP) drives the development of the generation
resource and transmission projects needed to cost-effectively and reliably serve PacifiCorp’s
customers, and it is updated every two years
– PacifiCorp’s 2019 IRP was acknowledged by the Utah and Oregon commission in May 2020 and
the Idaho commission in September 2020
– Regulatory review of the 2019 IRP is proceeding in accordance with the established schedule in
Wyoming
• The 2019 IRP outlined an action plan that includes issuing an all-source request for proposals
(RFP) to procure resources consistent with the preferred portfolio that could come online by the
end of 2024
– PacifiCorp's 2020 RFP initial shortlist was identified and shared with independent evaluators. The
initial shortlist includes a total of 6,982 MW of new generation and storage capacity. Of the total,
5,652 MW are new generation resources (represented by 3,173 MW of solar generation and
2,479 MW of wind generation) and an additional 1,330 MW of new battery storage assets, which
includes 1,130 MW of solar collocated battery storage and 200 MW of stand-alone battery
storage
– A final shortlist of winning bids will be identified by June 2021 following a new transmission
cluster study that will identify the least-cost, least-risk resources in combination with required
transmission upgrades to interconnect resources
• The 2019 IRP further projects a continued trajectory of declining CO2 emissions. Relative to a
2005 baseline, system CO2 emissions are forecast to be down 59% by 2030 and 90% by 2050
25PacifiCorp
September 2020 Storm Response
• PacifiCorp’s six-state territory experienced the following weather events in early September:
– Rocky Mountain Power (Utah, Idaho and Wyoming)
• Hurricane-force winds exceeding 110 mph were recorded in Utah
• 225,000 peak customers without power September 8, 2020
• External mutual assistance was requested, and personnel from MidAmerican Energy, NV Energy
and INTREN sent resources. A total of 1,138 individuals were assigned storm duty response
• Customers were impacted by the storm beginning September 7, 2020, and by September 14, 2020
99.9% of customers were restored power
– Pacific Power (California and Oregon)
• A severe weather event resulting in high winds, low humidity and warm temperatures contributed to
several major wildfires, private and public property damage, and widespread power outages in
Oregon and California
• 60,000 peak customers without power September 8, 2020
• 500 internal and external personnel responding
• On September 13, 2020, PacifiCorp activated the company’s first ever PSPS event in the city of
Weed, California, located in Siskiyou County, due to forecast high winds, low humidity, dry
conditions and reduced availability of fire suppression services
• Customers were impacted by the storm beginning September 7, 2020, and by September 14, 2020
98% of customers were restored power
• PacifiCorp’s six-state service territory:
– Storms and fires damaged approximately 470 transmission poles and more than 1,000 distribution poles
26Pacific Power September 2020 Wildfires
• A severe weather event resulting in high winds, low humidity and warm temperatures contributed to
several major wildfires, private and public property damage, personal injuries and loss of life and
widespread power outages in Oregon and California (2020 wildfires)
– Wildfires spread over certain parts of PacifiCorp’s service territory and surrounding areas in Oregon and
California. Certain of the wildfires are still burning and are at various levels of containment
– Investigations into the cause and origin of each wildfire are complex and ongoing
– Although investigations are not complete, several civil actions (including a putative class action) have
been filed in Oregon on behalf of citizens who suffered damages from fires allegedly caused by
PacifiCorp assets
– Final determinations of liability will be made following comprehensive investigations and litigation
processes
• In California, under the doctrine of inverse condemnation, courts have held investor-owned utilities
liable for property damage and associated interest and attorneys’ fees where its facilities are a
substantial cause of a wildfire that caused the property damage, even if the utility is not at fault. To
date, no lawsuits arising from the 2020 wildfires have been filed in California
• PacifiCorp has accrued its best estimate of the potential losses associated with the 2020 Wildfires that
are considered probable of being incurred. Given the early stages of the investigations into the cause
and origin of the 2020 wildfires and the uncertainty surrounding potential damages, it is reasonably
possible PacifiCorp may incur additional losses beyond the amounts accrued; however, PacifiCorp is
currently unable to estimate the range of possible losses that could be incurred
• PacifiCorp has some level of insurance coverage that may apply to damages caused by wildfires, but it
may not be sufficient to cover all such damages. PacifiCorp has accrued its best estimate of the
expected probable insurance recovery associated with the estimated losses accrued 27PacifiCorp Wildfire Risk & Mitigation
• PacifiCorp developed a comprehensive wildfire mitigation plan in 2018 to respond to
changing conditions throughout the West and partnered with industry colleagues and
state and federal government officials, among others, to address the wildfire threat in
the West
• PacifiCorp’s wildfire mitigation plan was developed in partnership with emergency
services leaders, as well as local and statewide authorities. Collaboration has been
essential, as wildfire mitigation requires careful coordination with neighboring utilities,
critical community services, first responders, regulatory and legislative leaders and
customers
• PSPS is a relatively new measure of last resort used to reduce risks in designated
high fire risk areas. PacifiCorp helped pioneer proactive de-energization in Oregon,
Washington and Utah by developing its own plan two years ago, and continues to
update that plan based on experience and changing conditions, including ensuring
consideration of the needs of medically vulnerable customers, emergency personnel
and other critical services like hospitals
• PacifiCorp’s Utah, Oregon, Washington and California wildfire programs require
PSPS watch monitoring, additional inspections, fire protection relay control
adjustments and specific site wind monitoring
28Wildfire Initiatives
• Utah’s Governor Gary Herbert signed House Bill 66, Wildland Fire Planning and Cost
Recovery, which requires the company to prepare a wildland fire protection plan to be
approved by the Utah Public Service Commission with all investments, including the
cost of capital, made to implement an approved plan recoverable in rates. Some
liability protections are instituted as long as the company is in compliance with its
approved plan
• The California Public Utilities Commission conditionally approved PacifiCorp’s 2020
Wildfire Mitigation Plan in June 2020, subject to general requirements to make
quarterly reports describing advancements in risk modeling, risk spend efficiency
analysis and efforts to reduce the impacts of proactive de-energization
• Pacific Power’s President and CEO participated on Oregon Governor Kate Brown’s
Council on Wildfire Response, and the company supported subsequent (but failed)
legislation to require wildfire mitigation plans be approved by the Oregon Public Utility
Commission
– Governor Brown issued an executive order in March 2020, directing the Oregon
Public Utility Commission to evaluate electric companies’ risk-based wildfire mitigation
plans
– The Oregon Public Utility Commission initiated a rulemaking in August 2020 to
consider wildfire mitigation planning
29Klamath River Dam Removal
• PacifiCorp has been involved for over a decade in efforts to potentially remove four dams on the Klamath
River in southern Oregon and northern California. For the past four years, those efforts have focused on efforts
to implement the amended Klamath Hydroelectric Settlement Agreement (KHSA), a settlement between
PacifiCorp, the states of California and Oregon, several tribes, the U.S. Department of the Interior,
environmental groups and other Basin stakeholders
• The KHSA charts a pathway for potential dam removal under FERC’s license transfer and surrender
processes. It provides $450 million for dam removal by a third-party entity – $200 million capped cost
contribution from PacifiCorp’s California and Oregon customers, and another $250 million from a California
water bond. The settlement also indemnifies PacifiCorp against claims arising from dam removal
• PacifiCorp in 2016 filed an application with FERC seeking to transfer its license to the dam removal entity
under the settlement agreement the non-profit Klamath River Renewal Corporation (KRRC). If FERC approved
the transfer, the KRRC would seek to surrender the license and remove the dams
• California and Oregon utility commissions authorized PacifiCorp’s $200 million contribution to dam removal
surcharges, finding that the cost cap and indemnification provided a less risky outcome for customers
compared to the unknown, and uncapped, costs of obtaining a new FERC license or decommissioning the
project
• On July 16, 2020, FERC declined to transfer the license to the KRRC. FERC found that while the KRRC’s
project budget fell within the funding available under the settlement, a potential for cost overruns remained.
Accordingly, FERC ruled that it would only allow KRRC and PacifiCorp to become co-licensees for dam
removal. PacifiCorp has until January 2021 to decide whether it will accept co-licensee status with the KRRC
• The FERC decision is not in line with the core liability and cost cap protections for PacifiCorp in the settlement.
PacifiCorp accordingly initiated dispute resolution under the KHSA, and is currently negotiating with its
settlement partners to develop a solution that will retain those core protections while allowing dam removal to
move forward
30Oregon Renewable Energy Legislation
• Oregon Clean Electricity and Coal Transition Plan signed into law by Governor Kate Brown in
March 2016
– Doubled renewable energy portfolio standard to 50%
• 20% by 2020, 27% by 2025, 35% by 2030, 40% by 2035, 50% by 2040
• Incorporates renewable energy credit banking provisions
– Removes coal costs from Oregon rates by January 1, 2030
– Allows PTCs to be annually adjusted as part of a Net Power Cost Adjustment
• Oregon Executive Order 20-04 issued by Governor Kate Brown in March 2020
– Directs several state agencies to prioritize actions that reduce greenhouse gas emissions in a cost-
effective manner and sets new greenhouse gas reduction goals by setting targets of a 45% reduction
below 1990 levels by 2035, and an 80% reduction by 2050. A rulemaking process at multiple agencies is
underway
• PacifiCorp is well-positioned to satisfy these requirements with its ongoing renewable energy
portfolio transformation; all coal assets are fully depreciated in Oregon rates by January 1, 2030
31Washington Renewable Energy Legislation
• Washington Senate Bill 5116 and House Bill 1211 – Clean Energy Transformation Act
– Key provisions:
• Coal out of rates by 2025
• 80% renewable by 2030 with compliance options for remaining 20%
• 2% cost cap measured over a four-year compliance period; if the cost cap is triggered, the utility is
deemed to be in compliance
• Compliance penalty = $100/MWh with multiplier depending on type of fossil generation
• Sets mandate of 100% carbon free electricity sector by 2045
– PacifiCorp is participating in extensive rule-making activities and serves on a working group to align
requirements of the new law with regional electricity markets
– PacifiCorp is regularly in discussions with regulators and other Washington investor-owned utilities
regarding compliance obligations and implementation
– PacifiCorp’s all-party settlement filing in the 2020 Washington rate case removes coal from Washington
rates by 2023. As a result, the amount of renewables serving Washington customers nearly doubles,
while lowering customer rates
32Electric Vehicle Initiatives
• California’s Governor Gavin Newsom signed Executive Order N-79-20 on September 23, 2020,
directing the California Air Resources Board to require that, by 2035, all new cars and passenger
trucks sold in California be zero-emission vehicles. The California Air Resources Board will be
taking regulatory action to effectuate the Executive Order
• Oregon’s Governor Kate Brown, who is chair of the Western Governors Association, announced
the Electric Vehicle Roadmap Initiative that lays out the path to the adoption of zero-emission
technology, including tax exemptions and consumer incentives and building the electric vehicle
infrastructure needed across the West
• Washington’s Governor Jay Inslee signed Senate Bill 5811, which directs the Washington
Department of Ecology to adopt the motor vehicle emissions standards of California, including
the zero-emission vehicle program. The result of this legislation is that more electric and zero
emission vehicles will be available for purchase in the state
• Utah’s Governor Gary Herbert signed Senate Bill 396, which directs the Utah Public Service
Commission to allow Rocky Mountain Power to own and earn a return on up to $50 million in
electric vehicle charging infrastructure. This bill also prohibits third parties from generating
electricity onsite and selling that electricity directly to Rocky Mountain Power customers through
electric vehicle charging infrastructure
33Wyoming Coal Divestment Legislation
• Wyoming Governor Mark Gordon signed House Bill 200, Reliable and Dispatchable Low-Carbon
Energy Standards
– Under this bill, the Wyoming Public Service Commission (WPSC) is required to put in place a standard
specifying an unidentified percentage of the company’s electricity to be generated from coal-fueled
generation utilizing carbon capture technology
– Standard percentage is delegated to WPSC during the rulemaking process
– The legislation allows a higher rate of return for utility investments in carbon capture technology with a
maximum customer cost increase of up to 2%
• Governor Gordon signed Senate File 159, effective July 2019, that requires electric utilities to
make a good-faith effort to sell a coal-fueled generation facility in Wyoming before it can receive
recovery in rates for capital costs associated with new generation facilities built to replace the
retiring coal facility
– If the plant is successfully sold, the electric utility is obligated to purchase the electricity from the facility
through a power purchase agreement at a price that is no greater than the utility’s avoided cost and
recoverable in rates from Wyoming customers
– The Wyoming Legislature amended the bill in the 2020 session to allow industrial customers to pursue
limited market access only for electricity generated from one of the company’s retiring coal plants. Due to
environmental constraints, underlying dispatch economics and the need for long-term customer
commitments, the company’s bypass risk is limited
34MidAmerican Energy
• Headquartered in Des Moines, Iowa
• 3,400 employees
• 1.6 million electric and natural gas customers
in four Midwestern states
IOWA (1)
• 11,586 MW of owned capacity
• Owned capacity by fuel type:
9/30/20(1) 12/31/00
Wind(2) 61% 0%
Coal 23% 70%
MidAmerican Energy service area
Natural Gas 12% 19%
Major generating facilities
Operational wind farms
Nuclear and other 4% 11%
(1) NetMW owned in operation and under construction as of September 30, 2020
Wind farms to begin generating in 2020 (2)
All or some of the renewable energy attributes associated with generation from
these generating facilities may be: (a) used in future years to comply with
renewable portfolio standards or other regulatory requirements or (b) sold to third
parties in the form of renewable energy credits or other environmental
commodities
35MidAmerican Energy –
Business Update
• Customer growth, warmer-than-normal summer weather and improved
industrial sales increased retail electric sales 226 GWh for the nine-months
ended September 30, 2020, a 1.1% increase over the same period in 2019
• Manageable impact of COVID-19 on retail sales, predominantly to
commercial customers; likely increase to bad debt expense potentially
recoverable outside of base rate cases in Iowa and Illinois
• A derecho storm on August 10, 2020, caused $56 million of damage to
MidAmerican Energy’s electric system, $22 million of which was charged to
expense; impact financially manageable due to pre-storm returns that were in
excess of revenue sharing threshold
• Other generation projects
– Additional cost-effective wind and solar generation and storage projects
continue to be evaluated in an effort to maintain and further expand the
company’s renewable commitment to retail customers
36MidAmerican Energy
Wind Development Update
Estimated Planned
Project Approval Date Cost Capacity Completion Additional Notes
Completed in Qualifies for 100% of eligible PTC
Wind XI 2016 $3.2 billion 2,000 MW
January 2020 rate; PTCs are retained by the
Wind XII 2018 $922 million 592 MW Q4 2020 company
Qualifies for 100% of eligible PTC
Wind XII
$315 million 207 MW Q4 2020 rate; not subject to ratemaking
Expansion
principles
Proceeding without pre-
Pocahontas Closed Not eligible for PTCs (seller utilized
authorization sought $22 million 80 MW
Prairie March 2020 ITC)
from the IUB
Qualifies for 100% of eligible PTC
Contrail $214 million 112 MW Q4 2020 rate; not subject to ratemaking
principles
• Wind repowering
– PTCs reinstated for another 10-year period, some at reduced rates
– Improved capacity factors from longer blades, more efficient equipment resulting in greater generation
– GE fleet
• $1,156 million incurred, including AFUDC
• 706 turbines, comprising 1,059 original MW
• 100% PTC rate for all projects
– Siemens fleet
• $276 million incurred through September 30, 2020, including AFUDC
• 333 turbines, comprising 766 original MW to be repowered in 2019-2021 at 80% of full PTC rate
• 176 turbines, comprising 407 original MW to be repowered in 2022 at 60% of full PTC rate 37NV Energy Overview
• Headquartered in Las Vegas, Nevada, with
territory throughout Nevada
• 2,400 employees
• 1.3 million electric and 172,000 gas customers
• Service to 90% of Nevada’s population, along
with tourist population on average of 56 million
• 4,235 miles of transmission line (>69 kilovolts)
• 5,756 megawatts(1) of owned power generation
Nevada Power Sierra Pacific
• Provides electric services • Provides electric and gas
to Las Vegas and services to Reno and
surrounding areas northern Nevada
• 960,000 electric customers • 356,000 electric customers
• 4,384 megawatts of owned and 172,000 gas customers
power capacity • 1,372 megawatts of owned
power capacity
(1) Net megawatt owned in operation as of September 30, 2020 38NV Energy – Business Update
• Retail load growth
– Nevada Power – Actual retail sales for the nine months ending September 30, 2020, were 17,763 GWh,
an increase of 84 GWh relative to the same period in 2019. This is due to hotter summer weather
compared to last year and increases in residential load due to impacts of COVID-19. Residential load
was up 11.2%, small commercial was down 3.9%, industrial was down 9.8%, and distribution-only
service was down 11.5% compared to the same time last year
– Sierra Pacific Power – Actual retail sales for the nine months ending September 30, 2020, were 8,218
GWh, an increase of 17 GWh relative to the same period in 2019, primarily due to hotter summer
weather compared to last year and increases in residential load due to impacts of COVID-19. Residential
load was up 7.2%, small commercial was up 0.3%, large commercial was down 6.1%, and distribution-
only service was up 3.9%
• NV Energy’s 2020 IRP amendment filing
– In July 2020, NV Energy filed an amendment to the IRP seeking approval of:
• Two power purchase agreements for 328 MW of solar photovoltaic generation and 238 MW of integrated
battery storage, plus a company-owned 150 MW solar photovoltaic facility with 100 MW of integrated
battery storage
• Greenlink Nevada consisting of two 525 kV transmission lines that provide access to remote renewable
energy zones within Nevada and potential future renewable energy imports
– The amendment was subsequently bifurcated, separating out Greenlink Nevada as Phase II
– A modification was filed October 7, 2020, impacting only Phase II to reverse the order of construction of
the two transmission lines in Greenlink Nevada
– The commission is expected to issue an order on the original amendment application in December 2020,
and on Phase II in March 2021
39NV Energy – Business Update
• Renewables
– Renewable portfolio standard
• Senate Bill 358 increased the renewable portfolio standard to 50% by 2030
• NV Energy is positioned to comply with the renewable portfolio standard ahead of 2030
– NV Energy has 10 renewable energy projects in development or under construction for a total of
2,241 MW via power purchase agreements of solar photovoltaic generation, including 690 MW of
integrated battery storage. Commercial operation dates for the projects range from November 2020
to December 2023
– NV Energy has an additional three renewable energy projects, including the 150-megawatt Dry Lake
Solar company-owned project, pending Public Utilities Commission of Nevada approval, totaling
478 MW of solar photovoltaic generation and 338 MW of integrated battery storage by fourth quarter
2023
• Natural disaster mitigation plan
– Nevada Legislature enacted Senate Bill 329 for the prevention of natural disasters, including
wildfires; legislation requires NV Energy to recover costs associated with the plan through a
separate rate rider
– In June 2020, NV Energy filed an application seeking approval of the first natural disaster protection
plan that included procedures to prevent or respond to a fire or other natural disaster, with regulatory
approval received August 2020
– NV Energy executed extensive wildfire preparation efforts in advance of the 2020 fire season
– In October 2020, the new natural disaster protection plan rider was placed on customer bills
40NV Energy – Business Update
• 704B applications
– There are no pending applications before the Public Utilities Commission of Nevada for customers
pursuing the statutory right to utilize an alternative energy provider
• The Nevada Legislature amended the 704B statute to establish annual limits on the total amount of
energy and capacity that eligible customers may be authorized to purchase from wholesale energy
providers and established licensing provisions for alternative energy providers
• NV Energy has developed new tariffs that allow for market-based energy products to large
customers. New customers are eligible for the Market Price Energy tariff, which includes an energy
supply contract based on market prices. The customer price stability tariff was filed for Nevada
Power and Sierra Pacific to allow existing large customers to secure a fixed energy component for a
five-year term tied to new renewable contracts (decision from the Public Utilities Commission of
Nevada is expected in December 2020)
– Customer satisfaction survey scores continue to climb toward best-in-class results
• Nevada Power general rate review
– Triennial general rate review filed in June 2020, requesting a $120 million reduction in annual revenue
requirement for rates effective January 2021 through December 2023
– Approved stipulation includes a $120 million one-time bill credit to customers plus an annual revenue
requirement reduction of $93 million ($1.1 billion total revenue requirement), utilizes a return on earnings
of 9.4%, and makes certain agreed-upon adjustments to rates and fees
– Hearings were held in October 2020 to determine whether the earnings sharing mechanism ordered by
the Public Utilities Commission of Nevada in 2017 will continue. Order is expected by December 2020
41You can also read


