2020 Fiscal Plan for the Puerto Rico Electric Power Authority - AAFAF
←
→
Page content transcription
If your browser does not render page correctly, please read the page content below
2020 Fiscal Plan for the
Puerto Rico Electric Power Authority
            As certified by the Financial Oversight and Management
                              Board for Puerto Rico on June 29, 2020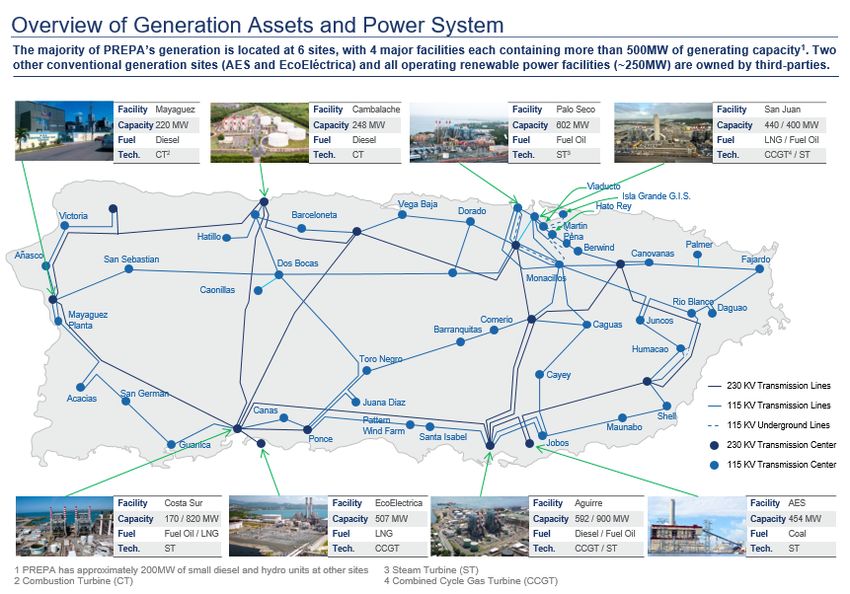
Disclaimer
The Financial Oversight and Management Board for Puerto Rico (the “FOMB,” or “Oversight
Board”) has formulated this 2020 Fiscal Plan based on, among other things, information
obtained from the Commonwealth of Puerto Rico (the “Commonwealth,” or the
“Government”).
This document does not constitute an audit conducted in accordance with generally accepted
auditing standards, an examination of internal controls or other attestation or review services
in accordance with standards established by the American Institute of Certified Public
Accountants or any other organization. Accordingly, the Oversight Board cannot express an
opinion or any other form of assurance on the financial statements or any financial or other
information or the internal controls of the Government and the information contained herein.
This 2020 Fiscal Plan is directed to the Governor and Legislature of Puerto Rico based on
underlying data obtained from the Government. No representations or warranties, express or
implied, are made by the Oversight Board with respect to such information.
This 2020 Fiscal Plan is not a Title III plan of adjustment. It does not specify classes of claims
and treatments. It neither discharges debts nor extinguishes liens.
This 2020 Fiscal Plan is based on what the Oversight Board believes is the best information
currently available to it. To the extent the Oversight Board becomes aware of additional
information after it certifies this 2020 Fiscal Plan that the Oversight Board determines
warrants a revision of this 2020 Fiscal Plan, the Oversight Board will so revise it.
For the avoidance of doubt, except as otherwise expressly provided, the Oversight Board does
not consider and has not considered anything in the 2020 Fiscal Plan as a “recommendation”
pursuant to Section 205(a). Nevertheless, to the extent that anything in the 2020 Fiscal Plan
is ever deemed by the Governor or Legislature or determined by a court having subject matter
jurisdiction to be a “recommendation” pursuant to Section 205(a), the Oversight Board hereby
adopts it in the 2020 Fiscal Plan pursuant to PROMESA Section 201(b).
Any statements and assumptions contained in this document, whether forward-looking or
historical, are not guarantees of future performance and involve certain risks, uncertainties,
estimates, and other assumptions made in this document. The economic and financial
condition of the Government and its instrumentalities is affected by various legal, financial,
social, economic, environmental, governmental, and political factors. These factors can be very
complex, may vary from one fiscal year to the next, and are frequently the result of actions
taken or not taken, not only by the Government and the Oversight Board, but also by other
third-party entities such as the government of the United States. Examples of these factors
include, but are not limited to:
■   Any future actions taken or not taken by the United States government related to Medicaid
    or the Affordable Care Act;
■   The amount and timing of receipt of any distributions from the Federal Emergency
    Management Agency and private insurance companies to repair damage caused by
    Hurricanes María and Irma, earthquakes, and the COVID-19 pandemic;
■   The amount and timing of receipt of any amounts allocated to Puerto Rico and provided
    under the Community Disaster Loans Program;
■   The amount and timing of any additional amounts appropriated by the United States
    government to address the impacts of the COVID-19 pandemic;
■   The amount and timing of receipt of any additional amounts appropriated by the United
    States government to address the funding gap described herein;

                                                1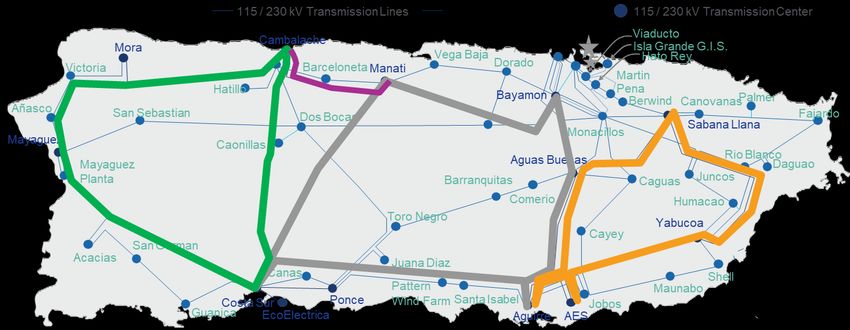
■   The timeline for completion of the work being done by the Puerto Rico Electric Power
    Authority (“PREPA”) to repair PREPA’s electric system and infrastructure and the impact
    of any future developments or issues related to PREPA’s electric system and infrastructure
    on Puerto Rico’s economic growth;
■   The impact of the COVID-19 pandemic on the financial, social, economic, and
    demographic condition of Puerto Rico;
■   The impact of the measures described herein on outmigration; and
■   The impact of the resolution of any pending litigation in the Title III cases
Because of the uncertainty and unpredictability of these factors, their impact cannot be
included in the assumptions contained in this document. Future events and actual results may
differ materially from any estimates, projections, or statements contained herein. Nothing in
this document should be considered as an express or implied warranty of facts or future
events; provided, however, that the Government is required to implement the measures in this
2020 Fiscal Plan and the Oversight Board reserves all its rights to compel compliance. Nothing
in this document shall be considered a solicitation, recommendation, or advice to any person
to participate, pursue or support a course of action or transaction, to purchase or sell any
security, or to make any investment decision.
By receiving this document, the recipient is deemed to have acknowledged the terms of these
limitations. This document may contain capitalized terms that are not defined herein or may
contain terms that are discussed in other documents or that are commonly understood. You
should make no assumptions about the meaning of capitalized terms that are not defined, and
you should refer questions to the Oversight Board at comments@oversightboard.pr.gov
should clarification be required.

                                                2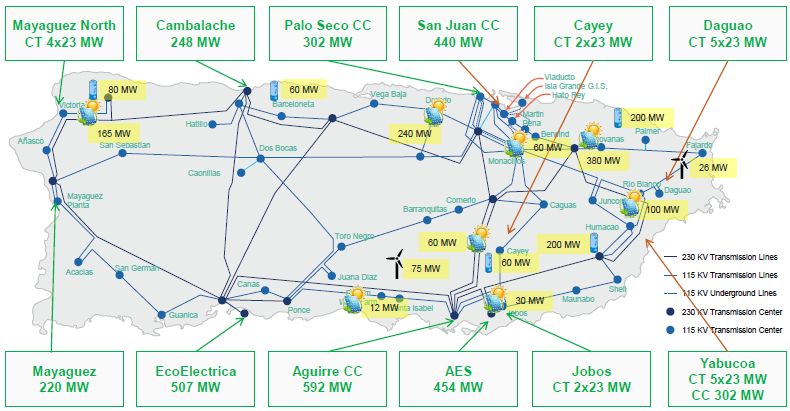
List of Acronyms and Key Terms
AAFAF          Puerto Rico Fiscal Agency and Financial Advisory Authority
Act 120-2018   Puerto Rico Electric Power System Transformation Act
Act 17-2019    Puerto Rico Energy Public Policy Act
Act 211-2018   Act for the Implementation of the Puerto Rico Public Service Regulatory Board
               Reorganization Plan
Act 57-2014    Puerto Rico Energy Transformation and RELIEF Act
BBA            Bipartisan Budget Act of 2018
CDBG           Community Development Block Grant
CDBG-DR        Community Development Block Grant Disaster Recovery
CILT           Contribution in Lieu of Taxes
COR3           Central Office of Recovery, Reconstruction, and Resiliency
COVID-19       Coronavirus Disease 2019
DER            Distributed Energy Resource
DG             Distributed Generation
EE             Energy Efficiency
EPA            Environmental Protection Agency
ERS            Employee Retirement System
FAASt          FEMA Advanced Award Strategy Initiative
FEMA           Federal Emergency Management Agency
FERC           Federal Energy Regulatory Commission
FOMB           Financial Oversight and Management Board for Puerto Rico
GNP            Gross National Product
GWh            Gigawatt-hour
HUD            Department of Housing and Urban Development
IPP            Independent Power Producer
IRP            Integrated Resource Plan
KWh            Kilowatt-hour
LNG            Liquified Natural Gas
MATS           Mercury & Air Toxics Standards
MWh            Megawatt-hour
NME            Necessary Maintenance Expenses
NYSE           New York Stock Exchange
O&M            Operations and Maintenance
OIPC           Oficina Independiente de Protección al Consumidor
P3A            Puerto Rico Public-Private Partnerships Authority
PMO            Project Management Office
PPA            Power Purchase Agreement
PPOA           Power Purchase and Operating Agreement
PREB           Puerto Rico Energy Bureau
PREPA          Puerto Rico Electric Power Authority
PRM            Planning Reserve Margin
PROMESA        Puerto Rico Oversight, Management, and Economic Stability Act (2016)
PW             Project Worksheet
PV             Photovoltaics
RFP            Request for Proposal
RFQ            Request for Quotation
RPS            Renewable Portfolio Standard
RSA            Restructuring Support Agreement
SAIDI          System Average Interruption Duration Index
SAIFI          System Average Interruption Frequency Index

                                           3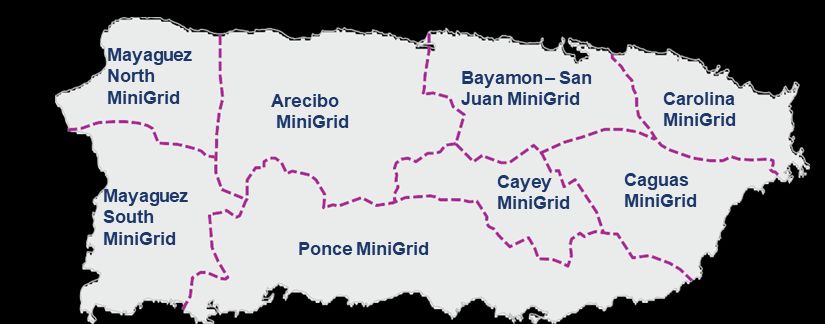
SOQs     Statements of Qualifications
T&D      Transmission and Distribution
TDOMA    T&D O&M Agreement
TWh      Terawatt-hour
US DOE   United States Department of Energy
WTI      West Texas Intermediate

                                   4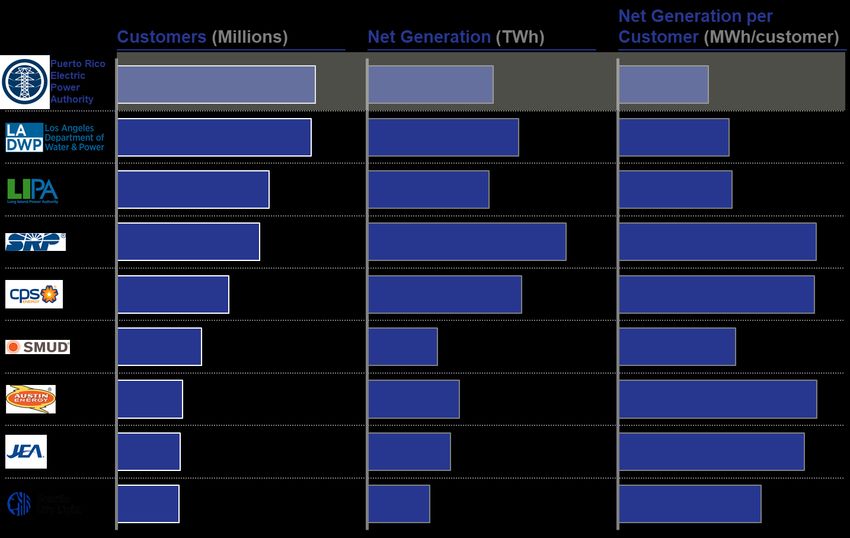
Table of Contents
    Executive Summary ..................................................................................................... 9
          Historical Context and Current Challenges ..................................... 12
    Key Facts about PREPA ............................................................................................. 12
    Historical Challenges Leading to the Transformation Mandate ............................. 13
    Governance Structure ................................................................................................ 15
    Current State of T&D ................................................................................................. 16
    Current State of Generation ...................................................................................... 18
    Customer Demographics and Affordability ..............................................................20
    Overview of Historical Financial Performance ........................................................ 22
    Adverse Effects of FY2020 Major Catastrophic Events............................................ 25
          Transformation .............................................................................. 27
    Introduction to the Energy Sector Transformation ................................................. 27
    Energy Sector Transformation Vision, Objectives, and Framework .......................28
    T&D Transformation Overview ................................................................................30
    Generation Transformation Overview ..................................................................... 32
          Regulatory Structure ...................................................................... 36
    Overview of Regulatory Structure and Key Legislation .......................................... 36
    Key Regulatory Issues ............................................................................................... 37
    Overview of CILT Reform .......................................................................................... 39
          Summary of Financial Projections .................................................. 41
    Overview of Revenue Rate Requirement .................................................................. 41
    FY2021 Baseline and Future Revenues and Expenses .............................................. 44
          Revenue .......................................................................................... 48
    Overview of Load Projections ...................................................................................48
    Other assumptions ..................................................................................................... 51
          Expenses: GenCo and GridCo .......................................................... 53
    Overview of PREPA GenCo and GridCo Expenses ................................................... 53
    Overview of GenCo Expense Projections................................................................... 54
    Overview of GridCo Expense Projections.................................................................. 55
          Risks and System Resilience ........................................................... 57
    Climate Change .......................................................................................................... 57
    Earthquakes ............................................................................................................... 58
    Economic Shocks (e.g., COVID-19) ............................................................................ 59
          Operational Measures .................................................................... 61
    Overview .................................................................................................................... 61

                                                            5
Key Accomplishments for FY2020 ............................................................................ 61
Overview of FY2021 Measures .................................................................................. 62
Summary of Operational Measures .......................................................................... 71
Debt Service .................................................................................. 72
Overview of PREPA Debt ........................................................................................... 72
Implications of Unrestructured Debt for Rate Projections ...................................... 72
Debt Sustainability Analysis ..................................................................................... 73
Federal Funding ............................................................................ 75
Overview .................................................................................................................... 75
FEMA-Funded Emergency Work .............................................................................. 77
FEMA-Funded Permanent Work............................................................................... 78
Federal Funding Impact ............................................................................................ 79
Post-certification Reporting ..........................................................80
Conclusion .................................................................................... 84
APPENDIX ....................................................................................................... 85
Resource Planning and Resiliency................................................. 86
Overview of the Integrated Resource Plan (IRP) .....................................................86
Overview of Microgrid and Minigrid Development ................................................. 87
Status of Grid Modernization Efforts ........................................................................ 87
6List of Exhibits
Exhibit 1: Key PREPA Statistics Compared to Peers ............................................................... 12
Exhibit 2: PREPA Governance Structure until Transformation ............................................. 15
Exhibit 3: PREPA Governing Board Composition................................................................... 16
Exhibit 4: PREPA Transmission Loops ................................................................................... 17
Exhibit 5: PREPA Generation Assets ....................................................................................... 19
Exhibit 6: 2019 PREPA Customer Count and Consumption by Municipality ........................20
Exhibit 7: Puerto Rico Electrical Share of Wallet Compared to Peer Regions ........................ 21
Exhibit 8: PREPA Has Operated under a Deficit since FY2000 ............................................. 22
Exhibit 9: FY2020 Gross Revenues per Month ....................................................................... 24
Exhibit 10: FY2020 Budgeted and Actual Income and Expenditure ...................................... 25
Exhibit 11: Energy Sector Transformation – Current and Future State .................................. 29
Exhibit 12: Key Milestones in T&D Operator Transition Process ........................................... 31
Exhibit 13: Proposed Key Milestones for Generation Operator(s) RFP .................................. 33
Exhibit 14: IRP Energy System Modernization Scenario ........................................................ 34
Exhibit 15: Projected Generation Mix...................................................................................... 35
Exhibit 16: PREB Regulatory Structure ................................................................................... 37
Exhibit 17: Overall Rate Composition...................................................................................... 39
Exhibit 18: Pre-measure Revenue Rate Required Including Full Legacy Debt and Pension
(c/kWh) .................................................................................................................................... 42
Exhibit 19: Post-measure Rate with Illustrative Pension Reform and Excluding Debt
(c/kWh) .................................................................................................................................... 43
Exhibit 20: Rate Projection Comparison to Prior Fiscal Plans (c/kWh, Nominal Dollars) .... 44
Exhibit 21: FY2021 Financial Projections ................................................................................ 45
Exhibit 22: 30-Year Sales and Revenue Projections ............................................................... 46
Exhibit 23: 30-Year Load Forecast Line Charts with and without DG ................................... 46
Exhibit 24: Consolidated Forecast Expenses, Excluding Debt Service ($ Million) ................ 47
Exhibit 25: 30-Year Load Forecast with the Individual Effects of 3 Drivers Causing a
Reduction in Load....................................................................................................................48
Exhibit 26: Commonwealth of Puerto Rico Population and GNP Projections ....................... 49
Exhibit 27: Cumulative Energy Efficiency Savings by Program (GWh) ..................................50
Exhibit 28: 30-Year Distributed Generation Forecast by Customer Class (TWh) .................. 51
Exhibit 29: Fuel Price Forecast ................................................................................................ 52
Exhibit 30: Pre- and Post-transaction Expense Breakdown ................................................... 53
Exhibit 31: Expense Forecast for GenCo ($ Million) ............................................................... 55
Exhibit 32: 5-Year GridCo Expense Forecast Excluding Pension ($ Million) ......................... 55
Exhibit 33: 30-Year GridCo Headcount Projections ............................................................... 56
Exhibit 34: Impact of Climate Effects on Net Present Value ................................................... 58
Exhibit 35: Change in Fuel Mix Following Earthquake Damage to Costa Sur Power Plant ... 59
Exhibit 36: Employee Safety Metrics .......................................................................................68
Exhibit 37: Comparison of Funding Options with and without Full Funding in FY2021 ....... 69
Exhibit 38: Total Rates Including Debt Prior to Restructuring (c/kWh) ................................ 73
Exhibit 39: FEMA Public Assistance Received by Agency ...................................................... 76
Exhibit 40: FY2020 Emergency Work Reimbursements ....................................................... 78
Exhibit 41: Geographic Location of Minigrids......................................................................... 87
7List of Tables
Table 1: Reliability Metrics Before and After Hurricane Maria Compared to Peer Group
Average .................................................................................................................................... 13
Table 2: PREPA FY2013 to FY2019 Statement of Net Position .............................................. 23
Table 3: Transformation Objectives ........................................................................................28
Table 4: Milestones for T&D and Generation Transformation ...............................................30
Table 5: Energy Efficiency Programs .......................................................................................50
Table 6: Additional Assumptions ............................................................................................ 52
Table 7: Assumptions for GenCo and GridCo Expenses .......................................................... 53
Table 8: PPOA Renegotiation Action Plan .............................................................................. 63
Table 9: Generation Upgrades Action Plan ............................................................................. 63
Table 10: Fuel Supply Action Plan ........................................................................................... 64
Table 11: Customer Service Improvements Action Plan .......................................................... 65
Table 12: Energy Grid Management and Modernization Action Plan .................................... 67
Table 13: Personnel Projects Action Plan ................................................................................ 69
Table 14: Working Capital Action Plan .................................................................................... 70
Table 15: P3 Projects and T&D Front-End Transition Action Plan ......................................... 71
Table 16: Illustrative Sustainable Debt Capacity Sizing ($ Million) ........................................ 74
Table 17: Reporting Cadence .................................................................................................. 80
Table 18: Reports on Non-Operational Measures .................................................................. 80
Table 19: Reports on Operational Measures ........................................................................... 81
8Executive Summary
The 2020 Fiscal Plan lays out a path for the operational and financial
reorganization of the Puerto Rico Electric Power Authority (PREPA) and the
transformation of Puerto Rico’s energy system.
Puerto Rico’s energy system lags national standards due to decades of
operational and financial mismanagement. Delayed capital projects keep the system
vulnerable and increase rates. Lack of long-term planning results in PREPA’s system being
technologically outdated and operationally inefficient. Delays in vegetation management and
routine maintenance make the system unreliable every day — 35 to 45% of all service outages
have been caused by tree trimming conditions.1 Macroeconomic challenges, including a
declining population and stagnant economy further negatively affect PREPA’s financial
condition. Puerto Rico’s ratepayers spend a higher share of income on an electricity service
that falls in the bottom quartile of peer utilities in terms of reliability.
PREPA’s operational shortcomings and failure to adjust rates to cover its rising
costs led to the accumulation of significant legacy debt and pension obligations.
As of May 2017, PREPA held approximately $9 billion in debt obligations, while PREPA’s
current unfunded pension liability exceeds $4.9 billion, of which $3.8 billion is unfunded.2
These liabilities led PREPA to seek a restructuring of its legacy obligations through a voluntary
petition under Title III of the Puerto Rico Oversight, Management, and Economic Stability Act
(PROMESA).
After filing for Title III protection, Hurricanes Irma and Maria devastated the
electricity grid. More recently, key generation assets were damaged by a 6.4 magnitude
earthquake. The ongoing COVID-19 pandemic has further delayed much needed system
maintenance and improvements and has adversely impacted collections.
Puerto Rico’s energy system requires a comprehensive transformation to deliver
the safe, reliable, and affordable service that the Island’s citizens and businesses
deserve. The 2020 Fiscal Plan lays out a set of actions to accelerate progress on this
transformation, including improving operations, modernizing the transmission and
distribution system, upgrading the generation fleet, restructuring legacy obligations, and
transitioning to the private operation of its transmission and distribution operations as well
as existing generation assets. When fully implemented, the 2020 Fiscal Plan will set Puerto
Rico on a trajectory to achieve a safe, reliable, affordable, resilient, modern electric grid,
improving the quality of life of its citizens and enabling the economic activity.
During FY2020, PREPA made progress on several initiatives:
■ Successfully supporting the selection of an O&M operator – LUMA Energy, LLC (“LUMA”)
– for the Transmission and Distribution (T&D) system;
■ Completing the conversion of the San Juan Power Plant Units 5 and 6 to natural gas;
■ Reducing customer call wait times through call center outsourcing and increasing
customer accessibility to e-billing platforms;
■ Developing an integrated transformation and distribution system modernization plan
(T&D road map) and revised Integrated Resource Plan (IRP).3
1 “In Re: Review of Rates of the Puerto Rico Electric Power Authority.” 33. Revised November 23, 2016.
https://energia.pr.gov/wp-content/uploads/2016/11/Expert-Report-Revenue-Requirements-Fisher-and-Horowitz-Revised-
20161123.pdf
2 Based on independent actuarial study conducted in 2019 and asumming a rate of return of 4.5%.
3 The “T&D road map” includes a combination of recommendations used by PREPA to implement recommended capital
investments to modernize PREPA’s T&D system. The road map includes documentation of near-term plans, project
management methods, engineering requirements, and practical considerations needed to implement proposed capital
projects successfully.
9However, despite these efforts, much work remains to be done. Achieving a
comprehensive transformation of Puerto Rico’s energy system, reducing outage frequency and
duration, achieving rate affordability, improving service reliability, customer satisfaction and
ensuring system resiliency and preparedness against unforeseen events requires diligent
implementation of the following key initiatives:
■ Improving operations: Improve program management to ensure timely and on budget
completion of key operational initiatives, including vegetation management and proactive
maintenance programs.
■ Modernizing the transmission and distribution system: Develop and execute a
capital investment plan to modernize and strengthen the electrical grid.
■ Upgrading the generation fleet: Implement the PREB-approved IRP to modernize
generation resources and increase renewable energy generation.
■ Improving workforce and public safety: Increase the use of technology in grid
operations to improve workplace safety and protect the public against faulty
infrastructure.
■ Transitioning the operation and management of PREPA’s electricity grid and
generation assets to private operators: Support ongoing efforts to transfer the
responsibilities for operating and maintaining PREPA’s T&D and existing generation
assets to professional and independent private operators. On June 22, the Public-Private
Partnership Authority (P3A) announced the selection of LUMA as the new private T&D
operator.
■ Restructuring legacy debt obligations: Support ongoing efforts to restructure
PREPA’s existing, unsustainable debt load and regain access to capital markets.
■ Pension Reform: To balance rate affordability with PREPA’s pension obligations to its
employees, PREPA must review the ERS funding policy and incorporate revisions into
PREPA’s Title III plan of adjustment.
The Fiscal Plan shows a surplus in FY2020, but a deficit in FY2021 that is largely
due to the operator fee. At the end of FY2020, PREPA expects a $153 million surplus,
driven by underspending in vegetation management and necessary maintenance expenses.
Under the current PREB-approved rate case, the 2020 Fiscal Plan projects a deficit of $132
million in FY2021, which is due to the front-end transition fee to the T&D operator, which is
expected to be paid by the end of FY2021. PREPA is expected to pay this fee from cash on
hand, and their current cash reserve is approximately $510 million. For the remaining thirty
years, the budget is balanced as the 2020 Fiscal Plan projections assume revenue requirement
rates.
Over the next 30 years, the overall load in Puerto Rico’s electricity system is forecasted to
decline as a result of a shrinking population and declining economic activity. However, the
rate of decline is faster than overall consumption as customers leverage energy efficiency (EE)
and distributed generation (DG) to reduce their reliance on the grid.
Pre-measure rates (without debt restructuring, pension reform or impact from operational
initiatives) are expected to range between 27 and 30 c/kWh in real dollars between FY2021 to
FY2025.4 Post-measure rates (including an illustrative pension reform and operational
measures but excluding debt) range between 20 and 22 c/kWh in real dollars over the same
period. The transition from fossil fuel to renewable generation will increase costs over the
thirty-year period in order to allow PREPA to meet the Renewable Portfolio Standards (RPS)
mandated by Act 17-2019. In the long term, both pre-measure and post-measure rates could
4 FY2021 has been used as the base year to calculate values in real dollars.
10climb to approximately 31 c/kWh in real dollars, equivalent to 48 to 49 c/kWh in nominal
dollars, by FY2049.
To successfully execute on the Fiscal Plan and ensure progress toward the
transformation, PREPA must effectively manage several contingencies and risks.
The COVID-19 pandemic is expected to impact PREPA’s liquidity in the coming fiscal year,
while earthquake damage will generate significant repair costs in excess of insurance
recoveries. PREPA must also continue to maintain and prepare its system to withstand future
hurricanes and other weather events. Other contingencies include successfully reaching a debt
restructuring agreement and ensuring access to federal funding for reconstruction of damage
from the hurricanes and earthquakes. Successful transformation will require that PREPA
collaborate with, among others, the Oversight Board, the Puerto Rico Public-Private
Partnerships Authority (P3A), the Puerto Rico Fiscal Agency and Financial Advisory Authority
(AAFAF), the Puerto Rico Energy Bureau (PREB), the Central Office of Recovery,
Reconstruction and Resiliency (COR3) and PREPA’s customers.
The present fiscal plan, if implemented as required, will accelerate PREPA’s trajectory toward
a safe, resilient, and modern electric grid, providing reliable service to ratepayers and enabling
economic growth on the island. Over the next five years and beyond, a sweeping
transformation needs to take root in order for the people of Puerto Rico to access the safe,
reliable, modern energy system they deserve.
11Historical Context and Current Challenges
Key Facts about PREPA
The Puerto Rico Electric Power Authority (PREPA), formerly known as the Puerto Rico Water
Resources Authority until 1979, was created through Act No. 83 on May 2, 1941 (PREPA’s
Enabling Act). Throughout its history, PREPA has served as the sole retail energy service
provider in Puerto Rico. Until 2014, PREPA was self-regulated and operated without an
independent regulatory body to ensure accountability on long-term planning and rate setting.
PREPA currently serves approximately 1.5 million customers and generates approximately
$3.5 billion in revenues from 18 terawatt-hours (TWh) of electric energy.5 This is equivalent
to an annual net generation of roughly 12 megawatt-hours (MWh) of energy per customer. The
utility reached a maximum sustained load of 2,771 megawatts during FY2019.
PREPA Compared to Similar Public Utilities
PREPA is one of the largest public power utilities in the U.S. by number of customers served,
but has relatively low generation output and energy sales on a per customer basis (Exhibit 1).
EXHIBIT 1: KEY PREPA STATISTICS COMPARED TO PEERS6
PREPA’s reliability metrics have long fallen behind peer benchmarks. In 2019, the average
duration of power outage (SAIDI) was over six times higher than the average peer utility, while
the average frequency of outage (SAIFI) was over four times higher (Table 1).7 Although
PREPA has shown some improvement since 2017, these metrics, reported at the end of
FY2019, still place PREPA in the bottom quartile of peer utilities. The frequent and extended
outages faced by Puerto Rico’s citizens and businesses adversely impact quality of life and
5 Monthly Report to PREPA’s Governing Board, June 2019 (interim unaudited financial results).
6 Based on unaudited results from FERC as of 2018 and/or publicly available data in 2019, as well as publicly available reports.
Utilities surveyed include: Los Angeles Department of Water and Power; Long Island Power Authority; Salt River Project;
CPS Energy, Sacramento Municipal Utility District; Austin Energy; Jacksonville Electric Authority; Seattle City Light.
7 PREPA KPI reports.
12economic activity. In late May, as Puerto Ricans prepared for hurricane season, a cluster of
thunderstorms led to 70,000 reported outages in one day as a result of heavy rains.8
TABLE 1: RELIABILITY METRICS BEFORE AND AFTER HURRICANE MARIA COMPARED
TO PEER GROUP AVERAGE
PREPA PREPA Peer Group
Metric FY2019 FY2017 Average 20189
System Average Interruption Duration Index (SAIDI) 10.6 14.2 1.7
Hours per year
System Average Interruption Frequency Index (SAIFI) 4.3 4.8 1.1
Number of interruptions per year
Customer Average Interruption Duration Index (CAIDI) 2.5 2.9 1.6
Hours per year
Historical Challenges Leading to the Transformation
Mandate
PREPA is the sole electric power utility in Puerto Rico operating an exceptionally complex
energy system.10 Operating an electrical network on a mountainous, isolated, tropical island
with dense vegetation is challenging as it requires significant maintenance of often remote
transmission and distribution lines. Furthermore, the system cannot rely on access to a larger
regional power grid for power generation like most parts of the mainland. Even in this context,
Puerto Rico’s energy system lags national standards due to decades of operational and
financial mismanagement. PREPA’s operational shortcoming and failure to adjust rates to
cover its rising costs led to the accumulation of significant legacy debt and pension obligations.
The Puerto Rico electricity system requires a comprehensive transformation to deliver the
safe, reliable, and affordable service that customers should expect.
Several long-standing structural issues have led to PREPA’s current financial and operational
position:
■ Political influence in decision making: Historically, management decisions were
subject to political influence, leading to high management turnover, discontinuity in
capital investment plans, and an energy rate that is insufficient to cover day-to-day costs.
As a result, residents have faced fluctuating rates and poor reliability due to aging
infrastructure.
■ Lack of rate adjustments to cover costs: PREPA has operated under a fiscal deficit
since the early 2000s due to, among other things, failure to adjust rates consistently over
time and the lack of proactive collection from delinquent customers, including government
entities.
■ Macro-economic challenges. PREPA has been impacted by macro-economic
challenges faced by Puerto Rico in recent years. Puerto Rico’s economy began to
deteriorate, experiencing a 20% decline in real GNP since 2007, while growing out-
migration led to population decline of over 15% since 2004, shrinking PREPA’s revenue
base. Consequently, energy sales fell by 22% since peaking in 2007 and operating revenues
declined by 28% since FY2013.
■ Failing to manage the generation fleet mix and fuel costs. PREPA’s heavy reliance
on oil-based power generation in a system that passes fuel costs on to customers has
8 “Battered Caribbean prepares for hurricanes amid pandemic,” Associated Press, May 29, 2020.
9 Source: U.S. Energy Information Administration, Annual Electric Power Industry Report, released October 1, 2019.
10 American Public Power Association, Public Power 2018 Statistical Report, (2018), 17,
https://www.publicpower.org/system/files/documents/2018-Public-Power-Statistical-Report-Updated.pdf.
13resulted in volatile rates, challenging the ability of customers to pay. PREPA’s revenue
collections rates have historically declined as customer rates increased due to volatile
global oil prices. Between 2009 and 2014, PREPA’s fuel-adjustment rider increased by
around 45% when the oil price doubled from $60 to $120 per barrel.11,12 The combined
impact of lower sales and higher fuel prices contributed to high and volatile average
customer rates ranging from 20 to 30 c/ kWh.
■ Unsustainable debt and pension obligations: PREPA accumulated approximately
$9 billion in debt and nearly $4 billion in unfunded pension liabilities, while rates were
not increased to cover growing liabilities. Without debt restructuring, rate increases of 6 to
8 c/kWh would be required to adequately service the outstanding contracted debt,
amounting to a total rate of approximately 30 to 40 c/kWh over the next two decades,
depending on fuel prices.13 Fully funding its pension liabilities would require PREPA to
contribute $251 million between FY2022 and FY2049. PREPA is currently undergoing
debt restructuring under the Puerto Rico Oversight, Management, and Economic Stability
Act (PROMESA).
■ Underinvestment in grid maintenance and modernization: Given insufficient
revenues and rate increases, PREPA’s management has reduced or eliminated altogether
investments in maintenance and capital improvements. In recent years, capital
investments in the T&D system were limited to the most urgent projects to avoid imminent
system failure rather than to proactively improve the grid for the future. Consistent
underspending on vegetation management and other maintenance have resulted in a T&D
system susceptible to damage from hurricanes, earthquakes, and other unforeseen events.
In FY2019, PREPA reported spending none of the budget allocated for vegetation
management, even though lack of tree trimming was found to cause 35 to 45% of
unplanned outages.14 Consequently, Puerto Rico’s residents face frequent service
disruption and reliability metrics such as SAIDI and SAIFI, which indicate the duration
and frequency of average power system interruptions, far exceed that of PREPA’s
mainland peer U.S. utilities (see Table 1).
■ Aging and inefficient generation fleet: Failed efforts to diversify and upgrade
generation resources have resulted in an aged and inefficient generation fleet. PREPA
owns installed capacity of nearly 5,000 MW with an average age of 42 years, compared to
a national average of 18 years.15,16 Aging assets lead to operational challenges, including
lower operational flexibility as a result of slower ramp-up, a higher likelihood of outages,
increased costs per megawatt-hour generated, and limitations from environmental
regulations. Average fuel cost for a PREPA-owned natural gas unit is $82/MWh, while for
a unit built in the past 10 years, the typical fuel cost is $35/MWh.17 PREPA’s generation
fleet is also susceptible to fuel cost volatility from global oil market prices. In FY2019,
approximately 40% was oil-fired, compared to a US national average of about 4%, leaving
Puerto Rico’s citizens and businesses particularly vulnerable to changes in oil prices.18,19
11 PREPA, FY2009 Monthly Report (interim, unaudited financial results).
12 PREPA, FY2014 Monthly Report (interim, unaudited financial results).
13 Estimate based on calculations of unstructured legacy debt based on FY2019 load projections, as published in PREPA’s
June 2019 fiscal plan. After ten years, the cost declines.
14 “In Re: Review of Rates of the Puerto Rico Electric Power Authority.” 33. Revised November 23, 2016.
https://energia.pr.gov/wp-content/uploads/2016/11/Expert-Report-Revenue-Requirements-Fisher-and-Horowitz-Revised-
20161123.pdf
15 Excludes IPP installed capacity of 961 MW; all renewable energy plants are independently owned and contracted through
PPAs.
16 US Congress, Exploring Energy Challenges and Opportunities, 4.
17 FERC Form 1 Upstream Generation benchmark.
18 U.S. Energy Information Administration, Puerto Rico: Profile Overview, last modified November 21, 2019,
https://www.eia.gov/state/?sid=RQ.
19 Siemens Industry, Puerto Rico Integrated Resource Plan 2018-2019, RPT-015-19, rev. 2 (Schenectady, June 7, 2019), 7-
3, http://energia.pr.gov/wp-content/uploads/2019/02/PREPA-Ex.-1.0-IRP-2019-PREPA-IRP-Report.pdf.
14In light of these long-standing operational and financial challenges, the 2020 Fiscal Plan lays
a path towards the full transformation of Puerto Rico’s energy sector. This transformation is
described further in Chapter 3, “Transformation.”
Governance Structure
PREPA’s current governance structure reflects its role as the sole vertically integrated power
utility in Puerto Rico. PREPA’s Enabling Act established PREPA as a government
instrumentality subject to the control of its Governing Board. PREPA has also been subject to
the oversight of the Financial Oversight and Management Board for Puerto Rico after the
enactment of PROMESA in 2016. Further details on regulatory structure, including the role of
the Puerto Rico Energy Bureau (PREB) can be found in Chapter 4, “Regulatory Structure.”
The Governing Board is charged with the power to appoint the Executive Director or Chief
Executive Officer, as well as all other executive officers. To date, PREPA has nine directorates
responsible for all operations relating to the utility’s generation and T&D assets (Exhibit 2).
The PREPA Project Management Office and Office of Restructuring and Fiscal Affairs are
responsible for developing the fiscal plan and implementing and reporting progress on
initiatives to the PREPA Board of Directors and the Oversight Board. The Energy System
Operations Office oversees the economic dispatch of the electric system.
EXHIBIT 2: PREPA GOVERNANCE STRUCTURE UNTIL TRANSFORMATION
Governing Board
CEO Responsible for the dispatch of
the electric system
Project Management Office
Energy System Operations
Administrator
Transmission Planning and Human
Disaster Funds Customer
Information Generation and Environmental Legal Affairs Resources and Finance
Management Services
Technology Directorate Distribution Protection Directorate Labor Affairs Directorate
Office Directorate
Directorate Directorate Directorate
All operations related to the generation assets, Technical operations relating to the T&D infrastructure,
including budgeting and capital improvements. including the budget, which are ultimately divided by the
Ultimately divided by the generation facilities key geographic regions of the island
PREPA’s Governing Board is composed of seven members (Exhibit 3).
1. Three members are appointed by the Governor of Puerto Rico, with the advice and consent
of the Senate; these members are selected from a list of candidates prepared by a
professional recruitment firm.
2. Three members are appointed by the Governor at his or her sole discretion, one of which
must be independent and not an employee of any government entity.
3. One member is elected by PREPA’s customers to represent customer interests.
Additionally, Article 16 of Puerto Rico’s Fiscal Agency and Financial Advisory Authority’s
(AAFAF) Enabling Act provides that AAFAF’s Executive Director is a member of the Board of
Directors of any instrumentality of the Government of Puerto Rico that is designated as a
covered territorial instrumentality under PROMESA while such designation is in effect. Given
15PREPA’s designation as a covered territorial instrumentality, AAFAF’s Executive Director is
also a member of PREPA’s Governing Board.20
Governing Board members appointed by the Governor with the advice and consent of the
Senate serve staggered terms, while the members appointed at the Governor’s sole discretion
are considered at-will employees – except for the independent member, who serves a term of
five years. The customer interest representative also serves a term of five years.21
EXHIBIT 3: PREPA GOVERNING BOARD COMPOSITION
The current focus of the PREPA Governing Board is to support and implement the many
transformational measures outlined in the 2020 Fiscal Plan, including:
1. Supporting the transfer of T&D and generation operating and maintenance
responsibilities to professional private operators;
2. Supporting efforts to maximize federal funding allocations in order to invest in the repair
and strengthening of energy assets;
3. Implementing short-term operational and managerial reforms that will enhance service
quality, improve operational efficiency, enhance transparency and accountability, and
reduce political intervention; and
4. Supporting efforts to restructure PREPA’s legacy debt and pension obligations.
Current State of T&D
Puerto Rico’s T&D system is composed of three major transmission loops that move electric
generation from power plants concentrated along the southern coast to load centers
concentrated in the northeast. The system’s dependence on north-south transmission creates
operational inefficiencies and grid vulnerabilities. The impact of Hurricane Maria was
particularly devastating for these north-south lines, which cut through dense, forested terrain.
The system’s original transmission loop is the Central Loop, connecting Costa Sur,
EcoEléctrica, and Aguirre power plants in the south with the San Juan power plant in the north
20 Act 2-2017, as amended (3 L.P.R.A. § 9376).
21 Section 4 of the PREPA Enabling Act (22 L.P.R.A. § 194).
16via transmission centers at Aguas Buenas, Manatí, and Bayamón. The Western Loop, which
entered service in 2002, connects Costa Sur and EcoEléctrica power plants in the south with
PREPA’s Mayaguez plant in the west and the Cambalache plant in the north. The Eastern
Loop, which entered service in 2006, connects Aguirre and AES power plants in the south
through transmission centers at Yabucoa in the east and Aguas Buenas and Sabana Llana in
the north.
EXHIBIT 4: PREPA TRANSMISSION LOOPS
Transmission Overview
PREPA’s transmission system maintains 178 transmission centers operating at 230 kV,
115 kV, and 38 kV. These centers link 1,134 miles of transmission lines (230/115 kV) and
1,549 miles of sub-transmission lines (38 kV). Of these, 96% of the lines are overhead and the
remaining 4% are underground. PREPA maintains approximately 44,000 transmission
structures, divided across the three 230 kV loops in the west, east, and central parts of the
island. The 115 kV lines serve all the major load centers, while the 38 kV sub-transmission
system serves more remote interior regions, as well as most industrial and commercial
customers.
Distribution Overview
PREPA’s distribution system serves around 1.5 million customers utilizing roughly
1,200 circuits. There are a total of 31,893 miles of distribution lines, including 16,806 miles of
primary voltage lines and 15,087 miles of secondary lines and service drops. The system
connects 61 115 kV substations, 279 38 kV substations, and 824 privately owned substations.
There are approximately 298,000 distribution poles and approximately 213,000 service
transformers. Most of PREPA’s distribution system is comprised of overhead lines, with
roughly 20% of underground lines located primarily in urban centers. Distribution poles are
galvanized steel, concrete, and wood.
Challenges to the Transmission and Distribution System
PREPA faces notable geographic challenges given that its primary load center is located in the
north (San Juan Metro Area and Humacao Industrial District, approximately 70% of total
load) while the majority of the most economic and efficient generation resources are in the
south (approximately 70% of online generation capacity). The three 230 kV transmission
loops that link generation from the south to demand in the north traverse mountainous and
densely forested terrain, creating access limitations for repairs or reconstruction. In the
aftermath of hurricanes Irma and Maria in 2017, recovery efforts were delayed by limited
accessibility to these transmission lines. The extent of the hurricane damage was exacerbated
by a failure to manage vegetation and execute routine maintenance – a report by the
Government Accountability Office assessing the impact of the hurricanes on the electrical grid
17found that “[PREPA] canceled its vegetation management program” prior to the hurricanes,
thus “[contributing] to the destruction of the grid.”22 PREPA’s T&D maintenance and
management practices continue to fall short of industry standards, leading to higher costs and
lower reliability for customers.
In order to address these challenges – by improving operational performance and customer
service, supporting rigorous capital project execution to modernize the system, and ensuring
ongoing fiscal balance and control – the P3A, in collaboration with PREPA and the Oversight
Board, have selected an experienced and professional private operator to take on the
responsibilities to operate and maintain PREPA’s T&D system. In addition, the capital
investments for grid modernization outlined in the T&D road map will be instrumental to
strengthening Puerto Rico’s electrical grid – further details are provided in Chapter 14,
“Resilience Planning and Expenditures.”
Current State of Generation
Electricity is supplied by PREPA-owned generation plants and procured from independent
power producers (IPPs) under power purchase and operating agreements (PPOAs). Together,
PREPA-owned power plants have 4,908 MW of installed generation capacity. However,
approximately 40% of this capacity is usually out of service, often for extended periods of time,
so, on average, around 3,000 MW of PREPA-owned generation capacity is available for
dispatch. In addition to PREPA-owned assets, supply from IPPs consists of 961 MW from two
conventional power plants and 254 MW from various renewable energy providers. Given
PREPA’s frequent outages, the system often has to dispatch generation units with higher cost
fuel. For example, the earthquake-related losses at Costa Sur’s natural gas generation (average
fuel cost of $82/MWh) were compensated by increasing generation in diesel units (average
fuel cost of $112/MWh).
About 45% of PREPA-owned generation resources are oil fired, compared to the national
average of 4%.23 Renewables generation makes up 4% of Puerto Rico’s generation capacity,
while nationally the average is 15%. In FY2020, the San Juan Power Plant facility completed
a conversion of Units 5 and 6 to burn natural gas, marking progress toward diversifying the
generation fleet.
22 “2017 Hurricane Season: Federal Support for Electricity Grid Restoration in the U.S. Virgin Islands and Puerto Rico,” U.S.
Government Accountability Office. April 2019. https://www.gao.gov/assets/700/698626.pdf.
23 Draft IRP, February 2019, https://energia.pr.gov/wp-content/uploads/2019/02/PREPA-Ex.-1.0-IRP-2019-PREPA-IRP-
Report.pdf.
18EXHIBIT 5: PREPA GENERATION ASSETS
Challenges to the Generation System
As an island system, Puerto Rico’s power grid is geographically isolated and thus Puerto Rico
is unable to import additional power for purposes of load balancing, voltage control, and
frequency control across the electric system. PREPA’s baseload generation units are relatively
large as a percentage of system peak load, such that a single unit outage can lead to an island-
wide outage, as experienced in 2016 and 2018. To protect against this, generating units are
required to spend significant operating hours at partial load in order to maintain reliability,
reducing generation efficiency and increasing overall costs.
Most of PREPA’s current generation fleet runs on old and outdated steam generation
technology with long ramp times. This means that older plants (such as steam turbines) take
longer to reach peak load and have limited operational flexibility to change load due to the fact
that they have slower control systems and require more time to heat up. While these older
steam plants are generally more economic due to lower-cost fuel, they are operationally
limited by applicable federal mercury and air toxic standards (MATS) and the U.S.
Environmental Protection Agency (EPA) Consent Decree.
Puerto Rico’s few renewable energy facilities represent the system’s cleanest generation
resources and are designated “must run.”24 However, these facilities are, on average, some of
the most expensive generation on the island, since, at the time of procurement, renewable
generation capacity was priced much higher than the market price available today.
Puerto Rico’s aging, inefficient, and unreliable generation fleet must be urgently replaced and
modernized. The roadmap for this modernization is defined in the IRP, which outlines the
actions and investment in new generation PREPA must make in order to reduce generation
costs and achieve greater reliability and resiliency. In order to meet the Renewable Portfolio
24 “Must run” facilities require PREPA to pay for energy produced to the contracted capacity even if not needed to meet system
demand.
19Standards (RPS) mandated by Act 17-2918 (i.e., 25% generation from renewable sources by
2025; 100% by 2050), Puerto Rico must accelerate its development of renewable generation.
For existing generation assets, transitioning to one or more private operator(s) will ensure the
optimal operation and maintenance of these assets until they are retired and replaced by new
and more efficient generation resources. Further detail is provided in Chapter 3,
“Transformation.”
Customer Demographics and Affordability
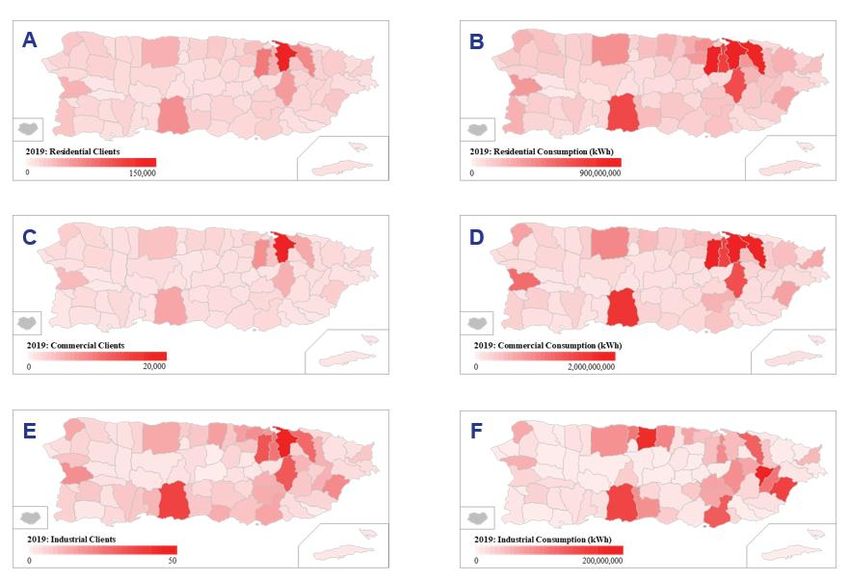
PREPA currently serves approximately 1.5 million customers, of which 91% are residential, 9%
are commercial, and less than 1% are industrial. Almost half of PREPA’s load is driven by
commercial customers, who represented 49% of FY2020’s projected total demand of 16 TWh.
This is followed by residential customers, who account for 36% of electricity demand, and
industrial customer, at 13%.25 The majority of PREPA’s residential and commercial customers
are located in the San Juan metropolitan area (Exhibit 6A and 6C). Industrial customers, on
the other hand, are spread across the island; they are primarily located in the San Juan
metropolitan area, the Humacao district (southeast of San Juan), the north-central coast
(Arecibo, Manatí and Vega Baja) and the municipality of Ponce (southern coast) (Exhibit 6E
and 6F).
EXHIBIT 6: 2019 PREPA CUSTOMER COUNT AND CONSUMPTION BY MUNICIPALITY
A June 2020 survey of 374 Puerto Rico electricity customers found 96% of surveyed customers
to be serviced by PREPA, while 4% utilized behind-the-meter generation. A slight majority of
respondents (51.6%) indicated they were “satisfied” or “very satisfied” as compared to those
who responded they were “unsatisfied” or “very unsatisfied” (47.3%) with their service
provider. In contrast, the overall customer satisfaction score for the U.S. utility sector averaged
72% in 2019.26 While just half of respondents were satisfied overall, the majority were
dissatisfied by the cost and reliability of electricity service – 62% reported dissatisfaction with
25 Additional load is attributed to public lighting and agriculture.
26 American Customer Satisfaction Index Energy Utilities Report, 2019-2020
20the cost of electricity and 65% were dissatisfied with the reliability of electricity service (i.e.,
frequency and duration of outages). The average monthly bill reported was $111, while the
median bill was $95. More than 50% said they would alter their consumption pattern if energy
costs increased – 44% would consider moving to solar and investing in energy efficient
appliances, while 23% would consider completely disconnecting from PREPA. For one-fifth of
respondents, the electricity share of wallet (i.e., average electricity bill as share of monthly
household income) is greater than 10%.
On average, Puerto Rico’s consumers pay more for electricity relative to their income than
consumers in any U.S. state. For the average PREPA customer, based on 2015-2016 rates of
25 c/kWh, an electricity bill amounts to approximately 7% share of wallet, subsidies
notwithstanding, which is significantly higher than that of U.S. mainland peers (range of 2.7 to
3.8%) and Latin American peers (range of 2.2 to 5.5%) (Exhibit 7).27 Low-income customers
are disproportionately affected by the current rate structure. Share of wallet for low-income
ratepayers amounts to 13% before subsidies but adjusts to 6.1% after considering subsidies.
For middle- and high-income customers, electricity bills amount to 5.7% and 2.7% of average
incomes respectively.
EXHIBIT 7: PUERTO RICO ELECTRICAL SHARE OF WALLET COMPARED TO PEER REGIONS 28,
29, 30
27 Share of wallet is defined as the percentage of per capita electric utility service expenditures relative to per capita income.
28 The Caribbean region includes Bahamas, Saint Kitts and Nevis, Trinidad and Tobago, Antigua and Barbuda, Barbados,
Grenada, Saint Lucia, The Dominican Republic, Jamaica, Suriname, Guyana, and Haiti.
29 Average residential rate for 2015-16 comparison.
30 Sources: FRED US per capita Income 2016, World Bank World per capita income 2016, EIA world energy consumption
2016, Global Data and NREL Electricity Rates.
21You can also read