2020 Full Year Results Investor Presentation - Year ended 30th June 2020 20th August 2020 - IPH Limited
←
→
Page content transcription
If your browser does not render page correctly, please read the page content below
2020 Full Year Results
                    Investor Presentation
                    Year ended 30th June 2020
                    20th August 2020

                    Presented by:
                    Dr. Andrew Blattman Managing Director / CEO, IPH Limited
                    John Wadley Chief Financial Officer, IPH Limited
www.iphltd.com.au                                                              1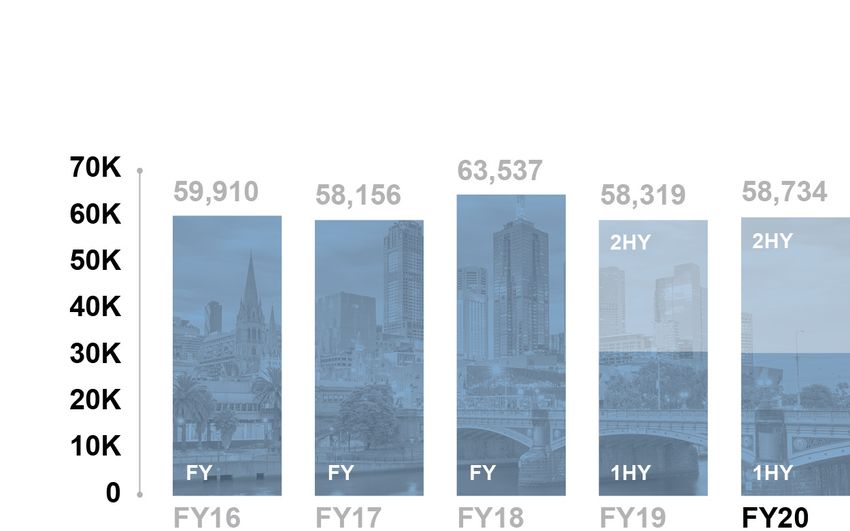
Disclaimer

                                                     This document has been prepared by IPH Limited (IPH) and comprises written                   No representation, warranty or assurance (express or implied) is given or
                                                     materials/slides for a presentation concerning IPH.                                          made by IPH that the forward looking statements contained in this
                                                                                                                                                  presentation are accurate, complete, reliable or adequate or that they will
                                                     This presentation is for information purposes only and does not constitute or form           be achieved or prove to be correct. Except for any statutory liability which
                                                     part of any offer or invitation to acquire, sell or otherwise dispose of, or issue, or any   cannot be excluded, IPH and its respective officers, employees and
                                                     solicitation of any offer to sell or otherwise dispose of, purchase or subscribe for, any    advisers expressly disclaim any responsibility for the accuracy or
                                                     securities, nor does it constitute investment advice, nor shall it or any part of it nor     completeness of the forward looking statements and exclude all liability
                                                     the fact of its distribution form the basis of, or be relied on in connection with, any or   whatsoever (including negligence) for any direct or indirect loss or damage
                                                     contract or investment decision.                                                             which may be suffered by any person as a consequence of any information
                                                                                                                                                  in this presentation or any error or omission therefrom.
                                                     Certain statements in this presentation are forward looking statements. You can
                                                     identify these statements by the fact that they use words such as “anticipate”,              Subject to any continuing obligation under applicable law or relevant listing
                                                     “estimate”, “expect”, “project”, “intend”, “plan”, “believe”, “target”, “may”, “assume”      rules of the ASX, IPH disclaims any obligation or undertaking to
                                                     and words of similar import.                                                                 disseminate any updates or revisions to any forward looking statements in
                                                                                                                                                  these materials to reflect any change in expectations in relation to any
                                                     These forward looking statements speak only as at the date of this presentation.
                                                                                                                                                  forward looking statements or any change in events, conditions or
                                                     These statements are based on current expectations and beliefs and, by their nature,
                                                                                                                                                  circumstances on which any statement is based. Nothing in these materials
                                                     are subject to a number of known and unknown risks and uncertainties that could
                                                                                                                                                  shall under any circumstances create an implication that there has been no
                                                     cause the actual results, performances and achievements to differ materially from
                                                                                                                                                  change in the affairs of IPH since the date of the presentation.
                                                     any expected future results, performance or achievements expressed or implied by
                                                     such forward looking statements.

2020 Full Year Results Investor Presentation |   www.iphltd.com.au                                                                                                     Cover image: Buildings in the centre of Auckland, New Zealand   2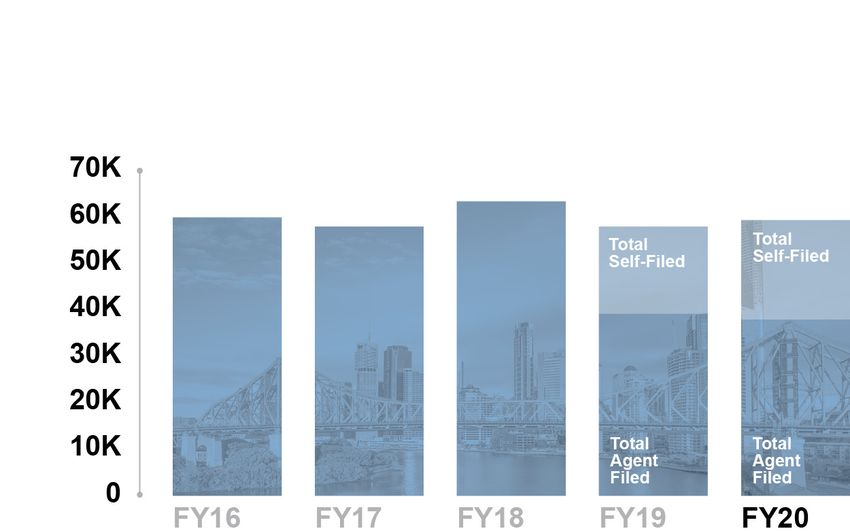
Table of contents

                                                      01
                                                       FY20 highlights
                                                                           02
                                                                           FY20 results
                                                                                                   03
                                                                                                   Market overview

                                                      04
                                                       Operations review
                                                                           05
                                                                           Looking ahead to FY21
                                                                                                   06
                                                                                                   Appendix

2020 Full Year Results Investor Presentation |   www.iphltd.com.au                                                   3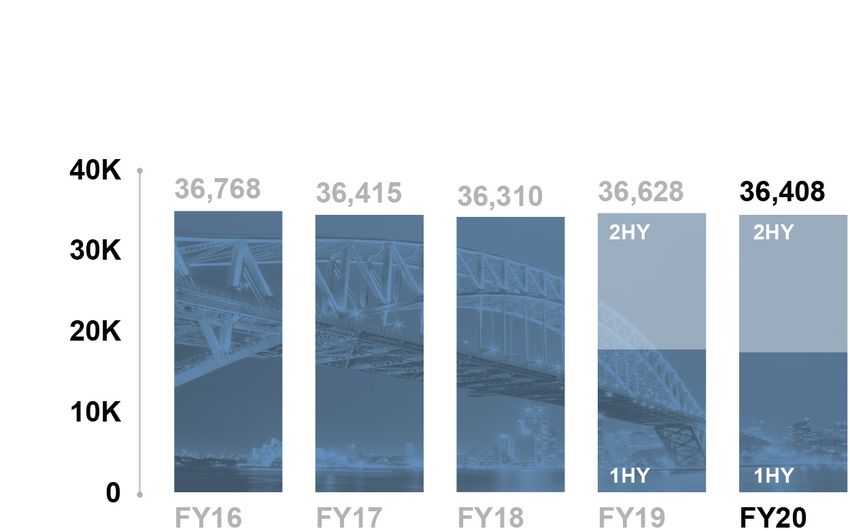
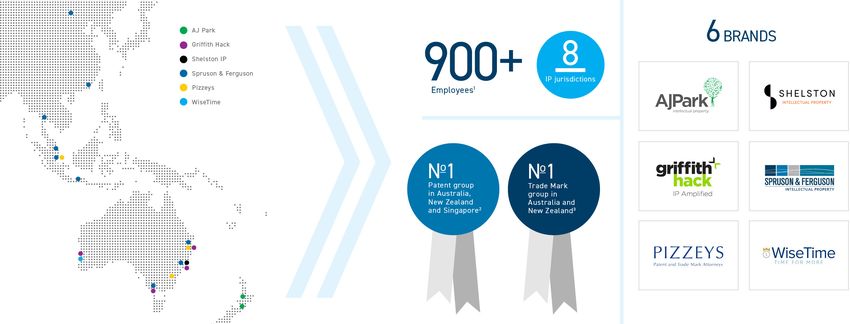
About IPH Limited
Asia-Pacific’s leading IP professional services group

1.   Approximate employee numbers across the Group.

                                                                                                                                                                                                         4
2.   IPH Management estimate based on IP office filing information: Australia (IP Australia) – FY20 14/07/20; Singapore (IPOS) – CY19 as at approx. 3/08/20; New Zealand (IPONZ) – FY20 as at 7/07/20.
3.   IPH Management estimate based on IP office filing information: Australia (IP Australia) – FY20 9/07/20, based on market share of the top 50 agents; New Zealand (IPONZ) – FY20 as at 7/07/20.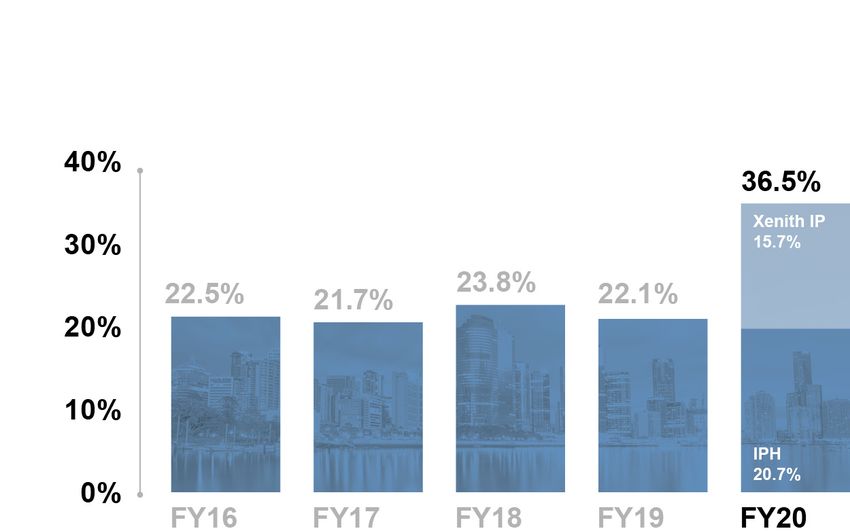
FY20
Highlights

01           5
Operational highlights
Continued delivery of strategic priorities

                                                     Strategic priorities for FY20                                     Results in FY20

                                                     01
                                                                                                                             Xenith integration successfully completed, including
                                                               Successful Xenith IP integration                              integration of Watermark business into Griffith Hack and
                                                                                                                             divestment of Glasshouse Advisory practice.

                                                     02
                                                                                                                             IPH group maintains the number one patent position in
                                                               Maintain market leading position in Australia /
                                                                                                                             Australia, New Zealand and Singapore. Margin expansion
                                                               New Zealand and continued margin expansion
                                                                                                                             achieved within Xenith IP group.

                                                     03
                                                                                                                             Increased referrals into Asia business from the expanded
                                                               Continued focus on Asia to develop the network effect         group. Griffith Hack is now a top 10 client of IPH Beijing
                                                                                                                             and Hong Kong practice.

                                                     04         WiseTime growth in sales                                     WiseTime revenue growth and growing customer base.

                                                     05
                                                                                                                             Digital platform development is in progress, with multiple
                                                               Digital platform development                                  streams of work underway. Due to COVID-19, IT resources
                                                                                                                             have been focused on ensuring business continuity.

                                                     06
                                                                                                                             Proposed acquisition of Baldwins IP in New Zealand.
                                                               Continued focus on potential overseas
                                                                                                                             Continue to assess other potential opportunities in
                                                               acquisitions in secondary IP markets
                                                                                                                             overseas markets.

2020 Full Year Results Investor Presentation |   www.iphltd.com.au                                                                                                                        6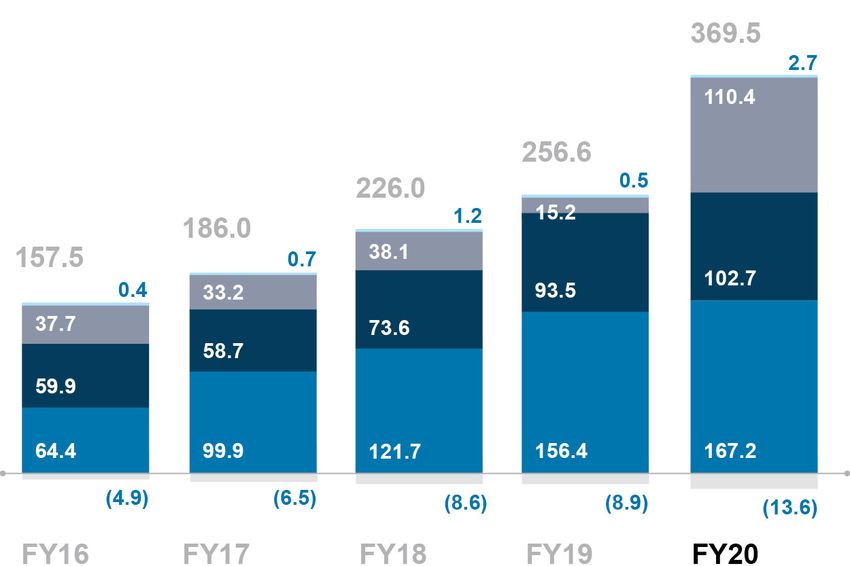
COVID-19 update
Prudent approach during an uncertain period

                                                     Current market environment                        Caring for our people                                  Managing the business
                                                     •   IPH is a resilient business and maintains a   •   Comprehensive COVID-19 response and                •   Continued conservative cost
                                                         significant pipeline of work as a result of       COVIDSafe plans have been implemented                  management including delaying
                                                         previous filings.                                 across all offices with the primary focus on the       decisions around most remuneration

                                                                                                           safety and wellbeing of our people, clients and        increases until later this year.
                                                     •   We have seen some disruption
                                                         due to the pandemic.                              communities.                                       •   IPH has accessed more than AU$1M in

                                                                                                       •   Feedback from employee wellbeing surveys               Government Support grants from China,
                                                     •   Some slowdown in instructions from
                                                                                                           used to guide wellbeing initiatives during             Hong Kong SAR, China and Singapore.
                                                         clients, particularly local clients, whose
                                                         operations have been impacted by the              remote working.                                    •   Government assistance was not
                                                         pandemic.                                     •   We continue to follow and act on Government            accessed in Australia or New Zealand.

                                                     •   We have observed some short-term                  advice in regard to the need to work from

                                                         decline in filings however activity is            home, with a large portion of our workforce

                                                         expected to recover as markets stabilise.         currently working remotely across most IP
                                                                                                           jurisdictions.
                                                     •   Most IP offices have remained open with
                                                         the exception of some smaller IP offices in   •   No significant workforce changes have been

                                                         SE Asia.                                          required as a result of the pandemic.

2020 Full Year Results Investor Presentation |   www.iphltd.com.au                                                                                                                                     7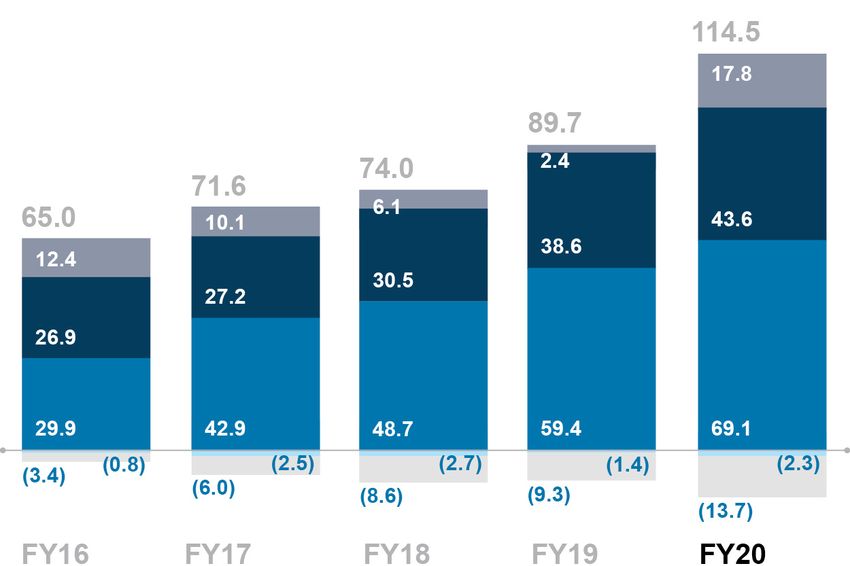
Financial highlights
Growth across most financial metrics in challenging market conditions

Revenue                                                                                  43%                                   Dividend1                                                  14%
$370.1m                                                                                                                        28.5 cents per share (15c final)                                 Xenith contribution3
                                                                                                                                                                                                (since 15 August 2019)

EBITDA                                                                                   32%                                   Underlying EBITDA2                                         41%   $106.9m         3%
$113.2m                                                                                                                        $126.0m                                                          Revenue

                                                                                                                                                                                                $25.7m 44%
NPAT                                                                                        3%                                 Underlying                 NPAT2                           24%   Underlying
$54.8m                                                                                                                         $77.7m                                                           EBITDA

Diluted EPS                                                                                 3%                                 Underlying Diluted EPS                                     15%
25.8 cents per share                                                                                                           36.5 cents per share

1.   Represents 82% of cash NPAT.

                                                                                                                                                                                                                         8
2.   Underlying EBITDA and NPAT excludes costs incurred in pursuit of acquisitions, new business establishment costs, accounting charges for share-based payments, business acquisition
     costs, restructuring expenses, impairment of Watermark brand and onerous lease provisions and asset write-offs.
3.   Compared to 10.5 months in the prior comparative period.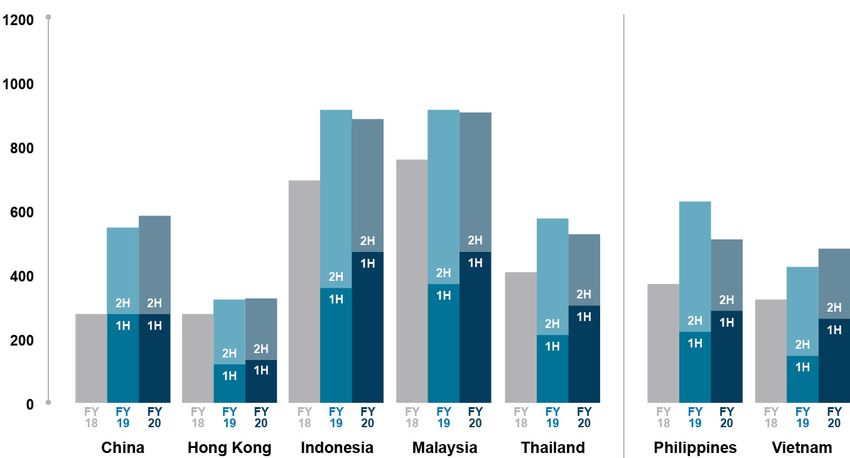
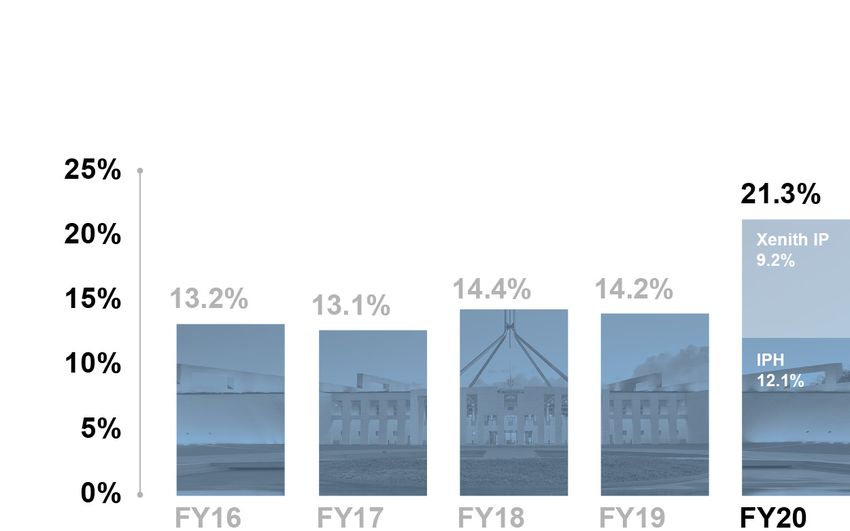
Financial highlights – pre-AASB16
Compares performance had the prior year accounting standard still applied

Revenue                                                                                  43%                                   FY Dividend1                                               14%
$370.1m                                                                                                                        28.5 cents per share (15c final)                                 Xenith contribution3
                                                                                                                                                                                                (since 15 August 2019)

EBITDA                                                                                   18%                                   Underlying EBITDA2                                         28%   $106.9m         3%
$101.6m                                                                                                                        $114.5m                                                          Revenue

                                                                                                                                                                                                $21.2m    19%
NPAT                                                                                        4%                                 Underlying                  NPAT2                          24%   Underlying
$55.0m                                                                                                                         $77.9m                                                           EBITDA

Diluted EPS                                                                                 3%                                 Underlying Diluted EPS                                     16%
25.9 cents per share                                                                                                           36.7 cents per share

1.   Represents 82% of cash NPAT.

                                                                                                                                                                                                                         9
2.   Underlying EBITDA and NPAT excludes costs incurred in pursuit of acquisitions, new business establishment costs, accounting charges for share-based payments, business acquisition
     costs, restructuring expenses, impairment of Watermark brand and onerous lease provisions and asset write-offs
3.   Compared to 10.5 months in the prior comparative period.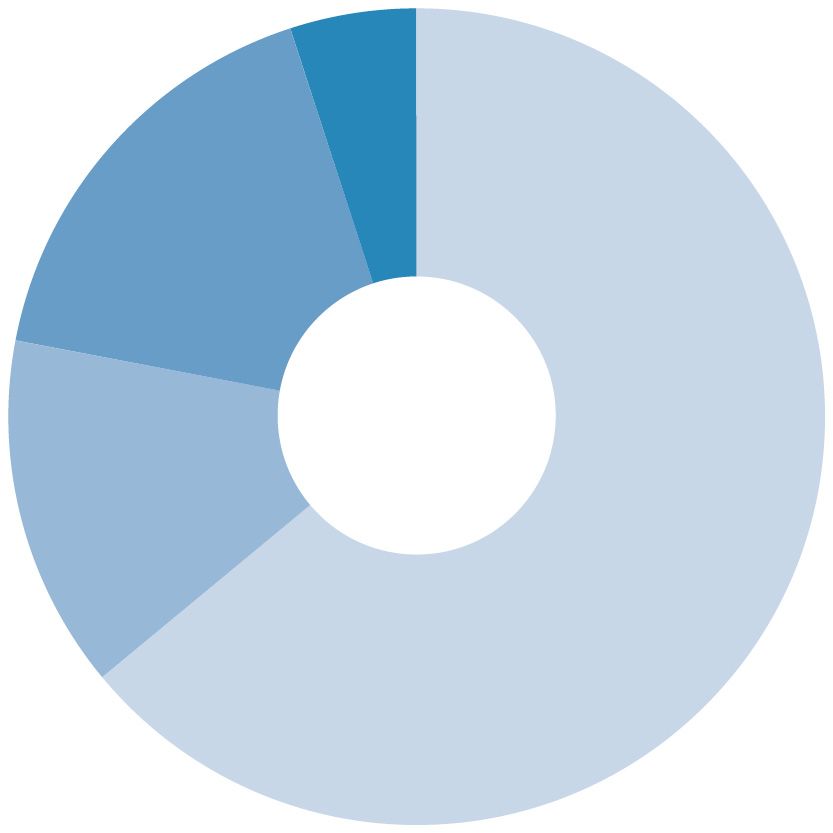
FY20
Results

02        10
Revenue and EBITDA
Well placed in a challenging environment

Underlying Revenue ($m)                                                                                                                                                        Underlying EBITDA ($m)
     Australia and New Zealand IP                                                                                                                                                     Australia and New Zealand IP
     Adjacent businesses                                                                                                                                                              Adjacent businesses
     Asia IP                                                                                                                                                                          Asia IP
     New businesses                                                                                                                                                                   New businesses
     Corporate                                                                                                                                                                        Corporate

1.   Underlying EBITDA in FY20 is pre-AASB16.

                                                                                                                                                                                                                                         11
2.   Underlying EBITDA excludes costs incurred in pursuit of acquisitions, revaluations of deferred settlements & earn outs, new business establishment costs, accounting charges for share-based payments and restructuring expenses.
3.   New Businesses FY20 represents 10.5 months of Xenith IP.
Like for Like Revenue and EBITDA
Continuing growth in Asia
Underlying Adjusted Underlying
New Accounting FX Currency
Revenue1 Revenue Revenue Chg%
Businesses2 Movements3 Adjustment4
June 20 June 20 June 19
Australia & NZ IP 277.7 (107.5) 0.1 (6.8) 163.5 171.6 (5%)
Asian IP 102.7 0.7 (4.8) 98.6 93.5 6%
Wisetime 0.4 0.4 0.5
Glasshouse 2.3 (3.9) (1.6)
Corporate 1.2 1.0 (0.7) 1.4 (0.0)
Eliminations (14.6) 1.2 (13.5) (8.9)
369.5 (110.4) 1.2 (11.6) 248.9 256.6 (3%)
Underlying Adjusted Underlying
New Accounting FX Currency
EBITDA1 EBITDA EBITDA Chg%
Businesses Movements Adjustment
June 20 June 20 June 19
Australia & NZ IP 86.9 (23.6) 0.1 (6.6) 56.9 61.8 (8%)
Asian IP 43.6 0.7 (2.7) 41.6 38.6 8%
Wisetime (1.2) (1.2) (1.4)
Glasshouse (1.1) 1.2 0.1
Corporate (13.3) 4.6 (0.7) (9.4) (10.0)
Eliminations (0.6) 1.1 0.6 0.7
114.5 (17.8) 1.2 (9.3) 88.5 89.7 (1%)
1. Underlying EBITDA and NPAT (pre-AASB16) excludes costs incurred in pursuit of acquisitions, new business establishment costs, accounting charges for share-based payments, business acquisition costs, restructuring expenses, impairment of Watermark brand and onerous lease provisions and asset write-offs.
2. New business represents 10.5 months of Xenith IP. Excludes additional contribution generated under IPH ownership.
12
3. Accounting FX movements represents change in realised and unrealised FX as reported in the financial statements.
4. Currency adjustment represents the performance had the prior period exchange rates applied.Underlying NPAT and EPS
Underlying EPS growth of 16%
Year ended FY20 Statutory Underlying AASB 16 FY20 Pre-AASB FY19 Statutory Underlying
Adjustments Adjustments
30 June 2020 Income Statement Earnings FY202 Adjustments Income Statement Income Statement Earnings FY19
Total revenue 370.1 (0.5) 369.6 369.6 259.5 (2.9) 256.6
Recoverable expenses (105.6) (105.6) (105.6) (74.6) (74.6)
Compensation (115.5) 2.2 (113.3) (113.3) (68.6) 2.2 (66.4)
Occupancy (1.7) (1.7) (11.6) (13.3) (8.6) (8.6)
New businesses/acquisitions
(5.8) 5.8 (4.5) 4.5
related net expenses
Impairment (5.3) 5.3
Other (23.0) (23.0) (23.0) (17.3) (17.3)
Total expenses (256.9) (243.6) (255.2) (173.6) (166.9)
EBITDA 113.2 126.0 114.5 85.9 89.7
EBITDA % 30.6% 34.1% 30.9% 33.1% 35.0%
Depreciation & Amortisation (34.5) 19.6 (14.9) 9.6 (5.3) (12.7) 9.2 (3.4)
EBIT 78.7 111.2 109.2 73.2 86.3
Net Finance Costs (7.0) (7.0) 2.2 (4.8) (2.6) (2.6)
NPBT 71.7 104.2 104.4 70.6 83.7
Tax (expense)/benefit (16.9) (9.5) (26.4) (26.4) (17.5) (3.3) (20.8)
NPAT 54.8 22.9 77.7 0.2 77.9 53.1 9.7 62.9
Diluted EPS (cents)1 25.8c 36.5c 36.6c 26.7c 31.7c
Growth rate 16%
13
1. Diluted EPS includes performance rights that are yet to vest.
2. Underlying EBITDA and NPAT excludes costs incurred in pursuit of acquisitions, new business establishment costs, accounting charges for share-based payments, business acquisition costs, restructuring expenses, impairment of Watermark brand and onerous lease provisions and asset write-offs.Cash flow statement
IPH continues to generate strong cash flows
Commentary Year ended 30 June 2020 FY20 Cash Flow Statement FY19 Cash Flow Statement
$'m
• Cash conversion in excess of 100% reflects the strong final quarter of FY19. The
Statutory EBITDA 113.2 85.9
cash receipts of this revenue were received in FY20. It also reflects the comparatively
Change in working capital 11.8 (3.7)
weaker final quarter of FY20.
Operating capital expenditure (5.2) (5.9)
• As a prudent measure, the Company drew down $20M from its debt facilities in
Cash flow before acquisitions,
March. Subsequent to year-end, $12.7M of this balance was repaid in August 2020. 119.9 76.3
financing activities and tax
• Cashflows support high dividend payout (82% of cash NPAT for FY20). Cash conversion ratio 106% 89%
• Strong balance sheet with a leverage ratio of 0.6 times. IPH debt facilities do not Income taxes paid (30.4) (17.3)
mature until February 2022. Net interest paid (4.9) (2.6)
Free cash flow 84.6 56.4
Key Metrics at 30 June 2020
Cash on hand $83m Dividends paid (net DRP) (47.9) (45.4)
Drawn debt $151m Undistributed free cash flow 36.7 11.0
Acquisitions, investments &
Net debt $68m (40.3) (32.8)
intangibles
Leverage ratio (Net debt / FY20 EBITDA) 0.6 times Lease payments (11.9) -
Proceeds from sale of
Debt maturity Feb 2022 - 10.1
Practice Insight products
Net borrowing
Cash conversion at 30 June 2020 106% 64.1 23.6
proceeds/(repayments)
Net cash flow 48.6 11.9
2020 Full Year Results Investor Presentation | www.iphltd.com.au 14Balance sheet
Strong balance sheet with leverage ratio of 0.6 times
$'m Balance Sheet as at 30 Jun 2020 Balance Sheet as at 30 Jun 2019
Commentary Cash and cash equivalents 82.9 35.3
Trade and other receivables 89.1 63.4
• Balance sheet movements reflect the acquisition of Xenith IP Investments - 39.2
and the adoption of AASB16 Other current assets 9.1 7.3
Total current assets 181.1 145.2
• Xenith Acquisition: PP&E 13.3 6.7
Rights of use assets 38.8
o Issue of shares totalling $130m
Acquisition intangibles & goodwill 483.3 255.1
o Drawdown of $65m borrowings Deferred tax asset 22.6 7.8
Other non-current assets - 0.2
o Investments now included within the acquisition amount Total assets 739.1 414.9
Trade and other payables 24.7 19.1
o Increased goodwill ($114m), customer relationships ($120m),
Tax provisions 3.3 10.2
trade marks ($15m) and deferred tax liabilities ($40m)
Lease liabilities 53.7
• Implementation of AASB16 resulted in: Deferred tax liability 60.4 22.4
Borrowings 151.2 65.5
o Right of use assets Other liabilities 23.1 12.9
Total liabilities 316.4 130.1
o Interest bearing lease liabilities
Net assets 422.7 284.8
o Increase in deferred taxes Equity
Issued capital 402.2 262.8
Reserves 0.5 (2.0)
Retained profits 20.0 24.0
Total equity 422.7 284.8
2020 Full Year Results Investor Presentation | www.iphltd.com.au 15Impact of foreign currency
USD weakened in 2H
Earnings currency sensitivity Balance sheet sensitivity FY20 currency profile HKD
5%
• Based on the USD profile in FY20 in the IPH Group, • The Group is also exposed to FX on the level of its USD
SGD
a 1c movement in the AUD/USD exchange rate denominated cash and receivables in the balance sheet, 17%
equates to approximately $1.9m of revenue on balances of which fluctuate.
services charges on an annualised basis.
• 55% of the Group’s invoicing is denominated in USD.1 Operating
• This sensitivity fluctuates on the basis of
• Average USD cash2 held US$14m.
expenses NZD
acquisitions, their timing and their mix of currencies 14%
AUD
• Average USD net assets (including cash)3 US$27m. 64%
• The Group has a number of hedge positions against
specific FX risks, the most material of which
represent less than 10% of the group’s USD
exposure. These are taken into account in the Other
provision of the USD sensitivity of a 1c movement FX Rates FY20 FY19 6%
SGD NZD
equating to a $1.9M movement in service charges.
4% 6%
This policy is currently under review.
USD 0.6712 0.7153 HKD
5%
USD Service
SGD 0.9283 0.9765
AUD
55%
charges
25%
1. Excludes USD billing in SF Hong Kong where HKD is pegged to USD. IPH exposure is to HKD.
16
2. Average of closing monthly USD cash balance.
3. Average of opening and closing USD denominated assets.Market Overview 03 17
IPH group global filings
Scale helps to mitigate the periodic fluctuations in filings in certain markets

                                                                       Scale comparison of total IPH Group filings
                                                                       to key national markets (Filings through IPH                                                                                                                      Australian
                                                                       offices and our external agents1)                                                                                                                                 patent market
                                                                                                                                                                                                                                         (FY20)
                                                                       •     IPH (as a group) is a significant global patent and trade mark filer,
                                                                             both in our home markets as well as outgoing filings from ‘local’
                                                                             clients into other global IP jurisdictions.

                                                                       •     Annualised aggregate IPH group patent filings in all markets are
                                                                             more than the combined total markets of New Zealand and
                                                                             Singapore, and represent more than three quarters of the total
                                                                             Australian market.
                                                                                                                                                                                                                                         Singapore
                                                                       •     This scale and geographic diversification helps to mitigate the                                                                                             patent market
                                                                             periodic fluctuations in filings in certain markets.                                                                                                        (CY19)

                                                                                                                                                                                                                                         New Zealand
                                                                                                                                                                                                                                         patent market
                                                                               Patents – IPH                                                                                                                                             (FY20)
                                                                               Trade marks – IPH

1.   Total patent / trade mark cases filed or instructed to be filed by IPH entities into any jurisdiction in the world. Includes cases filed by any agent (IPH and non-IPH). Data based on internal filing statistics.
     FY20 IPH includes filings by the following entities: Spruson & Ferguson, FAKC, Pizzeys, Cullens, AJ Park, Griffith Hack, Shelston and Watermark. Filings from acquired companies are included from 1 Jul of the acquisition year.                   18
Patent market – Australia
Mature market with stable filings
Australian patent market filings1 IPH Group filings and market share2
• Australian patent market declined by 0.6% from FY19 to FY20. • The IPH group maintains number one patent market position in Australia.
• Removing innovation patent filings, the market declined by 1.5%. • Filings by the combined IPH Group (including Xenith on a pro-forma basis) declined by
5.3% in FY20 reflecting client mix and filing activity.
• Patent filings in Q4FY20 declined by 2.6% compared to the prior comparable period.
• Market share of Xenith IP businesses declined from 16.2% in FY19 to 15.7% in FY20.
1. IPH Management estimate based on filing information recorded on IP Australia as at 14/07/20 (FY20), 1/08/19 (FY19) and 3/08/2018 (FY16-FY18). Includes all types of patent applications..
2. IPH Management estimate based on agent recorded with IP Australia as at 14/07/20 (FY20), 1/08/19 (FY19), 3/08/18 (FY18) and 6/07/18 (FY16-FY17) and may not reflect any subsequent change of agent. IPH Group market
19
share includes filings by the following entities: FY16 and FY17 - Spruson & Ferguson, FAKC, Pizzeys, Cullens, FY18 and FY19 - Spruson & Ferguson, FAKC, Pizzeys, Cullens and AJ Park. FY20 - Spruson & Ferguson, FAKC,
Pizzeys, Cullens, AJ Park and Xenith IP acquired businesses (Griffith Hack, Shelston and Watermark). Filings from acquired companies are included from 1 Jul of the acquisition year.Patent market – Singapore
IPH continues to hold the #1 market share position in Singapore
Singapore patent market filings1 IPH Group filings and market share2
• Singapore patent market • Preliminary data indicates market growth of 1.7% in CY20 • IPH Group filings increased by 22.2% in CY19 compared with CY18
increased by 20.9% in CY19 YTD June compared with the prior corresponding period
• IPH Group continues to hold the number one market share position
compared with CY18
in Singapore
• Changes to Singapore patent
• Preliminary data indicates IPH Group filings growth of 1.9% in CY20
examination process (closure of
YTD June compared with the prior corresponding period
the ‘foreign route’) from
1 January 2020 resulted in an
influx of applications in December
2019 seeking examination under
the foreign route. This has not
resulted in lower filing activity in
CY20 to date
1. IPH Management estimate based on IPOS filing information via incremental refreshes to 3/08/20 (CY19-CY20), 1/08/19 (CY18) and 2/08/18 (CY16-CY17). Note, data for recent months subject to change due to data release timings.
20
2. IPH Management estimate based on patent filings from agents recorded with IPOS via incremental refreshes to 3/08/20 (CY19-CY20), 1/08/19 (CY18), 9/07/18 (CY17) and 10/08/17 (CY16) and may not reflect any subsequent change of
agent. Note, data for recent months subject to change due to data release timings. From CY16 onwards, IPH market share includes the Singapore offices of Spruson & Ferguson and Pizzeys.IPH Patent Filings - Asia
Prior year growth consolidated
Filings in key Asian jurisdictions
by IPH offices1 (1.0%)
(2.6%)
• Strong 1HFY20 growth of 28.5% across
these jurisdictions.
• 2HFY20 compares against a very strong
2HFY19 due to a significant filing from one 6.8%
client across multiple jurisdictions. (8.3%) (18.9%)
11.8%
• Network continues to be attractive to large
clients. In FY20 we have seen multiple large 0.3%
filers across a number of jurisdictions.
*
1. Total patent cases lodged in key jurisdictions in Asia (excluding Singapore) by IPH entities (or external agents in the case of the Philippines and Vietnam). IPH Management estimates based on internal filing statistics. 21China growth story
Growing IPH’s position in this significant IP market
• Increase in both patent and trademark filings into IPH Beijing Increase in patent filings for IPH Beijing
and Hong Kong practice. and Hong Kong practices in FY20
• Nearly 7% increase in patent filings in Beijing practice for FY20
• Growth in service charge (revenue) for Beijing and Hong Kong
patent practice, including 14% service charge (revenue) growth
in the Beijing practice over the prior year.
• Growth in trade mark revenue over prior year and significant
increase in new filings for Beijing practice.
• Continued referrals from within the IPH group - AJ Park and
Griffith Hack are top 10 clients.
• Growth achieved despite disruption in instructions from US and
local client base due to COVID-19 and disruptions in Hong Kong
2020 Full Year Results Investor Presentation | www.iphltd.com.au 22Trade mark market – Australia
Second half trade mark total market impacted by self-filers
Australian trade mark market filings1 IPH Group filings and market share2
• In FY20 Australian trade mark filings • The IPH Group continues to be the leading Australian
increased by 0.7%. trade mark group by market share of the top 50 agents
• Excluding self-filers, Australian trade mark • Market share of Xenith IP businesses declined from
filings decreased by 3% for FY20. 10.0% in FY19 to 9.2% in FY20
• 2H decline in agent filings, as anticipated
due to challenging economic environment
Australian trade mark market
filings – Agent vs Self-filed 2
• Trend towards self-filing as well as low
cost providers
• 8.3% increase in self-filed trade mark
applications from FY19 to FY20, with
most of this increase in Q4 FY20.
1. IPH Management estimate based on filing information recorded on IP Australia as at 9/07/20 (FY20) and 1/08/19 (FY16-FY19). Trade mark filings and market share exclude International Registrations.
2. Applications determined as self-filed where no agent is listed at IP Australia, or agent is the same as trade mark owner
3. IPH Management estimate based on agent recorded with IP Australia as at 9/07/20 (FY20), 11/07/19 (FY18-FY19) and 24/10/18 (FY16-FY17) and may not reflect any subsequent change of agent. Market share calculated on total filings
23
from top 50 agents. IPH Group market share includes filings by the following entities: FY16 and FY17 - Spruson & Ferguson, FAKC, Pizzeys, Cullens, FY18 and FY19 - Spruson & Ferguson, FAKC, Pizzeys, Cullens and AJ Park. FY20 -
Spruson & Ferguson, FAKC, Pizzeys, Cullens, AJ Park and Xenith IP acquired businesses (Griffith Hack, Shelston and Watermark). Filings from acquired companies are included from 1 Jul of the acquisition year.Patent market trends
Historical context to current disruption
Australian patent filings1 US PCT applications2
• GFC is the most relevant comparison • Lapsing rates of Australian patent applications in the • Lead indicator for filings in secondary markets remains generally
to the current economic downturn final quarter of FY20 were in line with the quarterly consistent to March 2020 (latest reliable data).
averages over the past two years. This contrasts with a
• Based upon observations to date, we • Peak in early 2014 represents the legislative change of the
marked increase in lapsing rates observed at the peak
haven’t seen the decline of c.9% seen “America Invents Act” which similarly impacted filings in IPH’s
of the GFC.
in the graph below. We will continue to secondary markets two years later.
monitor. • Lapsing rates are an indicator of client commitment to
CAGR (CY05 to CY19) = 1.3%
maintenance of IP already in the process pipeline
CAGR Post-GFC (CY10 to CY19) = 2.5%
balanced against a desire to reduce IP expenditure.
25000
GFC Impact
• We have not observed a significant decline in National 16.6% Decline
Phase entries in Australia to the end of FY20. (Peak to
20000
Trough)
GFC Impact
9.5% Decline 15000
(Peak to
CAGR (FY05 FY20) = 0.9%
Trough)
CAGR Post-GFC (FY10 to FY20) = 1.4%
45000 10000
40000
35000
30000
5000
25000
20000
15000
10000
0
5000
Mar-05
Mar-06
Mar-07
Mar-08
Mar-09
Mar-10
Mar-11
Mar-12
Mar-13
Mar-14
Mar-15
Mar-16
Mar-17
Mar-18
Mar-19
Mar-20
Jun-05
Sep-05
Dec-05
Jun-06
Sep-06
Dec-06
Jun-07
Sep-07
Dec-07
Jun-08
Sep-08
Dec-08
Jun-09
Sep-09
Dec-09
Jun-10
Sep-10
Dec-10
Jun-11
Sep-11
Dec-11
Jun-12
Sep-12
Dec-12
Jun-13
Sep-13
Dec-13
Jun-14
Sep-14
Dec-14
Jun-15
Sep-15
Dec-15
Jun-16
Sep-16
Dec-16
Jun-17
Sep-17
Dec-17
Jun-18
Sep-18
Dec-18
Jun-19
Sep-19
Dec-19
0
FY05
FY06
FY07
FY08
FY09
FY10
FY11
FY12
FY13
FY14
FY15
FY16
FY17
FY18
FY19
FY20
Quarter
1. IPH Management estimate based on filing information recorded on IP Australia as at 14/07/20 (FY20), 7/07/19 (FY19), 3/08/2018 (FY15-FY18) and
. 24
17/04/18 (FY05-FY14). Includes all types of patent applications.
2. US PCT applications by filing date from WIPO IP Statistics Data Center as at 21/07/20Operations review 04 25
Xenith IP financial performance & synergies
Harnessing potential of consolidated business for FY21

Synergies delivered                                         Business performance
                                                                                                                                              FY19                12 months    10.5 months
•   Delivered previously announced                          •        In addition to synergies captured, the underlying operating businesses
    synergies for FY20 of $3.5m.                                     increased EBITDA compared to the prior year by a net $0.5m.              Revenue                  125.5         110.4

•   The synergies have been achieved                        •        This amount included the previously disclosed significant                Underlying EBITDA         19.7          17.8
    through the following initiatives:                               litigation matter, which led to a non-recurring EBITDA benefit
                                                                                                                                              Underlying EBITDA
                                                                                                                                                                        15.6          16.1
                                                                     in one entity of c$1.5m.                                                 margin
         o Corporate cost synergy –
            $2.9m (recorded in Xenith)                      •        Griffith Hack (including the former Watermark business) was more
                                                                     impacted in Q4, with possible impact of COVID-19, in part due to their
         o Xenith case flow to IPH Asia
                                                                     larger Victorian presence, and integration activities.
            ($0.6m recorded in Asian                                                                                                          FY20                             10.5 months
            business). Griffith Hack now a                  •        The integration of Watermark into Griffith Hack will assist an
            top 10 client of IPH’s Beijing                           improved performance in FY21.                                            Revenue                 3%             106.9

            and Hong Kong practice.                                                                                                                                                   21.2
                                                            •        The Glasshouse Advisory business EBITDA contribution also                Underlying EBITDA       19%
                                                                     decreased year on year. In May 2020, its R&D tax and incentive
                                                                                                                                              Underlying EBITDA
                                                                     practice was divested to Grant Thornton, with the remaining service                                              19.8
                                                                                                                                              margin
                                                                     lines closed.

                                                            •        FY21 focus is on harnessing the potential of the remaining Xenith IP
                                                                     brands as IPH businesses.

2020 Full Year Results Investor Presentation |   www.iphltd.com.au                                                                                                                           26
Xenith IP integration successfully completed
Significant integration program achieved
Watermark integration into Griffith Hack Divestment of Glasshouse Advisory
R&D tax and EMDG practice to Grant Thornton
Full integration, including IT systems, was achieved on schedule,
as planned in July 2020. Following a detailed review of the Glasshouse Advisory business,
IPH concluded that these aspects of the business would be better placed
Both businesses now operating under the Griffith Hack brand, within a specialist business, more closely aligned to their service offering.
on the one system. Due to COVID-19, teams have been virtually
integrated with physical offices retained. In May, IPH reached agreement with leading assurance tax and
advisory firm, Grant Thornton for the divestment of Glasshouse
Clients can benefit from access to a deeper pool of Advisory’s R&D tax and Export Market Development Grant practice to
IP experts in Australia. Grant Thornton.
Implementation of new IPH operating model into Griffith Hack. Remaining aspects of the business ceased operations by 30 June 2020.
On track for full year synergies of ~$2m from FY21.
2020 Full Year Results Investor Presentation | www.iphltd.com.au 27AJ Park update
Strengthening client service proposition in New Zealand
Proposed acquisition of Baldwins IP
AJ Park continues to hold the number 1 position
for patents and trade marks in New Zealand. • Proposed acquisition of Baldwins IP by AJ Park
was announced in June 2020.
Continued referrals to IPH group business in Asia – AJ Park is a • Under the proposed acquisition, the Baldwins firm
top ten client of IPH Beijing and Hong Kong practice. will join the AJ Park business and operate as part
of the one firm.
Appointment of new Managing Director, effective 1 June 2020.
• AJ Park and Baldwins are complementary
businesses in terms of their high quality and
Implementation of IPH operating model into AJ Park and
experienced teams and the acquisition will provide
appointment of new Executive Leadership Team from
additional depth of expertise to clients.
1 August 2020 with a renewed focus on the direction and
performance of the firm. • The transaction remains subject to clearance from
the New Zealand Commerce Commission.
Recognised as Employer of Choice in NZ Lawyer report.
2020 Full Year Results Investor Presentation | www.iphltd.com.au 28Investing in our people
Continued focus on our people across the group
Our people at IPH
900+
Employees across the region
Providing strong career paths Rewarding & recognising our people
• Continued career advancement and opportunities for people in key • Employee incentive awards for FY20 will be rolled out
parts of our businesses, with client facing promotions made across the in line with our usual schedule
IPH group for FY21
• Approximately AU$2.3 million in cash incentives and
• Building people leader capability across the group shares of the same value of the cash incentives will be
• Identifying talent and building pipeline for succession planning awarded to eligible business unit employees across
the group as part of the incentive program, including to
• New Spruson & Ferguson Australia Managing Director appointed from
employees in former Xenith businesses
existing IPH business, effective 17 August 2020
• 97%* of fee earning employees eligible for the
incentive plan will receive an award for FY20
* Fee earners on the incentive plan excludes departures during the year. 29WiseTime update
Growing customer base
Continued revenue growth
Growing customer base • Revenue growth in FY20.
for WiseTime autonomous
time-keeping technology
Sales outcomes
• Early adopter growth from small to medium sized firms
following v2 launch in September
• In Q4FY20, several large IP practices have deployed or
committed to deploy WiseTime to their firms
Product enhancement and consolidation
• WiseTime has been granted a core US patent for creating an
autonomous summary view of a user’s attention into a private
timeline
• Sale of DMS product has completed
2020 Full Year Results Investor Presentation | www.iphltd.com.au 30Looking ahead to FY21 05 31
Looking ahead to FY21
Continued focus on growth strategy despite COVID-19 impacts

                                                       Strategic priorities for FY21

                                                       01                                                                04
                                                                     Continue to leverage the expanded group                  Focus on attracting, motivating, developing
                                                                     and focus on Asia to develop network effect              and retaining our people

                                                       02
                                                                     Continue margin expansion and realise
                                                                     operational efficiencies across the group           05   Digital platform development

                                                       03                                                                06
                                                                     Realise benefits of operating model synergies and        Continued focus on potential overseas
                                                                     consolidated corporate services                          acquisitions in secondary IP markets

2020 Full Year Results Investor Presentation |   www.iphltd.com.au                                                                                                          32
Looking ahead to FY21
IPH remains well positioned to manage in an uncertain environment
IPH remains a resilient business with strong cash flow IPH continues to adopt a prudent approach to
generation and solid balance sheet metrics with no managing the business in a COVID-19 environment:
near term refinancing commitments • continued focus on the safety and wellbeing
of our people
Some disruption from COVID-19 on filing activity • continued tight control of discretionary expenditure
(AU/NZ and Asia)
• most remuneration increase decisions delayed for FY21
Weakening of US dollar will affect reported revenues.
Xenith IP integration:
• expect ~$2.5m in synergies (corporate savings and
Griffith Hack/Watermark integration)
• FY20 result included non-recurring legal case work
within Shelston IP
2020 Full Year Results Investor Presentation | www.iphltd.com.au 33Thank you
34Appendix 06 35
Strategic direction
Continued focus on IPH’s growth strategy

2020 Full Year Results Investor Presentation |   www.iphltd.com.au   36
Patent lifecycle
Long-life IP cycle supports consistent revenues and earnings

Each year more than half+ of the                                    Typical (indicative) foreign patent application route in Australia
total patent applications filed in
Australia come through the PCT
system in the form of PCT National
Phase patent applications.                                                                                                                                     Request           Examination
                                                                                                                                                               Examination*      Report issued**                                 Grant*
•   The process from filing the
                                                                                    31 months
    Australian application (or
    entering the Australian national                                                18 months
                                                                                                                                                 9-12 months       6-12 months                 12 months              4 months            up to 20 years
    phase) to grant of a patent                                                     12 months
    typically takes 2.5-3.5 years.
                                                                                                                                                                                   2.5 – 3.5 years
•   Patents can be renewed by
    paying official renewal fee                                                                                                                                                                                                             Renewals*
    annually up until the expiry of                                        Application                  PCT                    PCT             PCT National                                          Response to
                                                                           filed with                   International          International   Phase                                                 Examiners
    the patent 20 years from the                                           Patent Office                Application            Application     application                                           Report**
    filing date of PCT International                                       in country of                filed                  published       filed in
                                                                           origin                                                              Australia*
                                                                                                                                                                                                                   Acceptance*
    Application.

+ IPH Management estimate based on PCT filing information recorded on IP Australia as at 14/07/20 (FY20) and 7/07/19 (FY18-FY19)

                                                                                                                                                                                                                                                       37
* Revenue event – typically flag fall.
** Revenue event – typically combination of flag fall and hourly charges
Asia Pacific's leading IP
professional services group
www.iphltd.com.au 38You can also read