2020 Investor Day Growing Consumer Payments Driving New Flows
←
→
Page content transcription
If your browser does not render page correctly, please read the page content below
2020 Investor Day
                               Oliver Jenkyn
                               Chris Clark
Growing Consumer Payments      Charlotte Hogg
                               Andrew Torre
                               Eduardo Coello
                               Ryan McInerney
Driving New Flows              Bill Sheley
                               Kevin Phalen
Forward-looking Statements

This presentation contains forward-looking statements within the meaning of the U.S. Private Securities Litigation Reform Act
of 1995. Forward-looking statements generally are identified by words such as “will,” “is expected,” and other similar
expressions. Examples of forward-looking statements include, but are not limited to, statements we make regarding the
opportunities for growth, our strategy, future operations and outlook.

By their nature, forward-looking statements: (i) speak only as of the date they are made; (ii) are not statements of historical
fact or guarantees of future performance; and (iii) are subject to risks, uncertainties, assumptions or changes in circumstances
that are difficult to predict or quantify. Therefore, actual results could differ materially and adversely from Visa’s forward-
looking statements due to a variety of factors, including those contained in our Annual Report on Form 10-K for the fiscal year
ended September 30, 2019, and our other filings with the U.S. Securities and Exchange Commission.

You should not place undue reliance on such statements. Except as required by law, we do not intend to update or revise any
forward-looking statements as a result of new information, future developments or otherwise.

Please see end of presentation for notes and disclosures.

2                                                                                                         ©2020 Visa. All rights reserved.

Growing Consumer Payments

    2020 Investor Day
North America
Oliver Jenkyn
Regional President

         2020 Investor Day
North America: Overview                                                                                                                                                                  364M Population

                                            Visa Scale                                                              Opportunity                                                    Cash & Check = 33% of PCE

                                              ~1B                                                                               1B+
                                                      Cards                                                              New Credentials
    Credentials
                                                                                                                                                                                            Canada

                                          ~10M                                                                              10M+                                                                         U.S.
                                                   Merchant                                                                  Untapped
                                                                                                                             Merchants
Acceptance                                         Locations
                                                                                                                                                                                                          $4T

                                      $4T
                                     Payments
                                                                   76B
                                                                 Payments
                                                                                                                             $4T                                                   Cash & Check Opportunity
                                                                                                                                                                                   as a % of PCE:
                                                                                                                          Cash & Check                                                 High (>50% cash & check)
                                      Volume                    Transactions
                                                                                                                           Conversion
                                                                                                                                                                                       Moderate (25%-50% cash & check)
                                                                                                                           Opportunity
                                                                                                                                                                                       Low (
North America: Key growth levers
                                            North American clients prefer Visa because of
                                            our brand, our platform and our expertise
                                                                                                    19 / 25       Largest portfolios
                                                                                                                  are primarily Visa

                                                                                                    >70%
                                            • We lead with the largest partners in North America                  Win rate in fintech
                                                                                                                  deals
    Credentials                             • We are winning with fintechs

                                            Visa is opening up new acceptance in underpenetrated
                                                                                                      ~1M         Annual new
                                                                                                                  acceptance points

                                                                                                      25+
                                            segments and enabling new use cases                                   Transit systems
                                                                                                                  moving to tap to pay
Acceptance

                                            Visa is driving innovation to make it easier to pay
                                                                                                     300M         U.S. tap to pay cards in
                                                                                                                  force by EOY 2020
                                            • In-store (tap to pay)

Engagement
                                            • Online (click to pay)
                                                                                                   83 / 100       Top merchants accept
                                                                                                                  tap to pay

6     Sources: Nilson; U.S. Consumer Payment Panel Study; VisaNet Data; Visa Analysis.                        ©2020 Visa. All rights reserved.
Partnership strength: Leading partners choose Credentials Acceptance Engagement
Visa and outperform peers
Leading share with Visa partners outperform Visa partnership helps
largest partners our clients grow
Largest Visa Issuers vs. Visa Brand Premium
19 of 25 Largest North America Largest Competitor Issuers
10.7%
portfolios1 (3-Year View)2,3
8 of 10 Largest U.S. issuers2 1.1 ppt Faster growth U.S. Spend Lift4
4 of 5
Largest Canadian Visa Consulting & Analytics
credit issuers2 $65B Issuer volume New product design
Risk optimization
Digital marketing expertise
8 of 10 $1-1.5B Issuer revenue
Largest North America Spend momentum analysis
co-brands
Notes: 1. Includes debit and consumer credit; 2. Excludes American Express and Discover; 3. Visa’s Top 5 U.S. Issuers by payments volume vs. Competitor’s Top 5 U.S. Issuers 2015-2018, excludes PIN debit; 4. Transunion analysis
of their proprietary U.S. transaction database spanning over 310 million U.S. Visa- and MA-branded active credit cards showing spend lift (March 2017-March 2018 performance period), less Visa-calculated Costco effect; risk-
7 ©2020 Visa. All rights reserved.
adjusted balance line is calculated on the full database of 310 million active cards whereas spend lift is calculated based on a subset of active credit cards where Issuers send monthly payment data to Transunion.
Sources: Nilson; U.S. Consumer Payment Panel Study; Visa Consulting and Analytics Issuer Benchmark Study; TransUnion; Visa Operating Certificates; VisaNet data; Visa Analysis.
Fintech focus: Visa’s approach is successfully                                                                                                            Credentials       Acceptance           Engagement

driving growth

            U.S. consumers are                                                                           Fintechs are choosing                        We are winning with
            embracing fintechs                                                                            Visa because of our                            top partners

                 >70%                                                                                                                                    >70%
                                                                                                                      Brand Strength

                                                                                                                      Expertise and Trust
     of North America                                                                                                 •      Advice & consulting          Win Rate1
                                                                                                                             Experience
     consumers used a
                                                                                                                      •

    fintech app in 2019                                                                                               Fintech Fast Track
                                                                                                                      •      Streamlined onboarding
                                                                                                                      •      Ecosystem partners
                                                                                                                      •      Simple commercial
                                                                                                                             agreements

    Note: 1. Fintech win rate based on analysis of deals won as a percentage of total pool of deals over a certain size.
8                                                                                                                                                             ©2020 Visa. All rights reserved.
    Source: EY Global Fintech Adoption Index, % of digitally active consumers that used a money transfer or payments application; Visa Analysis.
Expand acceptance: Driving growth with new                                                                                                                                                                                Credentials       Acceptance           Engagement

segments and use cases

              $570B                                                                                $350B                                                                         $165B                                                 $120B
                       Rent1                                                                               Tuition                                                            Sports Wagering                                         Micromobility

Opportunity
Size in New
 Use Cases:
                                                      $50B                                                                   $26B                                                                 $17B                                            $16B
                                                      Unattended                                                                                                                                     Crowd-
                                                        Retail                                                                    Parking                                                            funding                                           Transit

    Note: 1. Data was researched by Euromonitor International plc for its client, Visa U.S.A. Inc. and its subsidiaries using industry standards. Euromonitor disclaims and excludes any and all liability for any loss
9                                                                                                                                                                                                                             ©2020 Visa. All rights reserved.
    suffered by any party as a direct or indirect result of the use of any of the Extracts.
    Sources: Euromonitor Consulting 2019 Visa Rent Payments; Sports Legalsportsbetting.com; Barclays Research, 2019; IBIS World, 2019; Fundly.com; Euromonitor Merchant Segment Study, 2018; APTA Factbook,
    2019; VisaNet Data.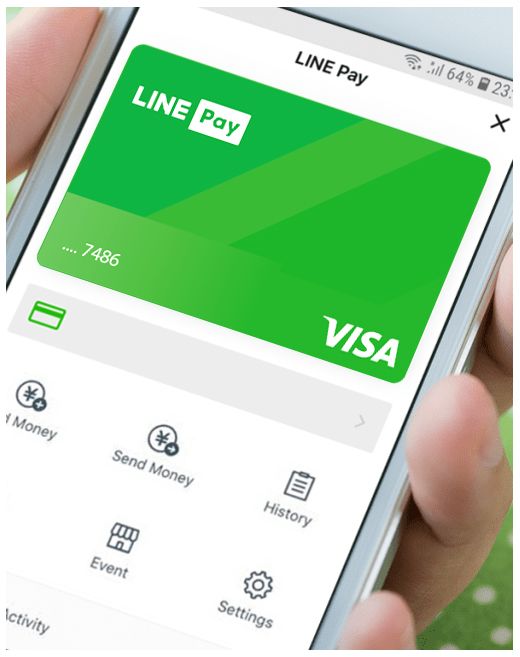
Expand acceptance: Driving growth with new               Credentials       Acceptance           Engagement

segments and use cases
NY MTA Momentum

     • 4,000,000 Visa taps in 8 months

     • ~60,000 Visa taps per weekday (on average)

     • ~30% stations enabled to date; full roll-out by
       end of 2020

10    Sources: Partner provided data; Visa Analysis.         ©2020 Visa. All rights reserved.
Expand acceptance: Driving growth with new Credentials Acceptance Engagement
segments and use cases
British
Columbia
Edmonton
Vancouver
Laval
Ottawa
Transit Systems: Por tland Toronto
Boston
Live and in Planning1 New York
25+
New Jersey
Chicago
Philadelphia
San Diego
Dallas
Honolulu
Houston Tampa
Miami
Note: 1. NA cities currently accepting tap to pay payments or where transit agencies are planning next-generation payment systems expected to support tap to pay payments; map
11 shows only cities where next-generation payment systems are currently operating or have been publicly announced. ©2020 Visa. All rights reserved.
Source: Public statements; Visa Analysis.Tap to pay: Frictionless way to pay in-store Credentials Acceptance Engagement
Cash remains prevalent in the U.S. Tap to pay displaces cash
Tap to pay drives
~20%
Americans average Cash still accounts for transaction lift in mature
12 55%
markets globally1
In the U.S. so far2
cash transactions of all transactions
per monthTap to pay: Frictionless way to pay in-store Credentials Acceptance Engagement
Tap to pay in the U.S. is poised for take-off
Issuer Side Merchant Side
145M tap to pay cards issued
today 8 of the top 10 merchants
accept tap to pay
300M tap to pay cards issued
by the end of 2020 83 of the top 100 merchants
accept tap to pay
17 of the top 25 issuers are
issuing tap to pay cards 69% of F2F transactions occur
at tap to pay merchants
13 Sources: VisaNet data; Visa Analysis. ©2020 Visa. All rights reserved.Click to pay: Frictionless way to pay online Credentials Acceptance Engagement
Today, guest checkout represents
approximately half of digital card not With click to pay, it can be as
present purchases and can involve 23 simple as two clicks
steps, taking almost three minutes
14 ©2020 Visa. All rights reserved.North America is Visa’s largest region and still has a huge
runway for future growth
North American clients prefer Visa because of our brand, our platform
and our expertise
• We lead with the largest partners in North America
Credentials • We are winning with fintechs
Visa is opening up new acceptance in underpenetrated segments and
enabling new use cases
Acceptance
Visa is driving innovation to make it easier to pay
• In-store (tap to pay)
• Online (click to pay)
Engagement
15 ©2020 Visa. All rights reserved.Asia Pacific
Chris Clark
Regional President
2020 Investor DayAsia Pacific: Overview 3.9B Population
Visa Scale Opportunity Cash & Check = 48% of PCE
970M 768M China
Cards Unbanked
Credentials $2.1T $1.4T
$1T
India Japan
20M 100M+
Merchant Untapped
Merchants
Acceptance Locations $1.1T
Southeast
Asia
$1.9T
Payments
30B
Payments
$6T Cash & Check Opportunity
as a % of PCE:
Cash & Check High (>50% cash & check)
Volume Transactions
Conversion
Moderate (25%-50% cash & check)
Opportunity
Low (Asia Pacific: Key growth levers
20+ Wallet partners
We are investing to rapidly grow Visa credentials with an
Credentials
increasingly diverse roster of clients 1B+ Users connected to
these wallets
We are opening up new acceptance in underpenetrated
segments and enabling new uses cases 2.3x Acceptance locations
vs. three years ago
Acceptance
Visa is making the payment experience frictionless to 41% Tap to pay penetration
in 2019
increase consumer engagement – tap to pay is a key part
Engagement of this strategy
Up to 3.8x Transactions per active
card for tap to pay users
$4.5T
Asia Pacific is a very diverse region and we operate in 46 Cash & check opportunity
markets – our approach is tailored to each market and its across Japan, India and
unique needs China
18 Sources: Public announcements and data provided by partners; Central Bank data; Oxford Economics; Euromonitor Merchant Segment Study, 2018; Visa Operating Certificates; VisaNet data. ©2020 Visa. All rights reserved.We are partnering with market-leading wallets to Credentials Acceptance Engagement
grow credentials and acceptance across Asia Pacific
Visa offers wallets greater payment functionality to both
consumers and merchants in their ecosystem
Across AP India South Korea Thailand, Indonesia,
Japan and Taiwan
20+
164M Users
4 Key Markets
Wallet partners 540M Users 16M Users For Taiwan:
16M Merchants
$8B Payments Volume
1B+ 2.5M Credentials
Users
China Other markets underway
65M+
Merchants Indonesia and Southeast Asia
50M+ Merchants 155M App Downloads
420K Merchants
Notes: LINE users represent Monthly Active Users, LINE Taiwan numbers represent LINE Pay Visa co-brand in Taiwan only.
19 ©2020 Visa. All rights reserved.
Sources: Public information; Data provided by partners; VisaNet data; Visa Operating Certificates.Tap to pay drives higher consumer engagement Credentials Acceptance Engagement
through frictionless payment experiences
Comparing tap to pay users vs. Tap to Pay Penetration (%)
non-users: 96% AU
Up to
Asia Pacific tap to pay penetration2 85% 88% SG
3.8x Transactions per active card1
29% 41% 82% NZ
2016 2019 67% TW
60%
Up to
1.8x
59% HK
47%
Spend per active card
33% 37% MY
Post tap to pay activation, 20%
cardholders make: 11% PH
3.9x
4% 8% IN
Transactions at fast food
restaurants
0.1% JP
Sep-11 Sep-12 Sep-13 Sep-14 Sep-15 Sep-16 Sep-17 Sep-18 Sep-19
2.3x Transactions at grocery stores
and supermarkets
Notes: 1. Active card refers to cards with at least one purchase during analysis period; 2. Based on face-to-face transaction processed by Visa.
20 ©2020 Visa. All rights reserved.
Source: VisaNet data.India: Capturing the $1T opportunity Credentials Acceptance Engagement
Visa is the credit and debit market share leader with strong momentum
19% CAGR
93% Driving credentials and acceptance through
fintech partnerships
• Google Pay: Tokenized credentials
Transactions
FY16 FY17 FY18 FY19
• Paytm: Debit, co-brand credit, tap to pay acceptance
20% CAGR Expanding credit access to large debit base
82% (50M+ credit cards vs. 800M+ debit cards in 2019)
• Co-brand partnership with large consumer platforms (Amazon Pay, Ola)
Payments Volume • Deploying installment payment solution
FY16 FY17 FY18 FY19
34% CAGR
Improving consumer engagement through frictionless
103%
payment experiences
• Market-specific solutions such as: Recurring payments platform
Acceptance1 with BillDesk, Visa Safe Click
FY16 FY17 FY18 FY19
• FY 2019 tap to pay penetration 14x vs. FY 2018
Demonetization
Note: 1. Number of merchant locations.
21 ©2020 Visa. All rights reserved.
Sources: Reserve Bank of India; VisaNet data; Visa Operating Certificates.Japan: Capturing the $1.4T opportunity Credentials Acceptance Engagement
Government’s cashless agenda Debit opportunity
Significant growth since 2016…
ePayment PCE penetration • Enable tap to pay, leveraging
Government
goal
strong issuers and growing
acceptance in everyday spend 31 11M 3x
categories Issuers Cards Debit Payments
40%
Volume & Transactions
24% • Maximize Olympic Games Tokyo
• Large untapped opportunity: debit penetrationChina: Capturing the $2T opportunity Credentials Acceptance Engagement
Strong existing Partnering to scale Preparing for market entry
business acceptance • Beijing Innovation Center
• Leading share among • 18x traditional acceptance points to help tailor solutions
international schemes in since FY 2016
7 of top 8 issuers representing
~120M cards in force • Growing penetration into
new merchant segments
and smaller cities
• Partnering with large wallet
platforms to drive a step change
growth in inbound acceptance
• Working with Chinese
government to continue to
• Growing fintech partnerships progress market entry efforts
to facilitate new use cases
23 Source: Visa Operating Certificates. ©2020 Visa. All rights reserved.Asia Pacific presents a significant long-term growth opportunity
We are investing to rapidly grow Visa credentials with an increasingly diverse roster of clients
Credentials
We are opening up new acceptance in underpenetrated segments and enabling
new uses cases
Acceptance
Visa is making the payment experience frictionless to increase consumer engagement – tap
to pay is a key part of this strategy
Engagement
Asia Pacific is a very diverse region and we operate in 46 markets – our approach is tailored
to each market and its unique needs
24 ©2020 Visa. All rights reserved.Europe
Charlotte Hogg
CEO
2020 Investor DayEurope: Overview 619M Population
Visa Scale Opportunity Cash & Check = 32% of PCE
560M 53M UK
Cards Unbanked
Credentials
$150B $580B
Germany
16M 10M+ Italy
Merchant Untapped Spain
Merchants Turkey
Acceptance Locations
$600B
$300B
$180B
$1.7T
Payments
41B
Payments
$3T Cash & Check Opportunity
as a % of PCE:
Cash & Check High (>50% cash & check)
Volume Transactions
Conversion
Moderate (25%-50% cash & check)
Opportunity
Low (Post integration, Europe is a stronger business poised for
accelerated growth
Team Capabilities Clients Performance
built our team enhanced our cultivated our realized greater financial
in local markets capabilities client base benefits than expected
+123% 100% +37% >2x
Increase in Clients migrated to Increase in Profit ahead of acquisition
client-facing staff VisaNet without incident client NPS business case
27 Source: Visa Analysis ©2020 Visa. All rights reserved.Europe: Key growth levers
Visa is partnering with fintechs in their efforts to digitize
payments and reach the unbanked
85M Neobank customers
by 2023
Credentials
We are broadening into new verticals, including opening
up transit opportunities across Europe 20% Growth in acceptance
locations since FY
2017
Acceptance
Visa is setting the pace in new authentication products
as the European regulatory landscape is changing
2x Open banking service
providers since 2018
Engagement
We are deploying specific strategies tailored to trends in
each key market
$2.0T Cash & check opportunity
across France, Germany,
Poland, Spain, Italy and
Turkey
28 Sources: ATKearney European Retail Banking Radar 2019; Registrations with National Competent Authorities in Europe, 2Q19 to 3Q19; Visa Operating Certificates. ©2020 Visa. All rights reserved.We are making meaningful progress across Credentials Acceptance Engagement
fintech segments
Fintech Fast Track
New end-to-end approach, shortening the onramp
Category Country Fintech for fintechs to partner with Visa
46
UK
Digital Banks Lithuania
Switzerland
Unbanked fintech deals
Turkey
Focus signed
84
XB Specialists Turkey
Lending UK
UK
B2B
Estonia active fintech
pipeline
Wallet France
29 Source: Visa Analysis. ©2020 Visa. All rights reserved.Acceptance growth comes through expansion Credentials Acceptance Engagement
across new segments, markets and payment flows
Growth vector Success stories
Acquirer Rallye – Small business campaign
Reach small businesses
1 across Germany geared towards welcoming
in key markets international payment schemes
20% growth
Soft POS launch to accept tap to pay on any in acceptance
Enable acceptance Samsung device locations since 2017
2
via new channels
Expand to sectors Vending solutions to address payments UX and
connectivity issues at >35K vending machines
3 in which cards are
underpenetrated
70% tap to pay
penetration
Develop acceptance Electric vehicle solutions address UX and
roaming payments across charging network
4 in segments with low
card usage
Note: First Data is now Fiserv.
30 ©2020 Visa. All rights reserved.
Sources: Visa Operating Certificates; Visa Analysis.Transit creates a ‘halo’ effect in tap to pay Credentials Acceptance Engagement
enabled markets
From the launchpad of London we are now enabling public transportation across the region
London, Madrid, Milan, Rome,
Edinburgh, Manchester, Florence,
2x
Warsaw, Dijon, Prague, Glasgow,
Gdańsk, Lodz...
Greater increase
in transactions by
tap to pay TfL users
35
70%
Higher growth
Transit systems
in spend by tap
launched to
to pay TfL users
date
Visa Ready for Transit program
• Expert guidance to transit operators
40
Transit systems
• Visa certification for third-party products in pipeline
• Speed of delivery in close partnership
with technology providers
31 Sources: VisaNet data; Visa Analysis. ©2020 Visa. All rights reserved.We are well positioned as open banking Credentials Acceptance Engagement
accelerates in Europe
Authentication solutions already in market to Visa’s broad reach and connectivity to financial institutions
support clients as they prepare for PSD2 & SCA put us in a strong position to scale open banking services
App Developers
3D secure 2.2 Enhanced 3DS to manage SCA
exemptions and improve UX
Lending
Visa delegated Allows issuers to “delegate”
authentication authentication to a 3rd-party
Brokerage / Banking
Visa transaction Helps acquirers and merchants identify Financial Open Banking Consumer /
advisor low risk transactions for SCA exemption Institutions Platform Business User
Personal Finance
Visa trusted listing Accelerates checkout experiences
by “trusting” preferred merchants Business Finance
Helping the ecosystem champion security Enabling the ecosystem to deliver secure
without jeopardizing the consumer experience innovation to better delight consumers
32 ©2020 Visa. All rights reserved.On the continent, we have market-specific Credentials Acceptance Engagement
strategies to fuel growth over the next several years
Germany Italy Spain
Cash & Cash & Cash &
Check PCE
Launch Debit as a platform Check PCE
As government incentives Check PCE
for everyday use and for promote e-payments, Focus on cash
innovation, including increase presence displacement in transit
eCommerce, mobile and with clients to help and tourism
$580B $600B $300B
international them capture growth
France Poland Turkey
Cash & Cash & Cash &
In advance of Paris 2024 With the help of the
Check PCE Check PCE Check PCE Support issuers and
Olympics, develop tap government Cashless
fintechs targeting the
to pay for public transit Poland initiative, build
unbanked, build tap to
and improve acceptance acceptance among small
$220B $150B $180B pay and eCommerce
of overseas cards businesses
33 Sources: Central Bank data; Oxford Economics; Euromonitor Merchant Segment Study, 2018; World Bank population statistics. ©2020 Visa. All rights reserved.Germany: A new approach to penetrating Credentials Acceptance Engagement
a nearly $600B cash & check opportunity
Through a refreshed strategy, we are creating ...and our efforts are beginning to deliver,
a flywheel for future growth... laying the foundation for growth
3X increase
in market staff
68% Visa Debit share of new
cards issued
Increase
Attack with
brand
Debit Visa Debit
80%+
awareness
Acceptance locations that
are tap to pay enabled
Deliver in-market
DPS Expand
acceptance 60% Clients using Value Added Services
to drive loyalty and usage
issuer processing
34 Sources: Oxford Economics; Visa Analysis. ©2020 Visa. All rights reserved.Our strategies will accelerate growth across all of Europe
Visa is partnering with fintechs in their efforts to digitize payments
and reach the unbanked
Credentials
We are broadening into new verticals, including opening up transit
opportunities across Europe
Acceptance
Visa is setting the pace in new authentication products as the European
regulatory landscape is changing
Engagement
We are deploying specific strategies tailored to trends in each key market
35 ©2020 Visa. All rights reserved.Central Europe, Middle East
and Africa (CEMEA)
Andrew Torre
Regional President
2020 Investor DayCEMEA: Overview 2B Population
Visa Scale Opportunity Cash & Check = 74% of PCE
360M 680M Russia &
Eastern Europe
Cards Unbanked
Credentials
$600B
Middle East
5M 60M+ Africa
$700B
Merchant Untapped
Merchants
Acceptance Locations
$1.2T
$480B
Payments
19B
Payments
$2.5T Cash & Check penetration
as a % of PCE:
Cash & Check High (>50% cash & check)
Volume Transactions
Conversion Moderate (25%-50% cash & check)
Opportunity
Low (CEMEA: Key growth levers
Visa is partnering with fintechs, neobanks and wallets
to enable new payment experiences 200M+ Potential credentials
with wallet partners
Credentials
We continue to accelerate growth by enabling new types
of merchants and distributors 27% Increase in acceptance
in the last year
Acceptance
Visa is leading the evolution to seamless and secure commerce
through tap to pay 52% Growth in tap to pay
penetration over last year
We are helping governments meet increasingly complex
payment demands 12+ Government partnerships
launched or planned
Engagement
Visa is co-creating customized value propositions for unique
market and segment needs 65% Share of affluent spend
in CEMEA
We are partnering with leading players in Sub-Saharan Africa 2/3 of people 15+ without
a bank account
38 ©2020 Visa. All rights reserved.
Sources: Global Monthly Tap to Pay reports, Oct-18 and Sept-19; World Bank Global Findex Database, 2017; Projections based on Visa Operating Certificates; VisaNet data.Visa is the partner of choice for fintechs, Credentials Acceptance Engagement
delivering Visa credentials to new users
Visa’s Fintech Fast Track
Program provides a one-
stop platform for new Issuing credentials with Supported by an
players to establish open fintechs, neobanks and ecosystem of enablers
loop wallets / capabilities digital wallets and funds / accelerators
and scale their offerings
Fintech Progress
>75% deal success rate1
31 partnerships
4 investments
12 fintech launches Examples of partnerships
Note: 1. Deal success rate based on analysis of deals won as a percentage of total pool of deals over a certain size.
39 ©2020 Visa. All rights reserved.
Source: Visa Analysis.Transforming Visa go-to-market and solutions Credentials Acceptance Engagement
to grow acceptance with merchants
Go-to-market approaches Examples of recent efforts and partnerships
1 Grow F2F acceptance in the
SME segment by partnering
SME acceptance across 10 African markets
~27%
Increase in acceptance
with new distributors and Low-cost terminals in South Africa locations in the last year
traditional acquirers
700K+
Enabling terminals for Visa acceptance
New POS
2 Expand eCommerce Gateway for Chat Commerce outlets
acceptance by enabling new
and innovative use cases eCommerce acceptance in Nigeria
400K+
New QR /
Build new value propositions Microlending to merchants USSD / Soft
3
for acquirers and merchants POS outlets
40 Source: Visa Operating Certificates; Visa Analysis. ©2020 Visa. All rights reserved.Leading the evolution of seamless and secure Credentials Acceptance Engagement
digital commerce through tap to pay
Highest Visa region #10 Russia - 83%
In F2F tap to pay penetration
~16% #1 Georgia - 96%
52% Increase in
active
Growth of tap to pay penetration in cardholder
CEMEA over the last year spending from
tap to pay CEMEA F2F tap to pay penetration
Enablers
Very High (>80%)
activation
High (50%-80%)
Moderate (20%-50%)
Tokenization >200% in 2019 Low (Driving innovation, new use cases and Credentials Acceptance Engagement
payments volume with local switches
Examples of partnerships Key partnership components
New Value
Visa on New
products Tokenization Added
mobile flows
• Launch of Multicurrency Prepaid with The Saudi and services Services
Tailored
Investment Bank to all government employees
payment
• Enabling domestic eCommerce with Saudi Payments
solutions
$8.2B opportunity size of government purchases1
• Rollout P2P, Tokenization and Mobile Apps with HPS
Value Added
domestic switch in Morocco
Services
Only 4% use mobile phone to access a bank account
Local • Building domestic infrastructure in South Africa
processing 22% YoY growth in Visa transactions
Ecosystem • Digitization of payments and financial inclusion
in Cote d’Ivoire
development
59% of people unbanked
12+ launched or planned government engagements and partnerships with local switches
Note: 1. Based on total value of government B2B purchases in 2019.
42 ©2020 Visa. All rights reserved.
Sources: World Bank Global Findex Database, 2017; Euromonitor; VisaNet data; Visa analysis.Delivering customized solutions for Credentials Acceptance Engagement
sophisticated and affluent cardholders
Affluent consumers drive outsized impact Visa continuously updates and tailors offers
for Visa’s business in CEMEA based on customer preferences and needs
Examples of recently launched product benefits include:
Affluent drives 30% of Visa CEMEA volumes
Free Unlimited Free Visa Airport
airport internet luggage airport fast-lane
Travel transfers abroad wrapping check-in
Affluent cards see ~15x higher cross-border
spend vs. other cards1
Dining City taxi Premium Online Cinema
discounts trip grocery retailer discounts
~65%
Lifestyle discounts offers offers
Visa holds share of affluent spend2
Customer awareness of benefits drives 25% higher card spend
Notes: 1. Affluent cards considered to be Visa Platinum, Signature and Infinite; 2. Calculated based on World Bank reported international travel and tourism expenditures from KSA, 2017.
43 ©2020 Visa. All rights reserved.
Sources: VisaNet data; Visa Analysis.Partnering with leading African players on Credentials Acceptance Engagement
credentials, acceptance and engagement
Credentials
Sub-Saharan Africa
Market-at-a-Glance
18.4 Median age vs.
Engagement
30.3 globally
Acceptance
2.4x Higher annual population
growth than global
~3% Card PCE penetration
(excl. South Africa)
2/3 of people 15+
without a bank account
46% of the world’s
mobile money users
Sources: World Bank Development Indicators; Euromonitor Soci-Economic Indicators; Central Bank data; Oxford Economics; Euromonitor Merchant Segment Study, 2018; World Bank Global Findex Database, 2017; GSMA State of
44 ©2020 Visa. All rights reserved.
the Industry Report on Mobile Money, 2018.CEMEA has huge growth potential driven by bringing new
consumers and sellers in the financial system
Visa is partnering with fintechs, neobanks and wallets to enable new payment experiences
Credentials
We continue to accelerate growth by enabling new types of merchants and distributors
Acceptance
Visa is leading the evolution to seamless and secure commerce through tap to pay
We are helping governments meet increasingly complex payment demands
Engagement
Visa is co-creating customized value propositions for unique market and segment needs
We are partnering with leading players in Sub-Saharan Africa
45 ©2020 Visa. All rights reserved.Latin America and Caribbean (LAC)
Eduardo Coello
Regional President
2020 Investor DayLAC: Overview 630M Population
Visa Scale Opportunity Cash & Check = 65% of PCE
Central America and
478M 212M
$465B The Caribbean
$280B
Mexico
Cards Unbanked
Credentials
Brazil
Andean $680B
12M 50M+
and South $600B
Cone
Merchant Untapped
Merchants
Acceptance Locations
$413B
Payments
14B
Payments
$2T Cash & Check Opportunity
as a % of PCE:
Cash & Check High (>50% cash & check)
Volume Transactions
Conversion
Moderate (25%-50% cash & check)
Opportunity
Low (LAC: Key growth levers
Visa is poised to capitalize on the rapidly developing digital
ecosystem and grow credentials through fintechs and enablers 62% Smartphone penetration
in Latin America
18M
Innovation is driving Visa issuance on previously proprietary Credential opportunity
Credentials
local networks currently on local schemes
$535B
Visa is displacing cash by growing acceptance, embracing Visa cash volume –
digital platforms and improving the consumer experience 1.3x payments volume
Acceptance
12 ppts
Increase in domestic
Visa’s growth in domestic processing will diversify revenue,
processing penetration
accelerate digital deployment and improve client performance in last 5 years
2x
Engagement Visa takes a customer-centric approach to increasing Tap to pay penetration
engagement through improved experiences growth last year
$40B
Brazil is a great example of how Visa leverages our deep market Payments volume
knowledge and client understanding to deploy unique, opportunity from focused
cash conversion efforts
customized solutions by market and segment
48 Sources: GSMA Intelligence; World Bank; IBGE; Bacen; Visa Operating Certificates; Visa Analysis. ©2020 Visa. All rights reserved.Rapid digital adoption drives new opportunities Credentials Acceptance Engagement
to deploy Visa credentials
Visa is partnering with enablers like
22M
~2
months on Regional SuperApp users
average to set
up new issuer
Launched by
that make it quick and easy for….
Paraguay white label
~50%
of issuer clients
issuer wallets
Banks Wallets
Neobanks Fintechs
84%
of Visa credentials
Uruguay multi-issuer wallet enabled
…to issue digital credentials
49 Sources: Client statements; Visa Analysis. ©2020 Visa. All rights reserved.Innovation is driving Visa issuance on previously Credentials Acceptance Engagement
proprietary local networks
Chile
As payments innovation Partnership with Banco Estado
accelerates, local networks
12M 60% 37%
look to partner with Visa
to deliver value to their
cardholders cards converted of the total of POS debit
to Visa Debit debit cards transactions
• Tokenization
• Click to Pay
• Fast Funds Top Caribbean issuers that own local
networks are transforming proprietary
• Installments closed loop portfolios from a cost center
to a revenue center via Visa partnership
50 Source: Superintendencia de Bancos e Instituciones Financieras; Visa Analysis. ©2020 Visa. All rights reserved.Converting cash on Visa credentials to the Credentials Acceptance Engagement
point of sale is a unique growth opportunity
Visa approach
Cash represents 1 Work with new acquirers
and payment facilitators
~300K
>50% of LAC’s PCE to expand acceptance
New merchants reached since initial
Visa partnership in 2017
2 Improve the consumer
experience at POS
Tap to pay Click to pay
$535B in cash was
withdrawn on a Visa
credential in 2019
3 Educate the ecosystem
4.4%
Lift in number of transactions due to merchant
and cardholder campaigns in Peru
51 Sources: Euromonitor; Oxford Economics; World Bank; Millward Brown Brand Lift Study; Visa Operating Certificates. ©2020 Visa. All rights reserved.Visa increased domestic processing penetration Credentials Acceptance Engagement
in LAC by 12 ppts in the past five years
Domestic processing wins in the past 5 years
Domestic processing benefits:
Mexico: First issuer live for
Enhances and diversifies Visa authorization transactions
revenue on core payment flows
Guatemala: 93% of
authorization transactions
Puerto Rico: 76% → 100%
Accelerates Visa’s digital innovation
of credit transactions
Colombia: 100% of
Rappi transactions
Improves Visa client performance Peru: 16% → 86% of
through Value Added Services authorization transactions
Argentina: 0% → 80% of transactions,
100% expected by 2020
Facilitates deployment of new flows Uruguay: 0% → 40% of
authorization transactions
52 Source: Visa Analysis. ©2020 Visa. All rights reserved.A commitment to understanding the end Credentials Acceptance Engagement
consumer has deepened engagement
Visa initiatives
Affluent
Revitalization
+14% +20%
affluent account growth domestic and cross-border
payments volume growth
Strong consumer
engagement drives Tap to Pay 2x ~50%
partnership with Deployment tap to pay penetration of F2F transactions in
clients and in one year Costa Rica and Chile
mutual growth
Visa Loyalty
Solutions:
49 89% 45%
clients are using customer redemption of reward
My Rewards the platform and satisfaction rate points by registered
Platform 33 clients in pipeline users
53 Source: Visa Analysis. ©2020 Visa. All rights reserved.Visa is well positioned to capture rebounding Credentials Acceptance Engagement
economic growth in Brazil
Grow credentials Expand acceptance Deepen engagement
New significant wins Focused cash conversion 500K taps in the first 6 months
and renewals by delivering efforts in ~200
unique, superior value underpenetrated cities to 400K tap to pay cards
to clients reach ~$40B opportunity1 issued in Rio
96.5% retention of new users
+ Opportunity
40 new players enabled 60K new merchants
in the last 18 months in the last 12 months
Note: 1. Incremental payments volume if targeted regions reach average penetration, assuming 60% Visa share.
54 ©2020 Visa. All rights reserved.
Sources: World Bank; IBGE; Bacen; Visa Analysis.Substantial growth opportunity exists in LAC from
converting cash and expanding our network
Visa is poised to capitalize on the rapidly developing digital ecosystem and grow credentials through
fintechs and enablers
Credentials Innovation is driving Visa issuance on previously proprietary local networks
Visa is displacing cash by growing acceptance, embracing digital platforms and improving
the consumer experience
Acceptance
Visa’s growth in domestic processing will diversify revenue, accelerate digital deployment and
improve client performance
Engagement Visa takes a customer-centric approach to increasing engagement through improved experiences
Brazil is a great example of how Visa leverages our deep market knowledge and client understanding
to deploy unique, customized solutions by market and segment
55 ©2020 Visa. All rights reserved.Driving New Flows
Ryan McInerney
President
2020 Investor DayOur new flows expand our total addressable market by extending
our reach into new use cases through a Network of Networks
Consumer Payments New Flows Value Added Services
Grow the two-sided network Expand our Network of Drive utilization of our
by expanding Visa credentials Networks to capture new services to help our clients
and acceptance points and sources of payments and grow profits and deepen our
driving user engagement money movement between partnerships
individuals, businesses and
governments
57 ©2020 Visa. All rights reserved.The market opportunity in new flows is 10x the cash and check
currently in consumer payments
$185T
B2B B2b B2C P2P G2C
$120T $5T $30T $20T $10T
• SME, T&E, Fleet, • Merchant • Insurance • Friends and • Government
Purchasing Settlement • Payroll Family Benefits
• Receivables, • Marketplaces • Gig Economy • Remittances • Tax Refunds
Payables • Alternative
• Cross-border Lending
58 Sources: McKinsey Global Payments Map and Visa Analysis. ©2020 Visa. All rights reserved.We think about new flows in two broad groups in terms of
customer needs and use cases
$65T $120T
Lower value, higher velocity flows Higher value, lower velocity flows
P2P B2C Card-based Cross-border
$20T $30T $20T $10T
B2b G2C Domestic AR / AP
$5T $10T $90T
59 Sources: McKinsey Global Payments Map and Visa Analysis. ©2020 Visa. All rights reserved.Visa Direct with Earthport meets the needs for the $65T of lower
value, higher velocity flows for consumers and small businesses
$65T
Lower value, higher velocity flows
P2P B2C
$20T $30T
B2b G2C
$5T $10T
60 Sources: McKinsey Global Payments Map and Visa Analysis. ©2020 Visa. All rights reserved.Visa Direct with Earthport meets the needs for the $65T of lower
value, higher velocity flows for consumers and small businesses
$65T
Lower value, higher velocity flows
P2P B2C Visa
Direct
$20T $30T
B2b G2C
$5T $10T
61 Sources: McKinsey Global Payments Map and Visa Analysis. ©2020 Visa. All rights reserved.Unique solutions meet the needs of higher value,
lower velocity flows from commercial clients
$120T
Higher value, lower velocity flows
Card-based Cross-border
$20T $10T
Domestic AR / AP
$90T
62 Source: McKinsey Global Payments Map and Visa Analysis. ©2020 Visa. All rights reserved.Unique solutions meet the needs of higher value,
lower velocity flows from commercial clients
$120T
T&E,
Higher value, lower velocity flows
Purchasing,
Small
Business,
Virtual Card-based Cross-border
$20T $10T
Visa B2B
Connect Partnerships Domestic AR / AP
$90T
63 Source: McKinsey Global Payments Map and Visa Analysis. ©2020 Visa. All rights reserved.In today’s discussion, we will cover the new flows
opportunity in each segment
Visa Direct - $65T Commercial Solutions - $120T
Bill Sheley Kevin Phalen
P2P B2C Card-based Cross-border
$20T $30T $20T $10T
B2b G2C Domestic AR / AP
$5T $10T $90T
64 Sources: McKinsey Global Payments Map and Visa Analysis. ©2020 Visa. All rights reserved.How do
you want to
get paid?
Visa Direct
65 ©2020 Visa. All rights reserved.Key takeaways
Large market opportunity to digitize P2P, B2C and small business flows
Proven business model operating at scale
Premier real-time payments platform built on global reach
and processing infrastructure
Growing partner ecosystem and supply chain to accelerate growth
Investing in the future to ensure Visa Direct remains the money movement
network of choice for faster disbursements around the world
66 ©2020 Visa. All rights reserved.Visa Direct enables clients to deposit funds into recipient accounts
for consumers and small business, addressing $65T in new flows
Pull Transaction Push Transaction
eCommerce Checkout ATM Withdrawal Insurance Marketplaces
In-App Purchases Point of Sale Transactions On Demand Merchant Settlement
To be the best way to pay and be paid for everyone, everywhere
67 Sources: McKinsey Global Payments Map and Visa Analysis. ©2020 Visa. All rights reserved.Visa Direct powers trusted “open money movement” ecosystem
Payout Enablers Global Endpoints
Single operational Ubiquitous, real-time
connection efficiency money movement
Acquirers Cards – Debit / Credit / Prepaid
Processors Bank Accounts
Gateways Wallets
Banks Direct
Global platform for
Commerce Platforms real-time payments
Scaled, global Network of Networks
distribution channels Trusted, “Open” Network
Marketplaces Card Networks
Mobile Earthport – ACH / RTP
Messaging Member Banks
Payroll Regional Networks
ERP
68 ©2020 Visa. All rights reserved.Visa Direct is underpinned by Visa’s secure and reliable
global payments network
Global Reach Risk Management Processing Capabilities
• Over 200 countries and • Trusted network of institutions • Visa settlement
territories with new program reviews
• 160 currencies
• 99% coverage of banked • Real-time watchlist screening
consumers and small business1 • Enhanced reconciliation
• Transaction limits reporting
• 130 countries enabled for
real-time payouts • Activity monitoring • Disputes / exception handling
• 75 countries enabled for • Real-time authorization • Full API Suite
real-time cross-border payouts
• Tokenization • Message translation
Note: 1. In 88 countries.
69 ©2020 Visa. All rights reserved.
Source: Visa Analysis.Visa Direct enables dozens of new use cases and flows...
Visa Direct Set-plays Attacking the Market in a Structured Way
Example use cases
1 Vertical Market Strategy
P2P REMITTANCE INSURANCE
2 Customer-focused Solutions
GIGM
WAORRKKEETRP LPAACYEOSU T S PAYROLL, WAGE ACCESS
3 Strategic Investment
Direct
4 Enabler Readiness A L T EMRANRAKTEITVPEL LAECNE D
S ING SMALL BUSINESS R E M IETRTPA N C E
5 Product Sales & Marketing
70 ©2020 Visa. All rights reserved....with end-to-end ecosystem support for Visa partners
Solution Consulting Performance, Risk and Business Enablement and
and Innovation Compliance Monitoring Commercialization Support
71 ©2020 Visa. All rights reserved.Visa’s network effect enables fast growth and global
operating scale
Visa Direct Performance
Fiscal Year 2019 Visa Direct vs. Visa Debit Payments Volume Growth
Programs 250
Visa Visa
130M
Payments Volume Growth
Active Users Direct Debit
2B
From First Year
Transactions
Visa Direct:
Quarterly Run Rate 2x faster
11 B 68 B
growth than
Debit
$ $ Years Post-Launch
Q4 2016 Q4 2019
72 Sources: Visa Historical Reports; Visa Operating Certificates; VisaNet data. ©2020 Visa. All rights reserved.P2P REMITTANCE INSURANCE
Visa Direct enables
dozens of new use
GIGM
WAORRKKEETRP LPAACYEOSU T S PAYROLL, WAGE ACCESS
cases and flows Direct
A L T EMRANRAKTEITVPEL LAECNE D
S ING SMALL BUSINESS R E M IETRTPA N C E
73 ©2020 Visa. All rights reserved.P2P: We have made significant progress in the
$20T P2P segment
100+ P2P programs and counting are powered
by Visa Direct globally
7 of 7 of major global players are active or
launching with Visa Direct
>100% Visa Direct YoY growth rate for P2P
programs
74 Sources: “’Yape’, app del BCP, alcanzó el millión de usuários,“ Publimetro, 2019; VisaNet data. ©2020 Visa. All rights reserved.Cross-border: Remittances started to go live
in 2019 and will expand significantly in 2020
75+ countries enabled for real-time
cross-border payouts
5 of 7 top global remitters live or
implementing Visa Direct
50% of MoneyGram’s Visa Direct service users are
first time MoneyGram customers
Multichannel pay out to
cards and accounts across
the globe
75 Sources: MoneyGram press release; VisaNet data. ©2020 Visa. All rights reserved.Insurance: Enabling a digital claims experience
9+
insurance segments: health, auto, life,
property, pet, casualty, homeowner,
disability, disaster
~60% surveyed customers believe payments took
longer than they thought it should
5 of 10 top P&C insurers partner with Visa Direct
Toughest moments made
better with real-time claim
payouts
76 Sources: Visa Direct Research, J.D. Power 2017 U.S. Auto Claims Satisfaction Study; “What types of insurance do you need?” Motley Fool, 2019. ©2020 Visa. All rights reserved.Gig Economy: Drivers, freelancers,
contractor payments
$4.5T total global gig economy estimated spending
57M Americans working in gig economy
70% of Postmates driver deposits are made using
Instant Deposits powered by Visa Direct
Providing on-demand
workers with
on-demand pay
77 Sources: Staffing Industry Analysts (SIA) US Gig Economy, 2019; Visa Digital Disbursements Consumer Preference Study, 2017; Visa and Postmates data. ©2020 Visa. All rights reserved.Payroll: Early wage access driving payments
innovation and new payroll solutions
for employees
78% of U.S. full-time workers are living paycheck to
paycheck
95% of employees are interested in working for an
employer who provides earned wage access
400% Visa Direct YoY growth rate for
payroll programs Helps employees access
their wages early when
they need it
78 Sources: 2019 Earned Wage Access Insights; Accenture Research; VisaNet data. ©2020 Visa. All rights reserved.Marketplaces: Visa Direct plays an important
role in facilitating payouts for small sellers
$2T total spend on top 100 online marketplaces
3-5 days is the average time a seller waits for
access to their proceeds
~30% of Mercari sellers have enrolled in Instant Pay
with Visa Direct
Providing earnings to
online sellers
faster than ever
Sources: “Top Online Marketplaces 2018,” Digital Commerce 360; “The Merchant’s Guide to Instant Credit Card Processing, Instant Deposits, & Getting Your Funds Fast,” Merchant
79 ©2020 Visa. All rights reserved.
Maverick, 2020; “5 Challenges of Selling Via Cross-Border Marketplaces,” Pitney Bowes.Small business: Visa Direct is helping small
businesses better manage cash flow with
faster settlement and loan disbursements Seamless integration with
a platform small
businesses already use
every day
61% of small businesses report that cash flow
is a regular concern
79% of small businesses want faster settlementERP platforms: Enabling Visa Direct for
payouts to individuals and small businesses
Visa Employee Digital
Expense Reimbursement
$35T the size of the Global B2C and B2b
disbursements market
85% U.S. firms planning to make real-time payments
integral to their operations within 3 years
430K customers across 175 countries on Oracle
platform
Digitizing and simplifying
employee expense
reimbursements
81 Sources: McKinsey Global Payments Map and Visa Analysis; Making real-time payments a reality study, Pymnts.com, 2020; Oracle Investor website. ©2020 Visa. All rights reserved.Key takeaways
Large market opportunity to digitize P2P, B2C and small business flows
Proven business model operating at scale
Premier real-time payments platform built on global reach
and processing infrastructure
Growing partner ecosystem and supply chain to accelerate growth
Investing in the future to ensure Visa Direct remains the money movement
network of choice for faster disbursements around the world
82 ©2020 Visa. All rights reserved.In today’s discussion, we will cover the new flows
opportunity in each segment
Visa Direct - $65T Commercial Solutions - $120T
Bill Sheley Kevin Phalen
P2P B2C Card-based Cross-border
$20T $30T $20T $10T
B2b G2C Domestic AR / AP
$5T $10T $90T
83 Sources: McKinsey Global Payments Map and Visa Analysis. ©2020 Visa. All rights reserved.Businesses and governments make $120T in payments
globally for the purchase of goods and services
$120T
Card-based Cross-border Domestic AR / AP
$20T $10T $90T
• Distributed • Security, reliability • Operational efficiency
employee spend • Speed • Linking payment to data
Needs • Expense tracking • Rich data about the payment
• Fraud controls • Geographic reach • Reconciliation
• Transaction data • Payment visibility • Digitization of paper
Primary • T&E, Purchasing, • Visa B2B Connect • Partnerships
Small Business,
Solutions Virtual
84 Sources: McKinsey Global Payments Report and Visa Analysis. ©2020 Visa. All rights reserved.Card-based and cross-border flows represent 25% of the
volumes but 75% or more of the revenue opportunity
Addressable Payments Addressable Revenue
Volume Opportunity ($T) Opportunity ($B) Key Focus Areas
to Drive Growth
120 70-100
Drive growth in established
1
Card-based Solutions 20 card-based business
Cross-border 10
Systematically execute
Domestic AR / AP 2 strategy to scale Visa B2B
Connect
90 Test and learn in domestic
3 non-card B2B payments by
adding value beyond the
transaction
85 Sources: McKinsey Global Payments Report and Visa Analysis. ©2020 Visa. All rights reserved.$20T in B2B payments can be addressed with
higher-yielding card-based solutions
Card-based
opportunity is as
Card-based Cross-border Domestic AR / AP
large as consumer
payments cash
$20T $10T $90T digitization
• Distributed • Security, reliability • Operational efficiency opportunity
employee spend • Speed • Linking payment to data
Needs • Expense tracking • Rich data about the payment
• Fraud controls • Geographic reach • Reconciliation
• Transaction data • Payment visibility • Digitize paper
Primary • T&E, Purchasing, • Visa B2B Connect • Partnerships
Small Business,
Solutions Virtual
86 Sources: McKinsey Global Payments Report and Visa Analysis. ©2020 Visa. All rights reserved.We are the B2B leader with $1T+ of Payments Volume
$1.1T
CY 2019 B2B Products Enabling Platforms
Payments
Volume
Visa Business
Small Business
CY 2018 B2B Payments Volume ($B)
980 Visa Corporate
T&E, Purchasing Visa Business
Reporting
657
486 Virtual (single use) Visa Compliance
Management
Visa Data Analytics
Fleet
Visa Fleet
Visa Mastercard American
Express
87 Sources: American Express and Mastercard company filings. ©2020 Visa. All rights reserved.We are enhancing our leading position by focusing
on four areas to capture this $20T opportunity
Geographic Streamline
Expansion and Accelerate Extend to
Drive Digital Acceptance New Verticals
• Accelerate client onboarding • Build on leading position in • Eliminate friction • Enable additional vertical-
consumer to target specific use cases
• Expand use cases through markets with nascent • Grow straight through
provisioning to mobile wallets processing – Government
commercial volume – Travel
• Improve user experience • Ride broader trend in • Simplify virtual card – Gig economy
through mobile, expense markets moving from acceptance and drive – Healthcare
management, reporting cash to digital industry standards
• Enable through global APIs • Adopt local solutions • Support flexible
leveraging global interchange
88 Sources: McKinsey Global Payments Report and Visa Analysis. capabilities ©2020 Visa. All rights reserved.$10T in cross-border flows represent a lucrative and largely
untapped opportunity
$120T
Card-based Cross-border Domestic AR / AP
$20T $10T $90T
• Distributed • Security, reliability • Operational efficiency
employee spend • Speed • Linking payment to data
Needs • Expense tracking • Rich data about the payment
• Fraud controls • Geographic reach • Reconciliation
• Transaction data • Payment visibility • Digitize paper
Primary • T&E, Purchasing, • Visa B2B Connect • Partnerships
Small Business,
Solutions Virtual
89 Sources: McKinsey Global Payments Report and Visa Analysis. ©2020 Visa. All rights reserved.Visa B2B Connect enables high value, low volume
cross-border transactions directly between banks
Existing Network of Bilateral Relationships Visa B2B Connect Multilateral Network
Payments routed through bilateral correspondent bank Single multilateral connection to all
relationships, passed through a varying number of intermediaries network members with transparent
timeframes, costs and payment data
using distributed ledger technology
Originating Originator Intermediary Beneficiary Beneficiary
Bank Bank’s Bank(s) Bank’s Bank
Correspondent Correspondent
Key Benefits:
Lack of visibility Fees
Difficult to predict costs or Fees accumulate at each • Speed, often same day
know when payments arrive step in the process, including • Payment transparency / visibility
correspondent bank and
Slow speeds • Rich data travels with payment to
third-party service fees
Average cross-border enable effective reconciliation
transaction takes 3-5 Payment data loss • Payment finality
business days Inconsistent processing between
• Efficient liquidity management
banks can result in payment
Lack of liquidity data loss and transaction errors
Due to separate accounts
90 Sources: Accenture; Juniper Research; Banking Circle; Glenbrook-Earthport, McKinsey; SWIFT data; Visa Analysis. ©2020 Visa. All rights reserved.Visa B2B Connect: Building a new network
Today 2020-2021 2022
Availability • 71 markets • +30 more markets Network scale
achieved
Network
integrators
Network size • Engaged with 100+ • Expand delivery outside of Visa B2B Connect network
banks globally • Direct: +40 banks
• Through integrators: +60 banks
Status • Begin transacting
• Expand use cases (e.g., trade)
• Grow to 1 million transactions
91 ©2020 Visa. All rights reserved.Capturing the $90T in large enterprise AR / AP payments
Will require
Card-based Cross-border Domestic AR / AP
extending
$20T $10T $90T beyond
payment
execution
• Distributed • Security, reliability • Operational efficiency
employee spend • Speed • Linking payment to data
Needs • Expense tracking • Rich data about the payment
• Fraud controls • Geographic reach • Reconciliation
• Transaction data • Payment visibility • Digitize paper
Primary • T&E, Purchasing, • Visa B2B Connect • Partnerships
Small Business,
Solutions Virtual
92 Sources: McKinsey Global Payments Report and Visa Analysis. ©2020 Visa. All rights reserved.For AR / AP domestic B2B payments, we have to address
pain points beyond payment execution
Buyer Money Movement Supplier
• Supplier onboarding • Buyer onboarding
Key Characteristics: • Procure goods / services • Payment acceptance
Before payment
strategy
Lower revenue • Receive and process invoice
1 opportunity for • Financing and payment
• Supplier financing and
payment timing
timing
payment • Issue invoice
• Determine payment type
execution and initiate payment
2 Pain points and
Payment
complexity extend • Payment execution:
check, ACH, wire, RTP,
beyond the cash
payment
• Record payment made in • Receive payment
After payment
ERP / accounting system
• Reconcile payment to
Large enterprises invoice(s), record in ERP /
accounting system
currently pay only 1bp
for payment execution
93 Sources: McKinsey Global Payments Report and Visa Analysis. ©2020 Visa. All rights reserved.You can also read


