2020 New Hampshire Occupational Employment & Wages - NH ...
←
→
Page content transcription
If your browser does not render page correctly, please read the page content below
New Hampshire Occupational
   Employment & Wages
                   2020
          based on the May 2019 survey by the
     Occupational Employment Statistics (OES) Program

              State of New Hampshire
           Christopher T. Sununu, Governor

       New Hampshire Employment Security
         George N. Copadis, Commissioner

   Economic and Labor Market Information Bureau
              Brian J. Gottlob, Director

                 September 2020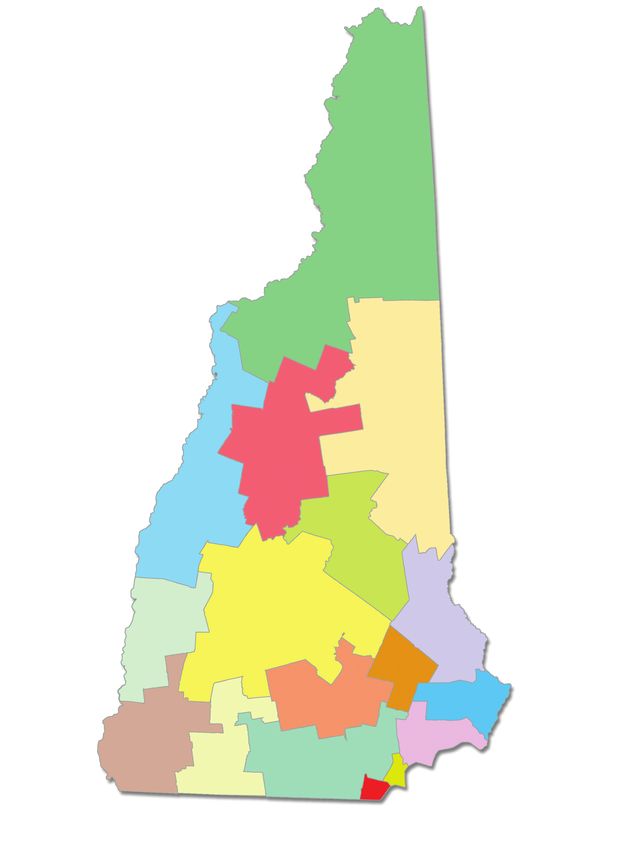
Acknowledgments
We give special thanks to the many employers whose participation made this publication possible.

In addition, we express our thanks to the U.S. Department of Labor, both on the regional level (Boston, MA), and on
the Federal level in Washington, DC, for their help in the Federal-State cooperative effort.

The following New Hampshire Employment Security staff were instrumental in producing this publication:

   Economic and Labor Market Information Bureau
		 Collecting, monitoring, and refining the data
			 Donald Kelley, Research Analyst
			 Jim Smith, Labor Market Analyst

   Printing Services Provided by NHES Reproduction Department
		 Cover design, publication layout, and web publishing
			 Jen Boughton, Print Shop, Designer

                           New Hampshire Occupational Employment & Wages - 2020
Table of Contents
   Map: Mean Average Wage by OES Wage Area  . . . . . . . . . . . . . . . . . . . . . . . . . . . . . . . . . . .  ii
   Overview . . . . . . . . . . . . . . . . . . . . . . . . . . . . . . . . . . . . . . . . . . . . . . . . . . . . . . . . . . . . . . . . . iii
   Top Occupations  . . . . . . . . . . . . . . . . . . . . . . . . . . . . . . . . . . . . . . . . . . . . . . . . . . . . . . . . . . vi
   Map of Wage Areas . . . . . . . . . . . . . . . . . . . . . . . . . . . . . . . . . . . . . . . . . . . . . . . . . . . . . . . . viii
   Substate Wage Areas . . . . . . . . . . . . . . . . . . . . . . . . . . . . . . . . . . . . . . . . . . . . . . . . . . . . . . . . ix
   How to Read the Tables . . . . . . . . . . . . . . . . . . . . . . . . . . . . . . . . . . . . . . . . . . . . . . . . . . . . . . x
   Data on our Web site  . . . . . . . . . . . . . . . . . . . . . . . . . . . . . . . . . . . . . . . . . . . . . . . . . . . . . .  xii

   Employment and Wage Tables:
     Statewide  . . . . . . . . . . . . . . . . . . . . . . . . . . . . . . . . . . . . . . . . . . . . . . . . . . . . . . . . . . . . . . 1
     Substate Wage Areas  . . . . . . . . . . . . . . . . . . . . . . . . . . . . . . . . . . . . . . . . . . . . . . . . . . . . 21
   		 Claremont-Charlestown Area  . . . . . . . . . . . . . . . . . . . . . . . . . . . . . . . . . . . . . . . . . 22
   		 Conway-Wolfeboro Area  . . . . . . . . . . . . . . . . . . . . . . . . . . . . . . . . . . . . . . . . . . . . . 27
   		 Dover-Durham Area  . . . . . . . . . . . . . . . . . . . . . . . . . . . . . . . . . . . . . . . . . . . . . . . . . 32
   		 Greater Concord Area  . . . . . . . . . . . . . . . . . . . . . . . . . . . . . . . . . . . . . . . . . . . . . .  40
   		 Hampstead-Seabrook Area  . . . . . . . . . . . . . . . . . . . . . . . . . . . . . . . . . . . . . . . . . .  49
   		 Keene Area  . . . . . . . . . . . . . . . . . . . . . . . . . . . . . . . . . . . . . . . . . . . . . . . . . . . . . . . . 54
   		 Laconia-Belmont Area  . . . . . . . . . . . . . . . . . . . . . . . . . . . . . . . . . . . . . . . . . . . . . .  60
   		 Lebanon-Hanover Area  . . . . . . . . . . . . . . . . . . . . . . . . . . . . . . . . . . . . . . . . . . . . . . 65
   		 Manchester Area  . . . . . . . . . . . . . . . . . . . . . . . . . . . . . . . . . . . . . . . . . . . . . . . . . . . . 72
   		 Nashua-Derry Area  . . . . . . . . . . . . . . . . . . . . . . . . . . . . . . . . . . . . . . . . . . . . . . . . .  83
   		 Northern NH Area  . . . . . . . . . . . . . . . . . . . . . . . . . . . . . . . . . . . . . . . . . . . . . . . . . .  94
   		 Pelham Town  . . . . . . . . . . . . . . . . . . . . . . . . . . . . . . . . . . . . . . . . . . . . . . . . . . . . . . . 99
   		 Peterborough Area  . . . . . . . . . . . . . . . . . . . . . . . . . . . . . . . . . . . . . . . . . . . . . . . . . 100
   		 Plymouth Area  . . . . . . . . . . . . . . . . . . . . . . . . . . . . . . . . . . . . . . . . . . . . . . . . . . . . . 104
   		 Portsmouth Area  . . . . . . . . . . . . . . . . . . . . . . . . . . . . . . . . . . . . . . . . . . . . . . . . . . . 107
   		 Raymond Area  . . . . . . . . . . . . . . . . . . . . . . . . . . . . . . . . . . . . . . . . . . . . . . . . . . . . . 116
   		 Salem Town . . . . . . . . . . . . . . . . . . . . . . . . . . . . . . . . . . . . . . . . . . . . . . . . . . . . . . . 118

   Glossary . . . . . . . . . . . . . . . . . . . . . . . . . . . . . . . . . . . . . . . . . . . . . . . . . . . . . . . . . . . . . . . . . 123

                              To access a complete dictionary of occupations or wage areas by county,
                           please visit our web site at: www.nhes.nh.gov/elmi/products/oes-prod.htm

                New Hampshire Employment Security, Economic and Labor Market Information Bureau
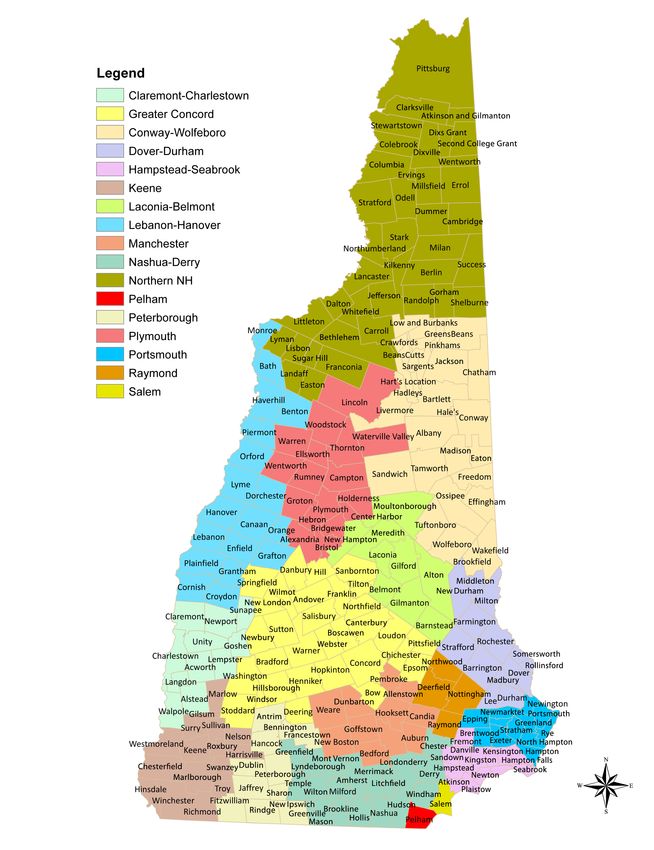
Mean (Average) Wage by OES Wage Area

                                                         Northern NH
                                                            $21.75

                                                               Conway-
                                                               Wolfeboro
                                                                $20.87
                                         Plymouth
                                           $21.15
                           Lebanon-
                           Hanover
                                                     Laconia-
                            $31.70
                                                        Belmont
                                                          $23.64

                   Claremont-         Greater Concord           Dover-
                  Charlestown              $25.01                 Durham
                     $22.05                                        $26.60
                                                           Raymond
                                                            $23.55 Portsmouth
                                                Manchester
                                                  $27.40             $29.38
                  Keene
                  $24.82                         Nashua-
                            Peterborough          Derry                      Hampstead-Seabrook
                               $23.59             $28.64                           $23.79
                                                                        Salem Town
                                                   Pelham Town             $25.17
                                                      $23.96

                 These are the Mean Hourly Wages for OES wage areas in New Hampshire.
             May 2019 wages have been aged to June 2020 using Employment Cost Index factors.

ii                New Hampshire Occupational Employment & Wages - 2020
Overview
New Hampshire workers earned, on average, $26.70 per hour in June 2020, according to the latest Occupational
Employment Statistics estimates. Employment statewide is estimated to be 660,480, which reflects May 2019 data,
the latest available for employment figures.

Occupational Groups
The Occupational Employment Statistics survey classifies workers into more than 600 specific detailed occupations
such as accountants, cashiers, computer programmers, and carpenters. These detailed occupations are grouped
into 22 major occupational groups based on job similarity.
Of the occupational groups, Management occupations had the highest mean wage, $60.96. The roughly 40,990 jobs
in this group are made up of managers of various types and levels, including chief executives, who help to boost the
mean wage.
The second highest mean wage occupational group, is Legal, with a mean wage of $48.57 and 3,360 employed.

Employment in New Hampshire by Occupational Group, May 2019
                                                                                          Estimated       Mean (Average)       % of Total
      SOC Code                                               Occupation                  Employment          Wage*            Employment
        00-0000             Total all occupations                                              660,480             $26.70            100.0%
        11-0000             Management Occupations                                              40,990             $60.96              6.2%
        13-0000             Business and Financial Operations Occupations                       31,700             $36.58              4.8%
        15-0000             Computer and Mathematical Occupations                               22,920             $46.30              3.5%
        17-0000             Architecture and Engineering Occupations                             14,150             $42.57              2.1%
        19-0000             Life, Physical, and Social Science Occupations                       4,850              $36.61             0.7%
        21-0000             Community and Social Service Occupations                             9,520             $23.76               1.4%
        23-0000             Legal Occupations                                                    3,360              $48.57             0.5%
        25-0000             Educational Instruction and Library Occupations                     42,960              $25.73             6.5%
        27-0000             Arts, Design, Entertainment, Sports, and Media Occupations            7,180             $25.05             3.0%
        29-0000             Healthcare Practitioners and Technical Occupations                  40,290              $43.89              6.1%
        31-0000             Healthcare Support Occupations                                      24,320              $16.89             3.7%
        33-0000             Protective Service Occupations                                       11,980             $25.52              1.8%
        35-0000             Food Preparation and Serving Related Occupations                     58,310             $13.45             8.8%
        37-0000             Building and Grounds Cleaning and Maintenance Occupations            21,860              $16.11            3.3%
        39-0000             Personal Care and Service Occupations                                14,700             $15.69             2.2%
        41-0000             Sales and Related Occupations                                       76,470              $21.56             11.6%
        43-0000             Office and Administrative Support Occupations                       93,780              $20.67             14.2%
        45-0000             Farming, Fishing, and Forestry Occupations                             810              $17.94              0.1%
        47-0000             Construction and Extraction Occupations                             22,600              $24.68             3.4%
        49-0000             Installation, Maintenance, and Repair Occupations                   24,500              $25.96             3.7%
        51-0000             Production Occupations                                              44,000              $20.91             6.7%
        53-0000             Transportation and Material Moving Occupations                      49,270               $17.79             7.5%

* Wages aged to June 2020

                            New Hampshire Employment Security, Economic and Labor Market Information Bureau                                    iii
Food Preparation and Serving Related occupations had the lowest mean wage, $13.45. They were the third largest
 group, claiming 8.8 percent of total employment or 58,310 employees. This occupational group includes jobs that
 are traditionally tipped, such as waiters, waitresses, and bartenders. Employers are asked to include these tips in
 the wages that they report.
 Office and Administrative Support occupations once again made up the highest share of New Hampshire jobs,
 14.2 percent. These 93,780 jobs paid, on average, $20.16 per hour. This was roughly $6.00 below the statewide
 average for all occupations. Jobs in this occupational group include bookkeeping and accounting clerks, customer
 service representatives, shipping, receiving and inventory clerks, and secretaries.
 Sales and Related occupations, with 76,470 jobs, claimed 11.6 percent of the total jobs in the state, and had
 the second highest employment. This group includes jobs such as retail salespersons, cashiers, and sales
 representatives. On average, employees in these jobs made $21.56 per hour in 2020.

 Background
 The Occupational Employment Statistics (OES) program is based on a semiannual survey conducted by state
 employment security agencies in all 50 states. The New Hampshire survey is conducted by New Hampshire
 Employment Security’s Economic and Labor Market Information Bureau (ELMIB), in cooperation with the U.S.
 Bureau of Labor Statistics. The survey collects data on occupational employment and wage rates of workers in all
 nonfarm industries.
 Employers, job seekers, workforce developers, government planners, and economic developers are some
 examples of users of occupational employment and wage information. The OES program survey data is also
 used for prevailing wage determinations for Foreign Labor Certification, and are the foundation of occupational
 projections in New Hampshire.
 This publication provides employment and wage estimates by occupation. In addition to statewide numbers,
 it publishes estimates for seventeen substate areas, which are based on New Hampshire’s labor market areas.
 In New England, labor market areas are groups of adjacent cities and towns that are determined to have a high
 degree of social and economic integration, based on Census 2010 commuting data.
 The U.S. Bureau of Labor Statistics (BLS) publishes OES estimates for the nation as a whole, each state,
 metropolitan, and nonmetropolitan areas. The only strictly New Hampshire data that BLS publishes is for
 the entire state and for the Manchester Metropolitan New England City or Town Area (NECTA). Except for
 Manchester, the other BLS metropolitan areas include parts of Massachusetts or Maine. To better reflect the
 wages paid in New Hampshire, New Hampshire Employment Security publishes only wage areas from the
 New Hampshire portions of the labor market areas.
 Some labor market areas such as the Manchester Metro NECTA and the Peterborough and Plymouth Small Labor
 Market Areas (LMAs) are wage areas in their own right. In most cases, however, we have combined labor market
 areas in order to make it possible to publish information on more occupations (Estimates must meet certain
 reliability criteria to be deemed publishable). For instance, combining the New Hampshire portions of the
 three northernmost labor market areas creates a “Northern New Hampshire” wage area. This way, many more
 occupations can be published than would be possible for each area individually.

iv                           New Hampshire Occupational Employment & Wages - 2020

For more detailed information on New Hampshire OES wage areas and the labor market areas on which they are
based, please see the Glossary at the end of this publication.
The OES survey is accomplished with the cooperation of New Hampshire employers who provide occupational
data. Every six months, these requests for information are mailed to more than 1,800 employers or employing
units. The OES survey sample is stratified by area, industry, and size class. Standard Occupational Classification
(SOC) codes are used in the surveys to define occupations uniformly and to organize occupational data logically.
The OES survey is designed to produce estimates by combining six panels of data collected over a 3-year period.
Wage estimates for the survey are straight-time, gross pay, exclusive of premium pay. Base rate; cost-of-living
allowance; guaranteed pay; hazardous-duty pay; incentive pay, including commissions and production bonuses;
and tips are included. Excluded are overtime pay, severance pay, shift differentials, nonproduction bonuses,
employer cost for supplementary benefits, and tuition reimbursements.
In the most recent panel, mailings of surveys began in May 2019, with data collection continuing through
December 2019. This OES Survey recorded employment and wage data for employees performing 600+
diversified occupations.
For this publication, May 2019 occupational wages were updated to June 2020, using Employment Cost Index
(ECI) factors. These wage data are not official Bureau of Labor Statistics (BLS) data series and have not been
validated by BLS. The Employment Cost Index is a quarterly measure of changes in labor costs. Updating
occupational wages gives our data users a better idea of current wage estimates. For more information, visit the
BLS web site at www.bls.gov/ect.
OES estimates are based on the 2017 North American Industry Classification System (NAICS). For more
information about NAICS, see the BLS website at www.bls.gov/bls/naics.htm.

                 New Hampshire Employment Security, Economic and Labor Market Information Bureau                     v
Top Occupations
 Top 10 Occupations by Mean Wage
                                                                             Mean
                                                            Estimated    (Average)
      SOC Code    Occupation                             Employment *        Wage
       29-1215    Family Medicine Physicians                      800      $128.87
       29-1228    Physicians, All Other and                      1,220     $126.22
                  Ophthalmologists, Except Pediatric
       29-1223    Psychiatrists                                   120      $125.85
       29-1218    Obstetricians and Gynecologists                 100      $124.02
       29-1216    General Internal Medicine Physicians            150       $118.38
       29-1221    Pediatricians, General                          250       $116.14
       29-1021    Dentists, General                               450       $105.81
       29-1151    Nurse Anesthetists                               170      $96.18
       29-1081    Podiatrists                                      30       $90.00     Since the 2018 revision of the Standard Occupational
        11-1011   Chief Executives                                680       $83.38     Classification Manual, many titles have changed. For
                                                                                        example, Family and General Practitioners are now
     * May 2019                                                                                     Family Medicine Physicians.

 Top 10 Occupations by Estimated Employment
                                                                             Mean
                                                            Estimated    (Average)
      SOC Code    Occupation                             Employment *        Wage
       41-2031    Retail Salespersons                          24,400       $14.90
       41-2011    Cashiers                                      21,500       $11.85
       43-9061    Office Clerks, General                       16,050        $19.81
       35-3023    Fast Food and Counter Workers                14,350         $11.17
       53-7065    Stockers and Order Fillers                   14,340       $14.45
       29-1141    Registered Nurses                             14,320      $36.26
       11-1021    General and Operations Managers               13,380      $63.55
       35-3031    Waiters and Waitresses                       12,390       $13.30
       43-4051    Customer Service Representatives              11,660       $19.87
       43-6014    Secretaries and Administrative               10,690        $19.07       Stock Clerks and Order Fillers, once in Office
                  Assistants, Except Legal, Medical,                                     and Administrative Support Occupations, is now
                  and Executive                                                             in the Transportation and Material Moving
                                                                                                        Occupations group.
     * May 2019

vi                                         New Hampshire Occupational Employment & Wages - 2020
Top 10 Occupations With Nonstandard Work Week —
Mean Annual Wage
                                                                        Mean
                                                       Estimated    (Average)
 SOC Code    Occupation                             Employment *        Wage
  25-1063    Economics Teachers, Postsecondary                80      $171,617
  25-1032    Engineering Teachers, Postsecondary             140     $138,655
  53-2011    Airline Pilots, Copilots, and Flight             30      $129,715
             Engineers
  25-1011    Business Teachers, Postsecondary                550     $124,447
  25-1042    Biological Science Teachers,                    310      $122,231
             Postsecondary
  25-1062    Area, Ethnic, and Cultural Studies               50      $118,608
             Teachers, Postsecondary
  25-1021    Computer Science Teachers,                      130      $112,167
             Postsecondary                                                           Certain occupations, such as teachers and airline
                                                                                  pilots, have a nonstandard workweek and are not paid
  25-1065    Political Science Teachers,                     100      $111,461
             Postsecondary
                                                                                   by the hour. For these occupations, annual salaries
                                                                                            are displayed instead of hourly wage.
  25-1071    Health Specialties Teachers,                    520     $108,372
             Postsecondary
  25-1052    Chemistry Teachers, Postsecondary                70     $104,923

* May 2019

Bottom 10 Occupations by Mean Wage
                                                                        Mean
                                                       Estimated    (Average)
 SOC Code    Occupation                             Employment *        Wage
  51-6021    Pressers, Textile, Garment, and                 140        $12.02
             Related Materials
  39-3011    Gambling Dealers                                300       $12.00
  41-2011    Cashiers                                      21,500       $11.85
  35-9021    Dishwashers                                    2,610       $11.55
  35-3023    Fast Food and Counter Workers                14,350         $11.17
  39-3091    Amusement and Recreation                       1,550       $11.08
             Attendants
  35-9011    Dining Room and Cafeteria                      1,810       $10.91
             Attendants and Bartender Helpers
                                                                                  Due to the 2018 Standard Occupational Classification
  39-3031    Ushers, Lobby Attendants, and Ticket            200        $10.01
                                                                                    Manual revision, Combined Food Preparation and
             Takers
                                                                                  Serving Workers, Including Fast Food, are now known
  51-3099    Food Processing Workers, All Other              140       $10.00              as Fast Food and Counter Workers.
  39-3093    Locker Room, Coatroom, and                       NP        $9.09
             Dressing Room Attendants

* May 2019

                        New Hampshire Employment Security, Economic and Labor Market Information Bureau                              vii
Map of Wage Areas

viii       New Hampshire Occupational Employment & Wages - 2020
Substate Wage Areas
Claremont-Charlestown          Greater Concord       Surry                  Litchfield                  Fitzwilliam
Acworth                        Andover               Swanzey                Londonderry                 Francestown
Alstead                        Boscawen              Troy                   Lyndeborough                Hancock
Charles                        Bow                   Westmoreland           Mason                       Jaffrey
Claremont                      Bradford              Winchester             Merrimack                   New Ipswich
Goshen                         Canterbury                                   Milford                     Peterborough
Langdon                        Chichester            Laconia-Belmont        Mont Vernon                 Rindge
Lempster                       Concord               Alton                  Nashua                      Sharon
Newport                        Danbury               Barnstead              Temple                      Francestown
Sunapee                        Deering               Belmont                Wilton                      Hancock
Unity                          Epsom                 Center Harbor          Windham
Walpole                        Franklin              Gilford                                            Plymouth
                               Henniker              Gilmanton              Northern NH                 Alexandria
Conway-Wolfeboro               Hill                  Laconia                Atkinson & Gilmanton A.G.   Ashland
Albany                         Hillsborough          Meredith               Berlin                      Bridgewater
Bartlett                       Hopkinton             Moultonborough         Bethlehem                   Bristol
Bean’s Grant                   Loudon                New Hampton            Cambridge                   Campton
Bean’s Purchase                New London                                   Carroll                     Ellsworth
Brookfield                     Newbury               Lebanon-Hanover        Clarksville                 Groton
Chandler’s Purchase            Northfield            Bath                   Colebrook                   Hebron
Chatham                        Pittsfield            Benton                 Columbia                    Holderness
Conway                         Salisbury             Canaan                 Dalton                      Lincoln
Crawford’s Purchase            Sanbornton            Cornish                Dix’s Grant                 Plymouth
Cutt’s Grant                   Springfield           Croydon                Dixville                    Rumney
Eaton                          Stoddard              Dorchester             Dummer                      Thornton
Effingham                      Sutton                Enfield                Easton                      Warren
Freedom                        Tilton                Grafton                Errol                       Waterville Valley
Green’s Grant                  Warner                Grantham               Erving’s Location           Wentworth
Hadley’s Purchase              Washington            Hanover                Franconia                   Woodstock
Hale’s Location                Webster               Haverhill              Gorham
Hart’s Location                Wilmot                Lebanon                Jefferson                   Portsmouth
Jackson                        Windsor               Lyme                   Kilkenny                    Brentwood
Livermore                                            Monroe                 Lancaster                   Epping
Low and Burbank’s Grant        Hampstead-Seabrook    Orange                 Landaff                     Exeter
Madison                        Atkinson              Orford                 Lisbon                      Greenland
Martin’s Location              Danville              Piermont               Littleton                   Hampton
Ossipee                        East Kingston         Plainfield             Lyman                       New Castle
Pinkham’s Grant                Fremont                                      Milan                       Newfields
Sandwich                       Hampstead             Manchester             Millsfield                  Newington
Sargent’s Purchase             Hampton Falls         Allenstown             Northumberland              Newmarket
Tamworth                       Kensington            Auburn                 Odell                       North Hampton
Thompson & Meserve’s Pur       Kingston              Bedford                Pittsburg                   Portsmouth
Tuftonboro                     Newton                Candia                 Randolph                    Rye
Wakefield                      Plaistow              Dunbarton              Second College Grant        Stratham
Wolfeboro                      Sandown               Goffstown              Shelburne
                               Seabrook              Hooksett               Stark                       Raymond
Dover-Durham                   South Hampton         Manchester             Stewartstown                Deerfield
Barrington                                           New Boston             Stratford                   Northwood
Dover                          Keene                 Pembroke               Success                     Nottingham
Durham                         Chesterfield          Weare                  Sugar Hill                  Raymond
Farmington                     Gilsum                                       Wentworth Location
Lee                            Harrisville           Nashua-Derry           Whitefield                  Salem
Madbury                        Hinsdale              Amherst                                            Salem
Middleton                      Keene                 Brookline              Pelham
Milton                         Marlborough           Chester                Pelham
New Durham                     Marlow                Derry
Rochester                      Nelson                Greenfield             Peterborough
Rollinsford                    Richmond              Greenville             Antrim
Somersworth                    Roxbury               Hollis                 Bennington
Strafford                      Sullivan              Hudson                 Dublin

                        New Hampshire Employment Security, Economic and Labor Market Information Bureau                     ix
How To Read the Tables
For each occupation in the tables of this publication, there is a corresponding SOC code and an estimate of
employment within that occupation. The remaining data fields are Entry Level Wage, Mean (Average) Wage,
Median Wage, and Experienced Wage.
1 SOC (Standard Occupational Classification) Code is a six-digit code designed to define occupations
uniformly and to organize occupational data logically.
2 Estimated Employment is an approximation of the number of people employed in each area,
occupational group, or specific occupation. Estimates for detailed occupations may not sum to the
totals because the totals may include occupations not shown. Estimates do not include self-employed
workers. If the estimated employment is not publishable, an NP will appear.
3 Entry Level Wage is the mean of the lower third of the population.
4 Mean (Average) Wage is the average hourly wage. If an hourly wage is not available (for occupations
that typically have a nonstandard work week) the annual salary is displayed.
5 Median Wage is the 50th percentile of the distribution of wages. For each median wage, 50 percent of
the workers in an occupation earn wages below, and 50 percent earn wages above median wage.
6 Experienced Wage is the mean of the upper two-thirds of the population.
Because of confidentiality or lack of data, not all occupations appear in all areas.
# Indicates a wage that is not publishable.
NP Indicates an estimated employment that is not publishable.
NOTE: Wages aged to June 2020
x New Hampshire Occupational Employment & Wages - 2020Sample Table
1 2 3 4 5 6
JUNE 2020
STATEWIDE May 2019
Estimated Entry Level
Mean
(Average) Median Experienced
Occupational Employment & Wages SOC Code Employment Wage * Wage * Wage * Wage *
Total all occupations 00-0000 660,480 $12.14 $26.70 $20.52 $33.97
Management Occupations 11-0000 40,990 $31.39 $60.96 $52.94 $75.75
Chief Executives 11-1011 680 $42.98 $83.38 $68.31 $103.57
General and Operations Managers 11-1021 13,380 $29.74 $63.55 $51.18 $80.45
Legislators 11-1031 210 $17,782 $20,366 $18,384 $21,658
Advertising and Promotions Managers 11-2011 50 $32.46 $44.86 $40.00 $51.07
Marketing Managers 11-2021 1,220 $44.42 $71.09 $63.51 $84.42
Sales Managers 11-2022 1,660 $42.06 $76.66 $72.61 $93.95
Public Relations and Fundraising Managers 11-2030 670 $34.09 $58.78 $54.81 $71.12
Administrative Services and Facilities Managers 11-3010 1,050 $34.27 $53.10 $49.03 $62.53
Computer and Information Systems Managers 11-3021 2,730 $48.12 $73.29 $69.17 $85.89
Financial Managers 11-3031 3,890 $37.19 $63.67 $57.80 $76.91
Industrial Production Managers 11-3051 1,190 $43.98 $67.54 $63.75 $79.32
Purchasing Managers 11-3061 520 $42.67 $63.81 $60.03 $74.38
Transportation, Storage, and Distribution Managers 11-3071 590 $36.34 $56.11 $52.12 $66.01
Compensation and Benefits Managers 11-3111 90 $42.39 $61.15 $57.48 $70.52
Human Resources Managers 11-3121 700 $40.57 $65.17 $57.41 $77.47
Training and Development Managers 11-3131 240 $43.18 $62.43 $59.48 $72.05
Construction Managers 11-9021 1,260 $31.39 $47.89 $43.50 $56.13
Education and Childcare Administrators, Preschool and 11-9031 430 $16.92 $24.12 $22.69 $27.72
Daycare
Education Administrators, Kindergarten through Secondary 11-9032 1,380 $71,845 $94,372 $93,893 $105,636
Education Administrators, Postsecondary 11-9033 NP $30.18 $51.42 $42.05 $62.03
Education Administrators, All Other 11-9039 70 $21.65 $32.25 $27.05 $37.56
Architectural and Engineering Managers 11-9041 1,550 $51.15 $77.81 $75.19 $91.14
Food Service Managers 11-9051 1,130 $23.63 $32.45 $31.01 $36.86
Lodging Managers 11-9081 210 $21.48 $32.53 $29.27 $38.05
Medical and Health Services Managers 11-9111 2,170 $35.84 $58.93 $50.44 $70.46
Natural Sciences Managers 11-9121 230 # # # #
Postmasters and Mail Superintendents 11-9131 170 $31.29 $36.45 $35.10 $39.01
Property, Real Estate, and Community Association Managers 11-9141 670 $20.75 $32.86 $29.96 $38.91
Social and Community Service Managers 11-9151 830 $23.48 $34.47 $31.72 $39.96
Emergency Management Directors 11-9161 70 $19.84 $35.74 $28.19 $43.69
Funeral Home Managers 11-9171 30 $25.15 $45.49 $34.91 $55.67
Personal Service Managers, All Other; Entertainment and 11-9198 860 $40.32 $66.22 $62.55 $79.17
Recreation Managers, Except Gambling; and Managers, All
Other
Business and Financial Operations Occupations 13-0000 31,700 $22.45 $36.58 $33.21 $43.64
Buyers and Purchasing Agents 13-1020 2,430 $21.95 $33.56 $31.35 $39.37
Claims Adjusters, Examiners, and Investigators 13-1031 1,190 $22.29 $34.68 $33.46 $40.87
Insurance Appraisers, Auto Damage 13-1032 40 $34.07 $39.04 $39.25 $41.52
* Some occupations, such as teachers, have a nonstandard workweek and are not paid by the hour. For these occupations, annual salaries are displayed instead of hourly wage. May 2019 occupational
wages were updated to June 2020 using Employment Cost Index (ECI) factors.
2 New Hampshire Occupational Employment & Wages - 2020
New Hampshire Employment Security, Economic and Labor Market Information Bureau xiData on Our Web Site
This publication can be accessed in its entirety or in sections from the New Hampshire Employment Security web
site www.nhes.nh.gov/elmi/products/oes-prod.htm.
The files are in PDF format and can be viewed in Adobe Acrobat.
In addition to these PDF files, occupational tables are provided in HTML format. The same statewide and 17 substate
areas from the print version are represented, as well as New Hampshire’s 10 counties. (County information is not
included in the print version.)
These easy-to-access HTML tables are interactive. Once the area and job title are found, simply click on the title to
bring up an Area Profile for that job.
Area Profiles contain useful information such as:
◆ Job definitions (no need to consult a dictionary)
◆ Highest Employment and Best Pay for the top five areas in the state
◆ Colorful state maps with area breakdown, comparing the mean wage among areas
◆ Graphs that illustrate the spread of data around the median wage
◆ A summary of key employment and wage data for each occupation.
From Area Profiles, drop-down menus are available to locate a new occupation for that area, or a new area for the
occupation.
The OES program has developed a brief, informative slideshow
tutorial on our web site to enhance your use and understanding of
the occupational and wage data presented. You may view this tutorial
under the heading "How to Use Wage Data" at
www.nhes.nh.gov/elmi/products/oes-prod.htm
xii New Hampshire Occupational Employment & Wages - 2020You can also read