2020 Point in Time Report - Shasta County
←
→
Page content transcription
If your browser does not render page correctly, please read the page content below
2020 Point in Time Report
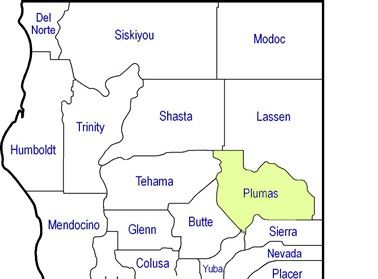
Table of Contents
Background .................................................................................................................................................................2
Federal Definitions of Homelessness .........................................................................................................................4
Why Do We Count In January? ...................................................................................................................................4
2020 Point in Time Summary* ...................................................................................................................................5
5 Year Summary..........................................................................................................................................................6
Sheltered Data Summary ............................................................................................................................................7
Unsheltered Survey Results .......................................................................................................................................8
Unsheltered Demographics ........................................................................................................................................9
Unsheltered Demographics ..................................................................................................................................... 10
Unsheltered Health Survey ...................................................................................................................................... 11
Primary Reason for Homelessness .......................................................................................................................... 12
Unsheltered Sleeping Locations .............................................................................................................................. 13
Unsheltered Residency ............................................................................................................................................ 14
Unsheltered Reoccurrence of Homelessness .......................................................................................................... 15
Chronic Homelessness Results ................................................................................................................................ 16
Veterans .................................................................................................................................................................. 17
Incarceration and Homelessness ............................................................................................................................. 18
County Profiles on Homelessness............................................................................................................................ 19
Del Norte County ..................................................................................................................................................... 20
Modoc County ......................................................................................................................................................... 22
Plumas County ......................................................................................................................................................... 24
Shasta County .......................................................................................................................................................... 26
Sierra County ........................................................................................................................................................... 28
Siskiyou County........................................................................................................................................................ 30
Methodology ........................................................................................................................................................... 32
Data Sources ............................................................................................................................................................ 36
Acknowledgements ................................................................................................................................................. 36

                                                                                                                                                           1|Page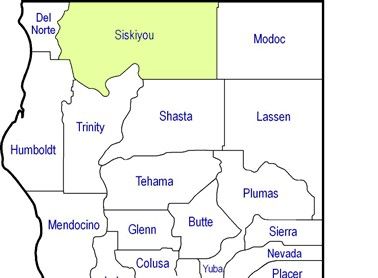
Background

The NorCal Continuum of Care (NorCal CoC) is a seven-county homeless consortium governed by an Executive
Board. The NorCal CoC is charged by the U.S. Department of Housing and Urban Development (HUD) to conduct
a Point-In-Time (PIT) Count each year. This PIT Count develops important, person-specific data which helps
communities to prioritize the most vulnerable and chronically homeless persons for rapid rehousing, transitional
housing, or permanent housing resources.

The PIT helps HUD and local Continuum of Cares’ (CoCs) to understand the number and characteristics of
homeless individuals sleeping in shelters or on the street or other places not meant for human habitation. This
one-night, unduplicated count of sheltered and unsheltered homeless people within each CoC across the nation
is reported using a standardized chart with various populations and subpopulations of homeless individuals and
families. HUD requires the use of reliable methods to conduct the count and reserves the right to ask
communities to verify their data. For more information on PIT Counts, please visit:

https://www.hudexchange.info/news/2020-pit-count-announcement-and-additional-pit-count-resources/

The annual PIT Count of the homeless provides a statewide snapshot of homeless households in our
communities; where they find shelter, what their needs are, and what factors contribute to making them
homeless. The 2020 PIT Count reveals important demographics and other information relating to families and
individuals who were homeless on the night of January 27, 2020. The count is planned, coordinated, and carried
out locally by the joint effort of government agencies, community-based organizations, and numerous local
volunteers. The information gathered enables each community to better allocate housing resources and services
in order to prevent and end homelessness. The PIT Count is accompanied by the Housing Inventory Count (HIC)
which details the number of beds available to meet the immediate housing needs of those without homes.

The data collected also serves as a measure for how the community is resolving homelessness and provides the
federal and state government information to determine funding needs and eligibility. The PIT Count produces a
standard set of data, comparable and available nationwide, which HUD provides to Congress in its Longitudinal
Systems Analysis (LSA). Information regarding the LSA can be accessed here:

                          https://www.hudexchange.info/homelessness-assistance/lsa/

          Nationwide PIT and HIC Count Data is available to the public on the HUD Exchange website.
     https://www.hudexchange.info/programs/coc/coc-homeless-populations-and-subpopulations-reports/

                                                                                                     2|Page
The NorCal CoC Lead Agency, Shasta County Community Action Agency, prepared this report to provide
comprehensive data from the NorCal CoC region’s 2020 PIT Count. The NorCal CoC region encompasses the
counties of Del Norte, Lassen, Modoc, Plumas, Shasta, Sierra and Siskiyou including all cities in those counties.

This report provides an in-depth look at the region’s homelessness, including demographic information and
county profiles which contain each county’s snapshot of homelessness.

The goal of this report is to educate the community, elected officials, and community stakeholders on the NorCal
CoC’s homeless population in hopes of improving community awareness and to provide data for local decision-
makers. Any questions regarding this report can be directed to:

                                     Shasta County Community Action Agency
                                           1450 Court Street, Suite 108
                                               Redding, CA 96001

                                           Email: hmis@co.shasta.ca.us

                           Information regarding the NorCal CoC can be accessed here:

                                                www.NorCalCoC.org

                                                                                                        3|Page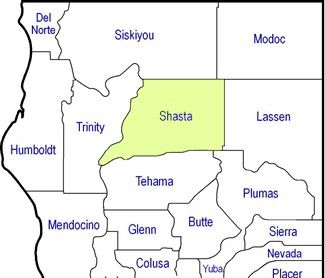
Federal Definitions of Homelessness

HUD’s definition of homelessness is utilized each year for the annual PIT Count. According to HUD, a
person/household is considered homeless only when they reside in one of the places described below at the time
of the PIT Count.

An unsheltered homeless person/household resides in: A place not meant for human habitation, such as cars,
parks, sidewalks, abandoned buildings, or on the street.

A sheltered homeless person/household resides in: A supervised publicly or privately operated shelter designated
to provide temporary living arrangement (including congregate shelters, transitional housing, and hotels and
motels paid for by charitable organizations or by federal, state, or local government programs).

Why Do We Count In January?

HUD requires all CoCs nationwide to complete an annual PIT Count focusing on one night during the last 10 days
of January.

Counting and interviewing people sleeping in unsheltered locations during the winter months can provide a more
precise count of people who are unable or unwilling to access emergency shelter or other crisis response
assistance in fair weather months. By conducting the count in January, it allows CoCs sufficient time to compile
data and report the information to HUD via the Homelessness Data Exchange (HDX) in advance of the annual CoC
program competition. This timeframe also provides consistency with the data HUD receives from CoCs
nationwide.

Conducting the count on a night when the shelters are most full provides a more accurate count. It is generally
easier to count individuals in a shelter than to locate them on the street or in an environment not designed as a
regular sleeping accommodation for people. HUD recognizes that a January count is not intended to represent
the extent to which people may be unsheltered at other times during the year or over more than a one-night
period.

Note: To ensure the safety and comfort of those who participated, respondents were not required to complete all
survey questions. Missing values are listed as “did not respond” or values were extrapolated per HUD guidelines.

                                                                                                       4|Page
2020 Point in Time Summary*
           Total Count
                                                                                      Gender
             1,529
                                       Gender Non-Conforming
                                                                      5

         Unsheltered                              Transgender
                                                                      6
           1,023
                                                       Female
                                                                                                                   566

                                                          Male
                                                                                                                                          952
          Sheltered
                                                                  0              200           400                600      800           1000
            506
                                                                                                                  Race
                                                                          Multiple Races         123
                                            Native Hawaiian or Other Pacific Islander                     16
                                                   American Indian or Alaska Native                 185
                                                                                  Asian                14
                                                          Black or African-American            52
                                                                                  White                                          1,139
                                                                                           0                500          1000            1500
Primary Reasons for Homelessness

Alcohol Abuse                  1.0%                                                        Ethnicity
Child/Elder Abuse or Neglect   1.1%
                                                           Hispanic/Latino
Domestic Violence              5.1%
                                                Non-Hispanic/Non-Latino                    175
Drug Abuse                     5.4%
Eviction                       6.5%                                                                                                      1,354
Family Break Up                9.9%                                               0     200 400 600 800 1000 1200 1400 1600
Fire                           1.1%
Gender Identification          0.1%
Illness                        0.5%
Incarceration                  5.3%
                                                                                                    Household Types
Lack of Job Skills             0.8%
Loss of Employment             7.5%
                                                                                            Households                                   Individuals
                                                  Households w/ at least 1 adult & 1 child     103                                          295
Medical Issues                 4.4%
                                                  Households without children                 1,054                                        1,230
Mental Health                  9.0%
                                                  Households with only children                 4                                             4
Natural Disaster               1.0%
                                                                     Additional Household Types**
Other                          8.4%
                                                  Veteran Households without children          129                                           131
Overcrowded                    0.6%               Unaccompanied Youth Households                72                                           104
Refused                        1.7%
Relocation                      3.5%
Stranded Traveler               1.3%        *The NorCal 2020 Point in Time Summary’s missing values were extrapolated per
                                            HUD guidelines.
Sudden Loss of Income           9.0%        **The “Additional Household Types” are a subset of “Household Types.
Did Not Respond                16.8%        Calculated Percentages have been rounded +/-.5%.

                                                                                                                            5|Page
5 Year Summary

NorCal CoC wide, 1,529 homeless individuals were counted between the evening of January 27th and the entire
day of January 28, 2020. Due to the demographics of the NorCal CoC, surveys were completed up to 7 days after
the count to include service locations.

                                                               Total PIT Count
 1600

 1400
                                                                                                 1,529
 1200
                                                                                    1,349
 1000              1,272
                                                                       1,149
   800                                           934
   600

   400

   200

     0
                    2016                        2017                    2018        2019           2020

                                                             Total PIT Count
                                                         Unsheltered vs Sheltered
 1600

 1400
                                                                                                    506
 1200
                     312                                                             543
 1000
                                                                        459
   800
                                                 530
   600
                     960                                                                           1,023
   400                                                                               806
                                                                        690
   200                                           404

     0
                    2016                        2017                    2018        2019           2020
                                                         Unsheltered    Sheltered

Note: Calculated Percentages have been rounded +/-.5%.

                                                                                                  6|Page
Sheltered Data Summary
Data is collected on individuals who are staying in shelters and transitional housing units in order to gain an
accurate count of persons temporarily housed throughout the NorCal CoC region.
This effort resulted in 506 persons in the sheltered count.
This sheltered data is vital to gaining an accurate overall count of the homeless population and to understand
where homeless people are receiving shelter. As per HUD guidelines, the number reported does not include
homeless individuals in hospitals, residential rehabilitation facilities, jails or those sleeping on a friend or
family’s couch.
Throughout the region, shelters and facilities report the number of homeless individuals and families who
occupied their facilities on the same day of the unsheltered enumeration effort for the night of January 27, 2020.
This helps ensure individuals are not duplicated in the count.
HUD requires communities to report their bed inventory and utilization of those beds on the night of the count.
The data is taken from the organizations in the NorCal CoC region that provide shelter beds. In 2020, there was a
total of 625 beds available, with a total number of 506 beds being used on the day of the count. This is an 81%
percent utilization rate.
Utilization
Year Emergency Shelter Transitional Housing
2016 185 127
2017 264 266
2018 248 211
2019 338 205
2020 358 148
Emergency shelter means any facility, the primary purpose of which is to provide a temporary shelter for the
homeless in general or for specific populations of the homeless and which does not require occupants to sign
leases or occupancy agreements.
Transitional Housing means a project designed to provide housing and appropriate supportive services to
homeless persons to facilitate movement to independent living. The housing is short-term, typically less than 24
months. In addition to providing safe housing for those in need, other services are available to help participants
become self-sufficient.
Note: Calculated Percentages have been rounded +/-.5%.
7|PageUnsheltered Survey Results
The following section of this report provides an overview of the findings generated from the 2020 NorCal CoC
Unsheltered Survey Count. Surveys were administered to homeless individuals January 28th through February
4, 2020.
This effort resulted in 1,023 persons in the unsheltered count.
The PIT Count does not capture what homelessness looks like for every person or family. Many cycle between
literal homelessness and “at-risk” of literal homelessness, such as those who are staying with friends or family,
individuals that pay to stay in a hotel or are under the threat of an eviction. Per HUD guidelines, these individuals
are not included in the PIT Count. Also, a snap-shot of a single night’s count does not cover an entire season or
year to show the full scope of homelessness in any given community.
Note: To ensure the safety and comfort of those who participated, respondents were not required to complete all
survey questions. All responses were self-reported by those that agreed to respond. Missing values are listed as
“did not respond” or values were extrapolated per HUD guidelines.
8|PageUnsheltered Demographics
Age Did Not Respond
% of Total 63 and over
Unsheltered Persons
Under 18 5.2% 53
25-62
18-24 9.3% 95
25-62 74.4% 761 18-24
63 and over 6% 61
Did Not Respond 5.2% 53 Under 18
0 200 400 600 800
Gender
Did Not
% of Total
Respond
Unsheltered Persons
Gender Non-
Conforming Male 62.4% 638
Transgender
Female 35.0% 358
Female
Male Transgender .5% 5
Gender Non-Conforming .5% 5
0 200 400 600 800
Did Not Respond 1.7% 17
Note: Calculated Percentages have been rounded +/-.5%.
9|PageUnsheltered Demographics
Race and Ethnicity
% of Unsheltered Total Persons
White 71.7% 733
Black or African-American 3.1% 32
American Indian/Alaskan Native 10.8% 110
Native Hawaiian/Other Pacific Islander 1.4% 14
Asian 1.0% 10
Multiple Races 7.3% 75
Did Not Respond 4.8% 49
% of Unsheltered Total Persons
Hispanic 9.7% 99
Non-Hispanic 84.8% 867
Did Not Respond 5.6% 57
Race Ethnicity
Did Not Respond
Did Not Respond
Multiple Races
Asian Non-Hispanic
Native Hawaiian/Other
Pacific Islander
Hispanic
American Indian/Alaskan
Native
0 500 1000
Black or African-American
White
0 200 400 600 800
Note: Calculated Percentages have been rounded +/-.5%.
10 | P a g eUnsheltered Health Survey
One of the greatest challenges facing unsheltered homeless individuals is to avoid illness. Every year the survey
seeks to estimate the prevalence of certain health characteristics and disabilities among those experiencing
homelessness. A part of the survey process was to ask respondents health questions.
Note: To ensure the safety and comfort of those who participated, respondents were not required to complete all survey
questions. This survey question allowed for each respondent to have multiple responses.
Health
34.4%
27.1%
15.8%
14.8%
13.8%
8.9%
3%
1.0%
Physical Developmental Chronic Living with Mental Domestic Substance Alcoholism
Disability Disability Health HIV/AIDS Illness Violence Abuse
Condition
163 31 141 10 352 91 277 151
Note: Calculated Percentages have been rounded +/-.5%.
11 | P a g ePrimary Reason for Homelessness
The primary reason for homelessness was added this year to the 2020 Point in Time survey. This question was
added to provide a better understanding of the causes of homelessness.
The top 3 reasons for homelessness are: Family Break Up, Mental Health Issues and Sudden Loss of Income.
Primary Reason for Homelessness
Alcohol Abuse 11
Child/Elder Abuse or Neglect 11
Domestic Violence 35
Drug Abuse 45
Eviction 68
Family Break Up 113
Fire 10
Gender Identification 2
Illness 4
Incarceration 73
Lack of Job Skills 6
Loss of Employment 97
Medial Issues 55
Mental Health 112
Natural Disaster 11
Overcrowded 8
Relocation 30
Stranded Traveler 15
Sudden Loss of Income 116
Other 92
No Response 109
0 20 40 60 80 100 120 140
12 | P a g eUnsheltered Sleeping Locations
In an effort to better understand the sleeping locations of the unsheltered population, respondents were asked to identify
where they slept the night of January 27, 2020.
% of Total Persons
Unsheltered
Street/Sidewalk 16.4% 168
Vehicle (Car, Van, Truck) 19.7% 202
Outdoor Encampment 33.7% 345
Park 2.7% 28
Under Bridge/ Overpass 5.9% 60
Bus Stop, Train Station, Airport 0.5% 5
Abandoned Building 10.7% 109
Other 1.6% 16
Did Not Respond 8.8% 90 Note: Calculated Percentages have been rounded +/-.5%.
400
350
300
250
200
150
100
50
0
13 | P a g eUnsheltered Residency
Respondents were asked, “How long have you lived in this county?” This provides a better understanding of the
transient nature of the homeless population.
The respondents that have been in their county of residence greater than 6 years total 57.8% of the total
unsheltered. The respondents that have been in their county of residence between 1 year and 10 years total
26.2% of the total unsheltered.
% of Unsheltered Total Persons
Less than 6 months 7.5% 77
6-12 Months 8.1% 83
Over 12 months to 5 years 14.7% 150
6 to 10 years 11.5% 118
More than 10 years 46.3% 474
Did Not Respond 11.8% 121
Length of Residency
Did Not Respond
More than 10 years
6 to 10 years
Over 12 months to 5 years
6-12 Months
Less than 6 Months
0 100 200 300 400 500
Note: Calculated Percentages have been rounded +/-.5%.
14 | P a g eUnsheltered Reoccurrence of Homelessness
The unsheltered survey measures the duration of homelessness. This is a critical marker that indicates a person
may become chronically homeless. The following questions were asked to help identify those who may be
chronically homeless.
“How long have you been homeless this time?”
% of Unsheltered Total
Persons
Less than 1 month 4.9% 50
1 month to 6 months 18.8% 192
Over 6 months to 1 year 20.4% 209
Over 1 year to 5 years 30.6% 313
Over 5 years 15.9% 163
Did Not Respond 9.4% 96
“Have you been homeless at least 12 months over the last 3 years?
% of Unsheltered Total
Yes 61.7% 631
No 27.9% 285
Did Not Respond 10.5% 107
Note: Calculated Percentages have been rounded +/-.5%.
15 | P a g eChronic Homelessness Results
HUD defines a chronically homeless individual as an adult (persons 18 years or older) who has a disability and:
• Has either been continuously homeless for a year or more
OR
• Has had at least four separate occasions of homelessness in the past three years where the combined
total length of time is at least 12 months. Each period separating the occasions must include at least
seven nights of living in a situation other than a place not meant for human habitation, in an emergency
shelter, or in a safe haven.
To be considered chronically homeless, persons must have been sleeping in a place not meant for human
habitation (e.g., living on the streets) and/or in an emergency shelter/safe haven during that time. For purposes
of the PIT Count, persons living in transitional housing at the time of the PIT Count are not included in this
subpopulation category. The chronic homeless population represents one of the most vulnerable populations
and some of the hardest to house.
Chronic Homelessness in NorCal CoC Region
According to the 2020 PIT data, out of a total of 1,529 people surveyed, 28.4% percent of NorCal CoC’s homeless
population are considered chronically homeless.
Chronic Homelessness Summary
Summary 2018 2019 2020 % Change from 2019
Unsheltered 324 259 376 45.2%
Sheltered* 107 62 59 -4.8%
Total 431 321 435 35.5%
Note: Calculated Percentages have been rounded +/-.5%.
*Total Sheltered includes Emergency Shelter and Transitional Housing reported by respondents.
16 | P a g eVeterans
Veterans are more likely than civilians to experience homelessness. Like the general homeless population,
veterans are at a significantly increased risk of homelessness if they are of low socioeconomic status, have a
mental health disorder, and/or a history of substance abuse.
Additionally, veterans experience a higher prevalence of traumatic brain injuries (TBI) and Post-Traumatic Stress
Disorder (PTSD), both of which have been found to be among the most substantial risk factors for homelessness.
Veterans face the same shortage of affordable housing options and living wage jobs as all Americans, and these
factors, combined with the increased likelihood veterans will exhibit symptoms of PTSD, substance abuse, or
mental illness, can compound to put veterans at a greater risk of homelessness than the general population. A
total of 73 chronically homeless persons were identified as a veteran.
The 2020 PIT Count identified an overall increase of 25.2% in veteran homelessness from 2017.
Based upon the total PIT Count of 1,529, 3.2% of the sheltered population and 5.2% of the unsheltered
population identified as veterans.
Homeless Veteran Summary
2017 2018 2019 2020 % Change Since % Change
Last Year Since 2017
Unsheltered 60 68 58 80 37.9% 33.3%
Sheltered* 43 56 28 49 75.0% 14.0%
Total
103 124 86 129 50.0% 25.2%
Homeless
. Note: Calculated Percentages have been rounded +/-.5%.
17 | P a g eIncarceration and Homelessness
For many years, the NorCal CoC has collected data on the relationship between incarceration and homelessness
with individuals who are incarcerated during the night of the PIT Count. The question asked was “Do you have a
felony conviction?” In more recent years, a follow up question was added, “Have you been denied housing due
to a criminal conviction?”
Many members of the community and service providers have shared anecdotal evidence suggesting a high
correlation of engagement with the criminal justice system and homelessness.
Data collection at a local level allows agencies to evaluate the needs for this segment of the population by
connecting the dots between the cycles of incarceration and homelessness. Individuals recently released from
the criminal justice system often face housing challenges that may contribute to their homelessness.
36% of the respondents stated they have been denied housing due to their felony convictions or criminal history.
Note: Calculated Percentages have been rounded +/-.5%.
Felony Convictions Denied Housing Due to
700 Criminal Activity
800
745
600 586
700
500 600
500
400
312 400
300 268
300 275
200 174 196
200
132 146
125
100 100
64 35
0
0 Yes No Did Not
Yes No Did Not Respond Respond
Sheltered Unsheltered Sheltered Unsheltered
18 | P a g eCounty Profiles on Homelessness
NorCal CoC includes 23,922 square miles and encompasses seven counties. The following section breaks down
the 2020 PIT Count data by County in order to take a closer look at local trends.
Each county faces its own unique challenges with their homeless population. Two of the counties in the NorCal
CoC are home to a state prison facility, while a majority of the counties are small rural counties, all with limited
resources to address homelessness.
NOTE: To ensure the safety and comfort of those who participated, respondents were not required to complete all
survey questions. Missing values for each county are a result of those who did not respond.
19 | P a g eDel Norte County
Total Homeless in Del Norte County
248
Unsheltered
183
Sheltered
65
The total homeless count in Del Norte County represents 16.2% of the total homeless count in the
NorCal CoC Region.
Homeless Profile Total % of Total
Additional Demographics Del Norte
Male 128 County
Female 65 Chronically Homeless 96 38.7%
Transgender 1 Veteran 28 11.3%
Did Not Respond 54 Domestic Violence Victim 8 3.2%
Previously in Foster Care 94 37.9%
Respondents were not required to answer
all survey questions. Felony Conviction 78 31.5%
Families 3 1.2%
Youth (18 to 24) 20 8.1%
Did Not Respond Children (under 18) 1 0.4%
Additional Demographics provided are a subset of the total
Transgender
count and some respondents may be included in more than
one subset. For example: A respondent may be a Veteran
and may also be Chronically Homeless. The total is the
Female
number the respondents reported. Note: Calculated Percentages
have been rounded +/-.5%.
Male
0 50 100 150
20 | P a g eDel Norte County
Population and Household Demographics
Del Norte County is a county in California with a population of 27,788. There are 9,420 households in the county
with an average household size of 2.55 persons. 39.45% of households in Del Norte County are renters.
Income and Rent Overburden in Del Norte County
The median gross income for households in Del Norte County is $40,847 a year, or $3,404 a month. The median
rent for the county is $808 a month.
Households who pay more than thirty percent of their gross income are considered to be Rent Overburdened. In
Del Norte County, a household making less than $2,693 a month would be considered overburdened when
renting an apartment at or above the median rent. 47.63% of households who rent are overburdened in Del
Norte County.
Area Median Income in Del Norte County
Affordable housing program eligibility is commonly determined by one's income. Each household's income is
compared to the incomes of all other households in the area. This is accomplished through a statistic established
by the government called the Area Median Income, most often referred to as AMI. The AMI is calculated and
published each year by HUD. In Del Norte County, HUD calculates the Area Median Income for a family of four as
$57,000.
Fair Market Rents in Del Norte County
Fair Market Rents, often abbreviated as FMR, can be used to better understand the average housing costs of an
area. Notably, Fair Market Rents are used to establish the payment standards for the Housing Choice Voucher
Program, maximum rents in HOME financed rental projects and initial rents for Section 8 project based
assistance.
Studio One BR Two BR Three BR Four BR
$661 $775 $978 $1,369 $1,571
21 | P a g eModoc County
Total Homeless in Modoc County
30
Unsheltered
26
Sheltered
4
The total homeless count in Modoc County represents 2.0% of the total homeless count in the NorCal
CoC Region.
% of Total
Additional Demographics Modoc
Homeless Profile Total County
Chronically Homeless 2 6.7%
Male 10
Veteran 0 N/A
Female 9
Domestic Violence Victim 0 N/A
Did Not Respond 1
Respondents were not required to answer
Previously in Foster Care 3 10.0%
all survey questions. Felony Conviction 1 3.3%
Families 4 13.3%
Youth (18 to 24) 0 N/A
Children (under 18) 6 20%
Did Not Respond
Additional Demographics provided are a subset of the total
count and some respondents may be included in more than
Female one subset. For example: A respondent may be a Veteran
and may also be Chronically Homeless. The total is the
number the respondents reported. Note: Calculated Percentages
Male have been rounded +/-.5%.
0 5 10 15
22 | P a g eModoc County
Population and Household Demographics
Modoc County is a county in California with a population of 9,184. There are 3,745 households in the county with
an average household size of 2.32 persons. 26.11% of households in Modoc County are renters.
Income and Rent Overburden in Modoc County
The median gross income for households in Modoc County is $37,860 a year, or $3,155 a month. The median rent
for the county is $653 a month.
Households who pay more than thirty percent of their gross income are considered to be Rent Overburdened. In
Modoc County, a household making less than $2,177 a month would be considered overburdened when renting
an apartment at or above the median rent. 52.86% of households who rent are overburdened in Modoc County.
Area Median Income in Modoc County
Affordable housing program eligibility is commonly determined by one's income. Each household's income is
compared to the incomes of all other households in the area. This is accomplished through a statistic established
by the government called the Area Median Income, most often referred to as AMI. The AMI is calculated and
published each year by HUD. In Modoc County, HUD calculates the Area Median Income for a family of four as
$55,600.
Fair Market Rents in Modoc County
Fair Market Rents, often abbreviated as FMR, can be used to better understand the average housing costs of an
area. Notably, Fair Market Rents are used to establish the payment standards for the Housing Choice Voucher
Program, maximum rents in HOME financed rental projects and initial rents for Section 8 project based
assistance.
Studio One BR Two BR Three BR Four BR
$520 $585 $770 $1,062 $1,228
23 | P a g ePlumas County
Total Homeless in Plumas County
115
Unsheltered
77
Sheltered
38
The total homeless count in Plumas County represents 7.5% of the total homeless count in the NorCal
CoC Region.
% of Total
Additional Demographics Plumas
Homeless Profile Total County
Chronically Homeless 22 19.1%
Male 57
Veteran 3 2.6%
Female 47
Domestic Violence Victim 9 7.8%
Transgender 1
Previously in Foster Care 13 11.3%
Did Not Respond 10
Felony Conviction 27 23.5%
Respondents were not required to answer
all survey questions. Families 11 9.6%
Youth (18 to 24) 6 5.2%
Children (under 18) 15 13.0%
Did Not Respond
Transgender Additional Demographics provided are a subset of the total
count and some respondents may be included in more than
one subset. For example: A respondent may be a Veteran
Female and may also be Chronically Homeless. The total is the
number the respondents reported. Note: Calculated Percentages
have been rounded +/-.5%.
Male
0 20 40 60
24 | P a g ePlumas County
Population and Household Demographics
Plumas County is a county in California with a population of 18,966. There are 8,217 households in the county
with an average household size of 2.26 persons. 27.69% of households in Plumas County are renters.
Income and Rent Overburden in Plumas County
The median gross income for households in Plumas County is $47,333 a year, or $3,944 a month. The median rent
for the county is $836 a month.
Households who pay more than thirty percent of their gross income are considered to be Rent Overburdened. In
Plumas County, a household making less than $2,787 a month would be considered overburdened when renting
an apartment at or above the median rent. 47.38% of households who rent are overburdened in Plumas County.
Area Median Income in Plumas County
Affordable housing program eligibility is commonly determined by one's income. Each household's income is
compared to the incomes of all other households in the area. This is accomplished through a statistic established
by the government called the Area Median Income, most often referred to as AMI. The AMI is calculated and
published each year by HUD. In Plumas County, HUD calculates the Area Median Income for a family of four as
$70,700.
Fair Market Rents in Plumas County
Fair Market Rents, often abbreviated as FMR, can be used to better understand the average housing costs of an
area. Notably, Fair Market Rents are used to establish the payment standards for the Housing Choice Voucher
Program, maximum rents in HOME financed rental projects and initial rents for Section 8 project based
assistance.
Studio One BR Two BR Three BR Four BR
$619 $722 $916 $1,250 $1,453
25 | P a g eShasta County
Total Homeless in Shasta County
816
Unsheltered
454
Sheltered
362
The total homeless count in Shasta County represents 53.4% of the total homeless count in the NorCal
CoC Region.
Additional Demographics % of Total
Shasta
Homeless Profile Total County
Male 413 Chronically Homeless 220 27.0%
Female 250 Veteran 59 7.2%
Transgender 2 Domestic Violence Victim 74 9.1%
Gender Non-Conforming 1 Previously in Foster Care 151 18.5%
Did Not Respond 150 Felony Conviction 174 21.3%
Respondents were not required to answer Families 42 5.1%
all survey questions. Youth (18 to 24) 63 7.7%
Children (under 18) 59 7.2%
Did Not Respond
Additional Demographics provided are a subset of the total
Gender Non-
count and some respondents may be included in more than
Conforming
one subset. For example: A respondent may be a Veteran
Transgender
and may also be Chronically Homeless. The total is the
Female number the respondents reported. Note: Calculated Percentages
have been rounded +/-.5%.
Male
0 200 400 600
26 | P a g eShasta County
Population and Household Demographics
Shasta County is a county in California with a population of 178,942. There are 69,375 households in the county
with an average household size of 2.54 persons. 37.54% of households in Shasta County are renters.
Income and Rent Overburden in Shasta County
The median gross income for households in Shasta County is $44,620 a year, or $3,718 a month. The median rent
for the county is $926 a month.
Households who pay more than thirty percent of their gross income are considered to be Rent Overburdened. In
Shasta County, a household making less than $3,087 a month would be considered overburdened when renting
an apartment at or above the median rent. 55.94% of households who rent are overburdened in Shasta County.
Area Median Income in Shasta County
Affordable housing program eligibility is commonly determined by one's income. Each household's income is
compared to the incomes of all other households in the area. This is accomplished through a statistic established
by the government called the Area Median Income, most often referred to as AMI. The AMI is calculated and
published each year by HUD. In Shasta County, HUD calculates the Area Median Income for a family of four as
$61,900.
Fair Market Rents in Shasta County
Fair Market Rents, often abbreviated as FMR, can be used to better understand the average housing costs of an
area. Notably, Fair Market Rents are used to establish the payment standards for the Housing Choice Voucher
Program, maximum rents in HOME financed rental projects and initial rents for Section 8 project based
assistance.
Studio One BR Two BR Three BR Four BR
$630 $744 $966 $1,394 $1,696
27 | P a g eSierra County
Total Homeless in Sierra County
9
Unsheltered
9
Sheltered
0
The total homeless count in Sierra County represents 0.6% of the total homeless count in the NorCal
CoC Region.
Additional Demographics % of Total
Homeless Profile Total Sierra County
Male 6 Chronically Homeless 3 33.3%
Female 2 Veteran 1 11.1%
Did Not Respond 1 Domestic Violence Victim 0 N/A
Previously in Foster Care 1 11.1%
Respondents were not required to answer
all survey questions.
Felony Conviction 1 11.1%
. Families 0 N/A
Youth (18 to 24) 0 N/A
Children (under 18) 0 N/A
Did Not Respond Additional Demographics provided are a subset of the total
count and some respondents may be included in more than
one subset. For example: A respondent may be a Veteran
Female and may also be Chronically Homeless. The total is the
number the respondents reported. Note: Calculated Percentages
have been rounded +/-.5%.
Male
0 2 4 6 8
28 | P a g eSierra County
Population and Household Demographics
Sierra County is a County in California with a population of 3,021. There are 1,252 households in the county with
an average household size of 2.38 persons. 21.65% of households in Sierra County are renters.
Income and Rent Overburden in Sierra County
The median gross income for households in Sierra County is $42,833 a year, or $3,569 a month. The median rent
for the county is $938 a month.
Households who pay more than thirty percent of their gross income are considered to be Rent Overburdened. In
Sierra County, a household making less than $3,127 a month would be considered overburdened when renting an
apartment at or above the median rent. 60.89% of households who rent are overburdened in Sierra County.
Area Median Income in Sierra County
Affordable housing program eligibility is commonly determined by one's income. Each household's income is
compared to the incomes of all other households in the area. This is accomplished through a statistic established
by the government called the Area Median Income, most often referred to as AMI. The AMI is calculated and
published each year by HUD. In Sierra County, HUD calculates the Area Median Income for a family of four as
$71,500.
Fair Market Rents in Sierra County
Fair Market Rents, often abbreviated as FMR, can be used to better understand the average housing costs of an
area. Notably, Fair Market Rents are used to establish the payment standards for the Housing Choice Voucher
Program, maximum rents in HOME financed rental projects and initial rents for Section 8 project based
assistance.
Studio One BR Two BR Three BR Four BR
$858 $975 $1,270 $1,825 $2,026
29 | P a g eSiskiyou County
Total Homeless in Siskiyou County
311
Unsheltered
274
Sheltered
37
The total homeless count in Siskiyou County represents 20.0% of the total homeless count in the NorCal
CoC Region.
Additional Demographics % of Total
Siskiyou
Homeless Profile Total County
Male 208 Chronically Homeless 92 29.6%
Veteran 24 7.7%
Female 95
Domestic Violence Victim 47 15.1%
Transgender 2
Gender Non-Conforming 4 Pre 55 17.7%
Did Not Respond 2 Felony Conviction 95 30.5%
Respondents were not required to answer Families 24 7.7%
all survey questions. Youth (18 to 24) 32 10.3%
Children (under 18) 32 10.3%
Did Not Respond
Gender Non-
Conforming Additional Demographics provided are a subset of the total
count and some respondents may be included in more than
Transgender
one subset. For example: A respondent may be a Veteran
Female and may also be Chronically Homeless. The total is the
number the respondents reported. Note: Calculated
Male Percentages have been rounded +/-.5%.
0 100 200 300
30 | P a g eSiskiyou County
Population and Household Demographics
Siskiyou County is a county in California with a population of 43,895. There are 19,133 households in the county
with an average household size of 2.26 persons. 36.24% of households in Siskiyou County are renters.
Income and Rent Overburden in Siskiyou County
The median gross income for households in Siskiyou County is $37,170 a year, or $3,098 a month. The median
rent for the county is $806 a month.
Households who pay more than thirty percent of their gross income are considered to be Rent Overburdened. In
Siskiyou County, a household making less than $2,687 a month would be considered overburdened when renting
an apartment at or above the median rent. 53.69% of households who rent are overburdened in Siskiyou County.
Area Median Income in Siskiyou County
Affordable housing program eligibility is commonly determined by one's income. Each household's income is
compared to the incomes of all other households in the area. This is accomplished through a statistic established
by the government called the Area Median Income, most often referred to as AMI. The AMI is calculated and
published each year by HUD. In Siskiyou County, HUD calculates the Area Median Income for a family of four as
$52,000.
Fair Market Rents in Siskiyou County
Fair Market Rents, often abbreviated as FMR, can be used to better understand the average housing costs of an
area. Notably, Fair Market Rents are used to establish the payment standards for the Housing Choice Voucher
Program, maximum rents in HOME financed rental projects and initial rents for Section 8 project based
assistance.
Studio One BR Two BR Three BR Four BR
$591 $650 $856 $1,218 $1,344
31 | P a g eMethodology
The NorCal Executive Board approved the Point in Time Methodology as required by HUD. A combination of HUD
approved methods were used to create the most accurate count for the one-night count.
The NorCal CoC uses a census style approach to count unsheltered individuals. This approach provides a direct
and complete count of all people and their characteristics. Local homeless service providers and advocates are
active and valued partners in the planning and implementation of PIT Count represented in this report, as well as
previous PIT Counts. The planning team invited the public and law enforcement partners for their input on a
number of aspects related to the PIT Count. Examples of this includes known locations of the homeless
community, survey wording, additional data collected, and volunteer recruitment. For the sheltered target
population, the counting approach utilized a random sample.
The survey contained HUD required questions and local questions. The local questions came from community
organizations that had specific areas of concern. The subsequent, in-depth qualitative survey was used to gain a
more comprehensive understanding of the experiences and demographics of those counted in the counties.
Survey coordinators worked to ensure a representative sample of respondents, garnering information from
subpopulations that are often hidden or hard to reach. As volunteers encountered unsheltered homeless
persons, they were instructed to use HUD’s Observational Tool if respondents declined to participate in the
survey. Missing values are listed in this report as “did not respond” or values were extrapolated using HUD’s
extrapolation tool.
Please note, PIT Count data for Lassen County is not included in this report as their count occurred on a separate
day in January.
Extrapolation
The HUD Extrapolation Tool was used on portions of this report and in the final submission to HUD. The tool
assists the CoC in extrapolation of gender, ethnicity and race information within each household category for
people whom the CoC was not able to collect this information. This tool may be used for extrapolation if reliable
data exists for 80 percent or more of the clients. Extrapolation is needed to ensure the number of homeless
individuals are not underestimated as a result of unreported data during the time of the count.
Volunteer Recruitment and Training
Many individuals who live and/or work in each county supported NorCal CoC’s effort to count the local homeless
population. To participate in the count, all volunteers were required to attend a training in the weeks preceding
the survey process. Volunteers used paper surveys and were trained on basics such as etiquette, safety and how
to administer the survey. Volunteers canvassed routes in each county. In many instances, teams received maps
which identified the area to be canvassed which clearly showed the boundaries of the counting area.
32 | P a g eData Quality
The NorCal Lead Agency (Lead Agency), Shasta County Housing and Community Action Agency, oversaw the Point
in Time data collection with the assistance of trained staff and volunteers. Due to number of volunteers
conducting surveys and completing the data entry, an audit of each survey was completed by the Lead Agency.
The audit included evaluating the surveys for data quality, checking the data entry for completeness, and using
data logic checks to identify duplicate clients. During the data quality review, it was determined some uses of the
observation tool were not in alignment with HUD guidelines. In those instances, the data was not included in this
report.
Summary of Excluded Data
Number of Individuals and Reason for Removal
Data Quality Issues 29
Duplicate Clients 1
Individuals Identified as Not Homeless 65
33 | P a g eAppendix A: Definitions and Abbreviations
Annual Homeless Assessment Report (AHAR)
HUD’s annual report to Congress on the nature and extent of homelessness nationwide. The report details yearly
homelessness counts, demographics, trends, and service usage; reports are compared and contrasted to data
collected for previous years, helping to determine if homelessness is increasing or decreasing.
Bed Utilization
An indicator of whether shelter beds are occupied on a particular night or over a period of time.
Chronically Homeless Individual
A homeless adult individual (persons 18 years or older) with a disability who:
• Has been continuously homeless for a year or more
(OR)
• Has had at least four separate occasions of homelessness in the past three years where the combined
total length of time is at least 12 months. Each period separating the occasions must include at least
seven nights of living in a situation other than a place not meant for human habitation, in an emergency
shelter, or in a safe haven.
Continuum of Care (CoC)
The primary decision-making entity defined in the funding application to HUD as the official body representing a
community plan to organize and deliver housing and services to meet the specific needs of people who are
homeless as they move to stable housing and maximum self-sufficiency.
Coordinated Entry System
A centralized or coordinated process designed to coordinate program participant intake assessment and provision
of referrals. A centralized or coordinated assessment system covers the geographic area, is easily accessed by
individuals and families seeking housing or services, is well advertised, and includes a comprehensive and
standardized assessment tool.
Disabling Condition
For the purposes of this study, a disabling condition is defined as physical disability, mental illness, depression,
alcohol or drug abuse, chronic health problems, HIV/AIDS, Post-traumatic Stress Disorder (PTSD), or a
developmental disability that impacts a person’s ability to getting housing and/or remaining housed.
Emergency Shelter (ES)
A homeless program that is intended to provide short-term support and emergency housing to homeless
individuals. Individuals who are staying in an Emergency Shelter are still considered literally homeless. Emergency
shelter may take the form of a congregate shelter, motel voucher, or domestic violence shelter.
Family
Defined as a household with at least one adult and one child under 18.
34 | P a g eHomeless Management Information System (HMIS)
The information system designated by the CoC to process Protected Personal Information (PPI) and other data in
order to create an unduplicated accounting of homelessness within the CoC. An HMIS may provide other
functions beyond unduplicated accounting.
Housing Inventory Count (HIC)
The Point-in-Time inventory of provider programs within the CoC that provide beds and units dedicated to serve
persons who are homeless. It should reflect the number of beds and units available on the night designated for
the count that are dedicated to serve persons who are homeless, per the HUD homeless definition.
Housing and Urban Development (HUD)
A federal organization aiming to increase homeownership, support community development, and increase access
to affordable housing free from discrimination
Permanent Supportive Housing (PSH)
Long-term, community-based housing that has supportive services for homeless persons with disabilities. This
type of supportive housing enables the special-needs populations to live as independently as possible in a
permanent setting. Permanent housing can be provided in one structure or in several structures and at one site
or in multiple structures at scattered sites.
Point-in-Time (PIT)
A snapshot of the homeless population taken on a given day. Since 2005, HUD requires all CoC applicants to
complete this count every other year in the last week of January. This count includes a street count in addition to
a count of all clients in emergency and transitional beds.
Rapid Re-Housing
Housing relocation and stabilization services and short-and/or medium-term rental assistance as necessary to
help individuals or families living in shelters or in places not meant for human habitation move as quickly as
possible into permanent housing and achieve stability in that housing. Eligible costs also include utilities, rental
application fees, security deposits and last month’s rent.
Sheltered Homeless
Sheltered homeless individuals are those who are living in emergency shelters or transitional housing programs.
Single Individual
Refers to an unaccompanied adult or youth.
Transitional Age Youth
Also known as TAY, refers to an unaccompanied youth aged 18-24 years.
Unaccompanied Children
Refers to children under the age of 18 who do not have a parent or guardian present.
Unsheltered Homeless
Homeless individuals unaccompanied by a child under the age of 18 who are living on the streets or in abandoned
buildings, storage structures, vehicles, encampments, or any other place unfit for human habitation.
35 | P a g eData Sources
Statistical data on each county was gathered from the following sources:
https://affordablehousingonline.com
https://www.rentdata.org
https://en.wikipedia.org
Acknowledgements
The NorCal Continuum of Care would like to thank the many individuals and agencies who contributed to the
2020 Point-In-Time Count. The participation of community volunteers and partner agencies is critical to the
NorCal CoC’s PIT success. Countless community volunteers, City and County employees, and local community-
based organizations assisted with the count, from the initial planning to the publication of this report. It is
impossible to name every person involved, but their support was inspiring and invaluable to this process.
Del Norte County – Lead Organizer: Carmen Fong Chavez
Shasta County – Lead Organizer: Amber Middleton
Sierra County – Lead Organizer: Laurie March
Siskiyou County – Lead Organizer: Ed Pecis
Modoc County – Lead Organizer: Diane G. Fogle
Plumas County – Lead Organizer: Cathy Rahmeyer
36 | P a g eYou can also read


