2020 QUARTER 3 (July-September) - Economic Performance Indicators for Cape Town - Invest Cape Town
←
→
Page content transcription
If your browser does not render page correctly, please read the page content below
Economic Performance Indicators for Cape Town

  2020 QUARTER 3
  (July–September)
  WWW.INVESTCAPETOWN.COM
EPIC 2020: Q3

                  Electronic document navigation:

                 Click on entries on the contents page
                       to go to the relevant page.

                    Click on the page number at the
                bottom left or bottom right of each page
                     to return to the contents page.

1
ACKNOWLEDGEMENTS

                         ACKNOWLEDGEMENTS
The EPIC quarterly publication is a collaboration between the Enterprise and Investment, and
  Policy and Strategy departments of the City of Cape Town. The EPIC publication presents
 and analyses economic (and related) trends in Cape Town on a quarterly basis. This edition
   focuses on the third quarter of 2020, covering the period 1 July to 30 September 2020.

             ECONOMIC CONTENT AUTHORED BY THE ECONOMIC
            ANALYSIS BRANCH, POLICY AND STRATEGY DEPARTMENT

                               Manager: Economic Analysis:
                                       Paul Court

                               Project manager and author:
                                      Dilshaad Gallie

                                    Additional authors:
                                       Alfred Moyo
                                    Monique Petersen
                                       Jodie Posen
                                      Yoliswa Tiwe

           MARKETING, DESIGN AND DISTRIBUTION BY THE INVEST
        CAPE TOWN TEAM, ENTERPRISE AND INVESTMENT DEPARTMENT

                                Manager: Place Marketing:
                                      Rory Viljoen

                                     Project manager:
                                    Tarryn Voigt-Mallum

                                      Success stories:
                                       Caryn Jeftha
                                         HelloFCB
                                       Kim Whitaker

                                         Email:
                           economic.research@capetown.gov.za
                               info@investcapetown.gov.za

                                     Online access:
                                www.capetown.gov.za/EPIC

                      ADDITIONAL SOURCES OF INFORMATION

           City of Cape Town Planning and Building Development Management:
                                       Marius Crous
                                    Lizanne Ryneveldt

                City of Cape Town Electricity Generation and Distribution:
                                      Cornie Malan

                                                                                               2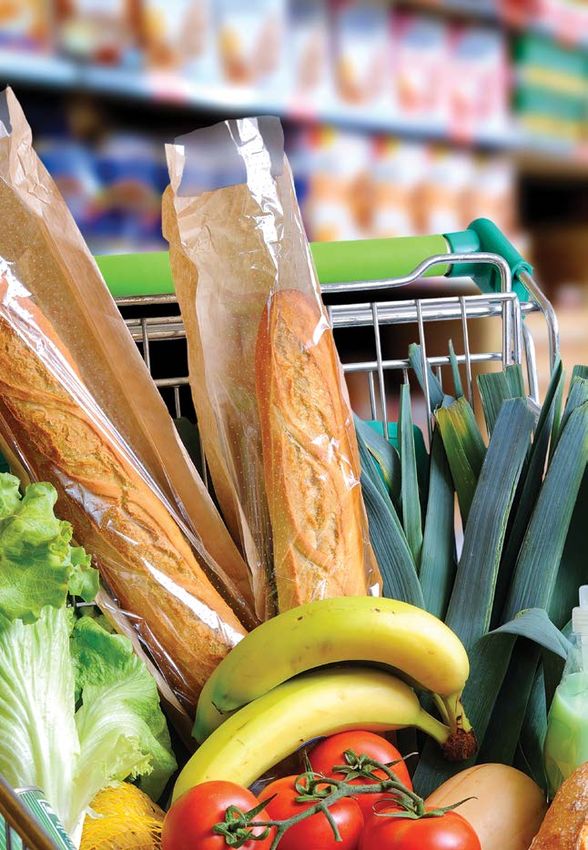
EPIC 2020: Q3

FOREWORD
Although the full effect of the various stages of       Even before Covid-19, many businesses found
the national lockdown is yet to be quantified, the      themselves in distress, and the pandemic has
short-term costs for the economy have been dire.        exacerbated this situation. The challenges are
Early on in the global Covid-19 pandemic, I set up      not just financial, as most of these businesses
an essential task team to work on our response          are struggling with productivity, or streamlining
to the impact of the lockdown measures.                 their processes, to ensure optimal outcomes and
                                                        expansion potential into the future. In response to
The City’s Economic Action Plan (EAP) serves as its
                                                        this, the City has joined forces with Productivity SA
economic response and contingency plan for the
                                                        to offer the Business Support Programme, which
short-term crisis facing the local economy because
                                                        is designed to provide businesses in distress with
of the various stages of lockdown. All our plans
                                                        the help they need. Operated through the Business
and programmes are aimed at getting our local
                                                        Hub, the programme targets small businesses
economy back on its feet as fast as possible, but
                                                        that employ between 15 and 50 staff members,
also to build a stronger, more resilient economy
                                                        partnering with them to proactively address the
for generations to come. We focus our energy on
                                                        challenges they are facing and prevent liquidation,
attracting investment in high-growth sectors, which
                                                        closure and job losses.
creates jobs and leads to economic expansion.

To help us in this pursuit, we partner with, and        During the toughest times of the lockdown, I visited
provide funding to, our Strategic Business Partners     three companies operating in the clothing, food and
in high-growth sectors like Business Process            beverages, and electronics manufacturing sectors
Outsourcing (call centres), the green economy,          respectively, and which are part of our Business
craft and design, boat building, all of which are       Support Programme. I am very proud to report
poised for significant growth.                          that despite the challenges they were facing, our
                                                        interventions have enabled all of these businesses
During the Covid-19 crisis, my team and I               to expand to the point where the clothing company
reviewed our Strategic Business Partners’ business      now supplies uniforms to big corporates, the food
implementation plans in a bid to repurpose              company is supplying popular restaurants, and the
available funding to better assist businesses to get    electronic manufacturer is even exporting to China.
through the lockdown, adapt to the new normal,
and position themselves for growth into the future.     For our city to compete globally and achieve
I am very proud to confirm that over just six months    inclusive socio-economic growth, we know that
between April and September 2020, the City’s            we must invest in skills and training, especially for
Strategic Business Partners (SBPs) collectively         those sectors that are poised for substantial growth,
facilitated R8,8 billion worth of investment, created   thereby attracting investment and delivering
4 980 new jobs and trained 1 366 people.                employment opportunities. The Cape Skills and
                                                        Accelerator Employment project, a first of its kind
The City of Cape Town has also made various forms
                                                        partnership between the National Skills Fund
of support and relief available to local businesses.
                                                        (NSF), Province, and the private sector, is such
These measures include the following:
                                                        an investment. The project does not train just for
•	Lease deferments for commercial                      training’s sake; it will create over 3 000 training and
   leases for City-owned premises                       placement opportunities for marginalised youth
•	Rates relief for certain categories                  and women in the business process outsourcing
   of tourism properties                                (or call centre) sector, as well as the clothing and
•	Industry support in partnership with                 textile sector.
   our strategic business partners
                                                        As a result of its work in the clothing and textile
•	Smart procurement and supplier
                                                        sector, the project will enable SMMEs to take
   development programmes
                                                        on machinists at a greatly reduced cost to their
•	Workforce development and training                   businesses – with savings further enhanced by tax
   for high-growth sectors                              incentives and rebates – while creating learning
•	Business retention and expansion initiatives         and work opportunities for unemployed women.
•	Investment facilitation and promotion                Young people and women participating in the

3
FOREWORD

programme will be supported in their employability        cooking, heating and lighting from gas refilling
development journeys by means of an accredited            stations close to their homes and communities.
learnership (NQF level 2) in either clothing, footwear,
leather, or textile production.                           Another example of the effectiveness of the IFU
                                                          was the assistance and support it recently provided
Often, in my interactions with businesses, I am told      to the world’s largest pharma-tech company, Roche,
how they struggle to source the right people with         in the process of expanding its operations in
the appropriate skills that they need to sustain and      Cape Town.
grow their operations. Through this new Cape Skills
and Employment Accelerator Project, and our other         Then, in August 2020 the City facilitated access to
ongoing strategic business partnerships, the City         investment incentives that enabled the investment
is ensuring that key sectors have the skills pipeline     in Cape Town by Amazon Web Services – the largest
they need to deliver on increasing demand for             capital investment in South Africa since 1994.
their products, which in turn will create a cycle
of business growth and additional employment.             Also, as a part of our business retention and
                                                          expansion efforts, my department is currently
To further address this skills gap, the City operates     rolling out surveys with the businesses in each of
a workforce development programme called Jobs             Cape Town’s 26 industrial areas. I have joined my
Connect. Through the programme we have created            team in the field to learn about the needs, concerns,
a better link between talent demand and supply.           suggestions and perceptions of local businesses.
Unemployed residents, with a focus on women and           With this information, we intend to address any
youth, are provided with work-readiness training          issues in our control that might be holding
and are then entered into a database that is shared       back the growth of these businesses. In the near
with prospective employers to give them access            future, I look forward to launching a first of its kind,
to potential employees with the skills and training
                                                          fully kitted mobile business help desk that will
needed in their business.
                                                          allow us to take help to the businesses that need it,
Another vital cornerstone of business and                 right where they exist.
employment growth in Cape Town is the city’s
                                                          It is very pleasing to note that the strategies
capacity to attract investment. Cape Town already
                                                          the City has implemented, and its collective
has a very strong investment ecosystem, precisely
                                                          achievements, demonstrate that where there is a
because of the good working relationships between
                                                          will, there certainly is a way to attract significant
the City and its SBPs. Those SBPs attract the
                                                          investment that will create the jobs our economy
investors, and the City’s Investment Facilitation Unit
                                                          needs to thrive.
(IFU), which exists in the Enterprise and Investment
Department, ensures that their experience of
investing in Cape Town is as smooth and effortless
as possible.
                                                                                   Alderman James Vos
The IFU does this by navigating municipal                                          Mayoral Committee Member
processes, clearing bottlenecks, and providing                                     for Economic Opportunities
business retention and expansion services such as                                  and Asset Management
financial and non-financial investment incentives,
to make sure that businesses grow and create job
opportunities. By way of example, the IFU recently
assisted the proudly Capetonian PayGas company
with access to a non-financial incentive in the form
of fast-tracked building plan approvals, so that they
could launch gas refilling stations in Nyanga and
Philippi. This not only promoted business success,
but also delivers value to residents in these areas
who can now access affordable basic energy for

                                                                                                                  4
EPIC 2020: Q3 Electronic document navigation:
Click on entries on the contents page
to go to the relevant page.
CONTENTS
Click on the page number at the
bottom left or bottom right of each page
totogo
return
backtotothe
thecontents
contentspage.
page.
ACKNOWLEDGEMENTS 02
FOREWORD 03
INTRODUCTION 07
KEY FINDINGS FOR THE THIRD QUARTER OF 2020 08
01. SUCCESS STORIES 09
02. OVERVIEW 15
03. ECONOMIC GROWTH 21
South Africa’s quarter-on-quarter economic performance 23
A global comparison of economic performance in the third quarter 24
Western Cape and Cape Town economic performance 25
04. INFLATION 27
Inflation overview 29
Geographical inflation 31
Western Cape food inflation 33
05. LABOUR MARKET 35
Cape Town’s labour market performance in the third quarter of 2020 37
Employment comparison of metros 38
Unemployment in Cape Town 39
Sector employment trends for Cape Town 40
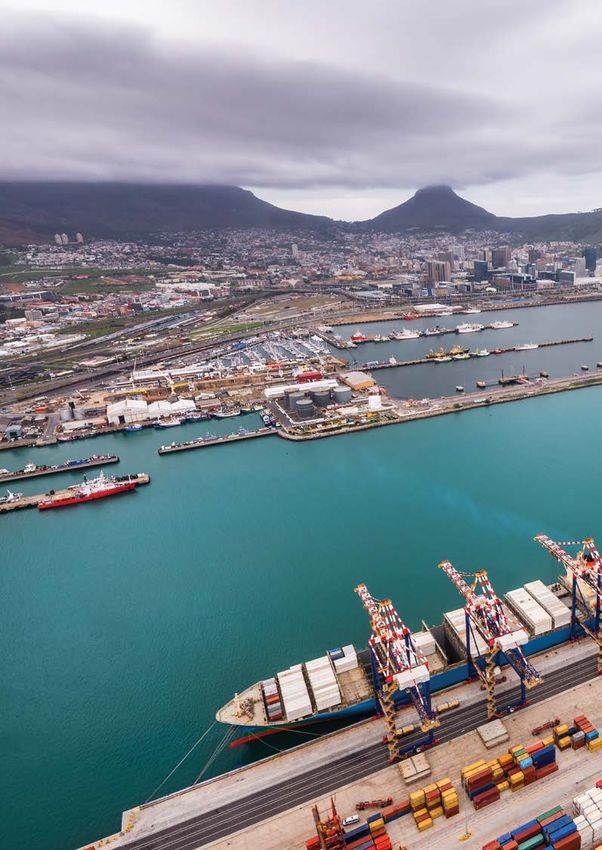
06. INFRASTRUCTURE AND TRADE 41
Container traffic 43
Cape Town trade 45
Airport statistics 47
Commercial electricity usage 48
07. TOURISM 49
08. ADDITIONAL INDICATORS 53
Building developments 55
New vehicle sales 58
5
CONTENTS

REFERENCE LIST                                                                                             59

ABBREVIATIONS                                                                                              61

LIST OF TABLES
Table 1: Cost of core foods in the Household Food Basket, September to October 2020                        34
Table 2: Cape Town labour market indicators                                                                37
Table 3: Unemployment rate comparison of metros, 2020 Q3 versus 2020 Q2 and 2019 Q3                        39
Table 4: Comparison of total containers handled (in TEUs)                                                  44
Table 5: Cape Town’s top 10 exports, 2020 Q3                                                               46

LIST OF FIGURES
Figure 1: Bureau of Economic Research’s comparison of annualised economic growth rates for 2020 Q3         24
Figure 2: Real GGP growth for the Western Cape, 2008 Q1 to 2020 Q3                                         25
Figure 3: Sectoral real GDP-R growth rates in the Western Cape and South Africa, 2020 Q3                   26
Figure 4: CPI and PPI trends for South Africa, January 2015 to October 2020                                29
Figure 5: CPI inflation rate at a provincial level, July to September 2020                                 31
Figure 6: Average consumer price inflation for the Western Cape and South Africa, 2020 Q3                  32
Figure 7: Western Cape food price inflation, 2019 Q1 to 2020 Q3                                            33
Figure 8: Employment comparison with other metros by major sector, 2020 Q2 versus 2020 Q3                  38
Figure 9: Quarterly and annual change in employment per sector for Cape Town, 2020 Q3                      40
Figure 10: Total containers handled (nationally), 2016 Q1 to 2020 Q3                                       43
Figure 11: Annual change in TEUs handled at the Port of Cape Town, 2016 Q1 to 2020 Q3                      44
Figure 12: Cape Town’s trade balance, 2016 Q1 to 2020 Q3                                                   45
Figure 13: Total (monthly) passenger movements at South Africa’s major airports, 2015 Q1 to 2020 Q3        47
Figure 14: Cape Town’s commercial electricity usage, June 2019 to October 2020                             48
Figure 15: Total (monthly) visits to the top five tourist destinations of Cape Town, 2015 Q1 to 2020 Q3    52
Figure 16: Building plans submitted to the City of Cape Town, 2011 Q1 to 2020 Q3                           55

                                                                                                                 6
EPIC 2020: Q3

INTRODUCTION
This is the 30 th edition of the EPIC publication that    recovered over the next three years. However,
presents and analyses economic (and related)              the unemployment figure is exacerbated by the
trends in Cape Town on a quarterly basis. Focusing        54 000 additional people joining the working age
on quarter 3 of 2020, one can see some green              cohort over this time, when compared to quarter
shoots of recovery after the Covid-19 lockdown            3 of 2019. This had the dual effect of dropping the
level 5 losses experienced in quarter 2. Although         employment rate by 7,3 percentage points to 46,9%
the economy has improved in quarter 3 compared            in quarter 3 of 2020 and making it even harder for
to quarter 2 of 2020, it has worsened compared            the growing number of unemployed people to find
to the same quarter in the previous year.                 gainful employment.

The unprecedented losses in quarter 2, due to             In quarter 3 of 2020, Cape Town’s broad
the lockdown regulations, resulted in the worst           unemployment rate (including job seekers who
annualised quarterly GDP declines in South Africa         were once again able to seek work after being
(-51,7%) and the Western Cape (-51,2%). After             restricted from doing so under lockdown level 5)
the stringent lockdown, with the easing of many           was substantially higher than quarter 3 of 2019,
restrictions, South Africa’s annualised 2020 quarter      almost reaching 30%. Even with the increase, Cape
3 GDP grew by 66,1% quarter-on-quarter, better            Town still had the lowest broad unemployment rate
than the Bloomberg consensus expectation of               compared to all other metros in South Africa. This
55%. The Western Cape GDP-R, a proxy for Cape             was mainly due to the mitigating effects of sectors
Town’s GDP-R, grew by a lower 57,7% over the same         that remained functional during lockdown, and
period, impacted by its nominal mining activity, a        the fast recovery of the construction and finance
sector that accounted for most of the growth at a         sectors in quarter 3, after their quarter 2 losses.
national level. The manufacturing sector benefited        In quarter 3 of 2020, Johannesburg, eThekwini,
the most from the easing of restrictions, with the        Nelson Mandela Bay, and Tshwane all experienced
highest contribution to total provincial growth           larger increases in their broad unemployment
(adding 20,9 percentage points). While it may be          rates from quarter 3 of 2019, with an average
tempting to view the 57,7% growth as a full rebound       6,9 percentage points increase.
of economic output from the quarter 2 losses, this is
                                                          As recognised in the City’s Inclusive Economic
not the case. National and provincial GDP in the third
                                                          Growth Strategy (IEGS), which was out for public
quarter of 2020 was still less than it was in quarter 3
                                                          comment in the second half of 2020, Cape Town has
of 2019, with year-on-year losses of 6,1% and 6,7%
                                                          performed significantly better under the prevailing
respectively. These declines have severely impacted
                                                          economic circumstances than most other metro
economic output, which is expected to take a few
                                                          areas, due to the city’s comparative advantages
years to return to 2019 levels.
                                                          and the development of policy and infrastructure
Results from the Quarterly Labour Force                   initiatives that have cultivated a business-friendly
Survey (QLFS) for quarter 3 show the long-term            environment. However, the Covid-19 pandemic
consequences of the Covid-19 pandemic and the             has exacerbated pre-existing economic challenges
associated regulations on Cape Town’s labour              in Cape Town, not least of which is widespread
market. Although the QLFS showed that 20 000              unemployment, made worse by recessional firm
jobs were gained in Cape Town from quarter 2              closures. The IEGS highlights the need for business
to quarter 3, due to a large bounce-back in the           retention and outlines some interventions at
informal sector, Cape Town still had 190 000 fewer        a business, sector, and area level that address
jobs than in quarter 3 of 2019. If conditions allow,      challenges faced by firms operating in Cape
this unprecedented number of job losses could be          Town. These interventions include Private-Public

7
Dialogue (PPD), sector support, developing township
economies and informal sector collaboration.

Quarter-on-quarter trends show that GDP-R                KEY FINDINGS FOR THE
recovered slightly faster than expected, however,
the momentum gained in this quarter is likely to
                                                         THIRD QUARTER OF 2020
be diminished by a second wave of Covid-19 and           In the third quarter of 2020, the Western
load-shedding in quarter four. Other indicators          Cape economy grew by 57,7% quarter-
that show quarter-on-quarter improvements, but           on-quarter, mirroring the national trend
no progress from 2019 levels, are vehicle sales,         and commencing its economic recovery
Cape Town International passenger movements,             following the nationwide lockdown.
and building plan submissions. The path towards          The provincial growth was driven by the
recovery is showcased by year-on-year improvements.      manufacturing and trade sectors.
These were seen in quarter 3 for the number of
containers and the value of exports shipped from         The Western Cape recorded an inflation
the Port of Cape Town, which increased by 5% and         rate of 3,6% at the end of the third quarter
6% respectively from quarter 3 of 2019. Luxury           of 2020, which is higher than the 2,8%
items, such as yachts and jewellery, resumed their       shown at the end of the second quarter.
position in the top export rankings, indicating          This was also higher than the national
renewed demand for these products, albeit with a         inflation rate of 3,0%, and represented
weaker exchange rate in quarter 3 driving demand.        a return to the target range of 3% to 6%
Moving from international to domestic demand, the        set by National Treasury.
Business Confidence Index for South Africa rose
                                                         On a quarter-on-quarter basis, the
to 24 index points in the third quarter and, looking
                                                         number of people employed in Cape
ahead to the fourth quarter, improved further to 40
                                                         Town increased by 19 976 to a total of
index points. This implies that many respondents are
                                                         1,42 million. On a year-on-year basis,
still unsatisfied with prevailing business conditions;
                                                         however, this figure decreased by 189 825
however, conditions are improving. Electricity
                                                         individuals. The main contributor to
consumption by large power users (a measure of
                                                         quarter-on-quarter employment growth
manufacturing sector output) remained fairly flat in
                                                         during the period was the finance sector,
quarter 3 and this trend is likely to continue due to
                                                         which added 19 635 jobs, followed by
intermittent load-shedding.
                                                         the construction sector with 15 363 jobs.
The ability of businesses to respond to the Covid-19     Trade, hotels and restaurants shed the
pandemic and its associated restrictions will            most jobs (-31 486) quarter-on-quarter,
determine the type of recovery in 2021 and beyond.       followed by agriculture (-11 092).
Recent interviews with the e-commerce sector in
                                                         All of Cape Town’s top five tourist
Cape Town show how some innovative businesses are
                                                         attractions resumed operations in the
prospering despite the challenging economic climate.
                                                         third quarter of 2020, however, these all
In these trying times, it is important to recognise      recorded year-on-year declines in visitor
the sacrifices that have been made by firms in Cape      numbers ranging between 61% and 99%.
Town that are struggling to remain afloat, especially
                                                         Air passenger movements continue to
those in the tourism, agriculture, construction and
                                                         improve on a quarter-on-quarter basis,
manufacturing sectors. Although some companies
                                                         thanks mainly to domestic travellers. In
have been able to adjust to the ‘new normal’ or find
                                                         the third quarter of 2020, Cape Town
opportunities in the crisis, many others will need
                                                         International recorded 322 929 more
continued support and co-ordinated interventions
                                                         passenger movements compared to
to survive the deepest recession in living memory.
                                                         the previous quarter.
The task ahead for the City of Cape Town, and
indeed all cities, is to find ways to support broad
and sustainable economic growth and job creation.

Jodie Posen
Senior Economist: Economic Analysis

                                                                                                8
01
EPIC 2020: Q3

9
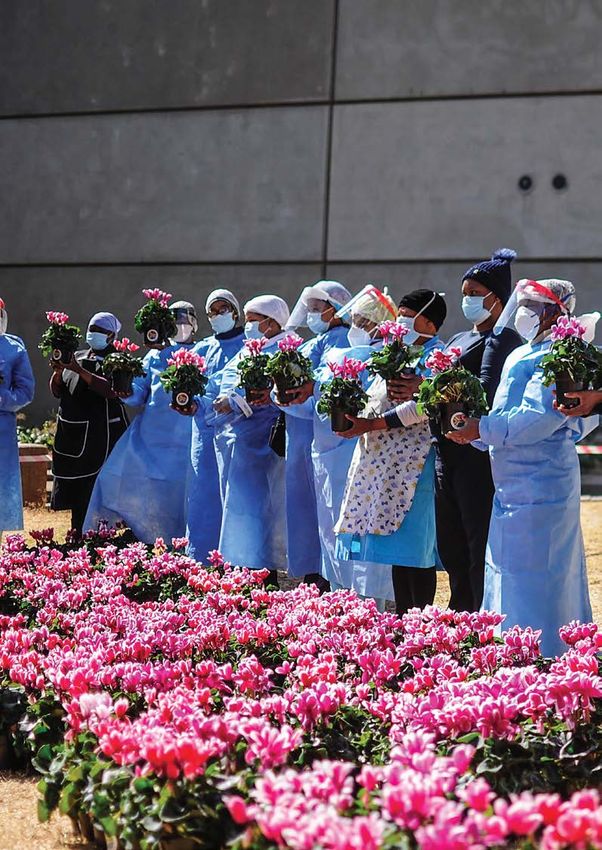
SUCCESS

10
     STORIES
EPIC 2020: Q3
While Kim was self-isolating with her husband and
two children (aged four and seven) in Tulbagh,
HOSPITALITY she was on a Zoom call with a medical doctor in
Lombardy, Italy, which was under tremendous
ENTREPRENEUR pressure and healthcare workers were suffering
from burnout and exhaustion. At that stage Kim
CREATES A wasn’t just thinking about herself and her family,
but about the challenges the tourism industry and
HAVEN FOR her colleagues throughout the country were facing
HEALTHCARE
as well. Everyone was anxious and uncertain about
the future. She also considered the pressure our
WORKERS
healthcare system and healthcare workers were
under. This concern for others sparked an idea for
IN NEED. a new business venture which inspired the creation
of the Ubuntu Beds platform.
Saving South Africa, one free bed at a time
Ubuntu Beds is a digital accommodation platform
for healthcare workers who live far away from home,
want to protect their families while serving their
communities, or have contracted Covid-19 but
are not sick enough to need hospital admittance.
The platform matches healthcare workers with
guest houses, hotels and rental properties located
near their workplace. They provide them with
a place to rest, free of charge, made possible
through donations and sponsors. Covid-19
positive healthcare workers are offered three
nutritious meals a day, as well as transport and
hygiene cleaning for the venue. This supports small
businesses in hospitality, food industries, transport
and hygiene who are all reeling after the collapse of
Kim Whitaker, founder of Ubuntu Beds the tourism industry.
When Kim first shared the wonderful idea on
CapeTalk in March, the spirit of ubuntu spread like
Kim Whitaker, a hospitality entrepreneur, gives wildfire and she received initial donations from
back to frontline healthcare workers risking their FirstRand Bank and Booking.com, as well as smaller
lives during the Covid-19 pandemic to save others companies, individuals and even golfing four-balls
in the spirit of ubuntu. to start the new venture. The most common amount
pledged is only R100, but it goes a long way! The
The pandemic has seen a rainstorm of hard times average cost per night per healthcare worker is
and bad news pouring down on us. People have around R300. Ordinary people volunteered their
been losing their livelihoods, loved ones and skills to help make the idea of a resting place for
their sense of normality. Kim Whitaker contracted frontline heroes come to fruition.
Covid-19 in early March after returning from a
business trip in Germany. A few months later Today, 1 824 healthcare workers and 1 128
her 89-year-old grandmother succumbed to the hospitality providers have signed up on the
virus. Due to her coronavirus antibodies, Kim was platform. A total of 25 991 bed nights are organised
fortunate enough to get the opportunity to say for the workers. In Cape Town, Ubuntu Beds has
goodbye to her grandmother at an old age home in placed healthcare workers from Groote Schuur Level
Cape Town, something few family members are able 3 Hospital (97), Somerset Hospital (31), Victoria
to do during this time. Hospital (26), Life Kingsbury Private Hospital (26),
11SUCCESS STORIES
Christiaan Barnard Memorial Private Hospital (20), as
well as Mitchells Plain Hospital, Life Vincent Pallotti
Private Hospital, Tygerberg Hospital, Red Cross War
Memorial Children’s Hospital, CTICC Hospital of
Hope and Brackengate Hospital.
While the platform remains active through the
second wave, and into the third and further waves,
the Ubuntu Beds team have collaborated with other
non-profits to help find safe spaces for people in
natural or humanitarian disasters. To date, they
have assisted in a case of gender-based violence,
and a devastating fire in Guguletu which saw 10
families displaced and placed in a guesthouse for a
week while the structures were being rebuilt.
“My biggest concern was my cousin’s
husband. He had been diagnosed with
pancreatic cancer. It was even more
devastating to cope with, as I am a radiation
therapist.
My family tried to have supper together
every night, but unfortunately I had to have
limited contact with him because of my work
at the hospital. I was very stressed as I knew
his time was limited, and so was my time
visiting him.
When he passed on, it hit our whole family
quite hard.
I was allowed to attend part of the funeral
and as soon as I informed Ubuntu Beds,
they immediately started working on
accommodation for me as I had to be
booked in the same day. In the end, I was in a
lovely apartment close to work. It was comfy,
safe and very cosy. I am so thankful towards
them for arranging accommodation for me at
such short notice. The way they spoke to me
and cared about me, was beyond words. I
truly felt appreciated a a healthcare hero and
will forever be grateful.”
Ubuntu Beds and Together we Bloom honour Nurse Nazeefah
healthcare workers Radiation therapist, Cape Town
HELP HEROES SAVE LIVES.
To become a donor or sponsor from as little as R100, visit https://www.ubuntubeds.org.
You can also contribute by using SnapScan, FNB eBucks or a Woolworths MySchool card.
All the funds received go towards helping healthcare heroes find a place to rest, recharge
and rejuvenate, giving them peace of mind, so they can continue to save lives through the
next possibles waves of Covid-19 infections.
12EPIC 2020: Q3
Witnessing the devastation that lockdown was
wreaking on the South African dining industry,
THE
Alex Dale, founder and MD of Radford Dale winery,
teamed up with Matt Manning, chef patron of
RESTAURANT Grub & Vine Restaurant, to do something about it.
RESCUE
PROJECT HELPS “What Dale proposed was a
gesture so generous and heartfelt
CAPE TOWN’S that I had to blame the onions
EATERIES I was not busy dicing for my
rapidly reddening eyes.”
SURVIVE. Matt Manning
Between them, the two came up with the innovative
Restaurant Rescue Project, an independent,
industry-driven initiative that would help to keep
the restaurant and wine farm industries afloat,
saving the jobs of many thousands of employees
who rely on it for their livelihood.
To get things started, Radford Dale winery
generously donated some of their finest wines
to Grub & Vine Restaurant, which allowed them
to offer an amazing deal. Guests could purchase
a Grub & Vine gift voucher or virtual dining
experience for two and receive a complimentary
case of six exceptional Radford Dale wines which
could be collected from the bistro as soon as
alcohol sales resumed.
The initiative proved a huge hit and gave rise to
a steady flow of similar collaborations between
restaurants and wine farmers, all facilitated via the
Restaurant Rescue website.
The initiative, which had continued throughout the
subsequent lockdown phases, called on wineries
and businesses to ‘adopt a restaurant’ to help
preserve the jobs and livelihoods of the sector. Each
participating restaurant then curated a gastronomic
When it comes to exceptional gastronomic experience that guests could purchase as a voucher,
experiences, Cape Town’s many eateries are most of which also included a case of six bottles of
among the best in the world. From small dining wine from the partner winery.
boutiques to award-winning restaurants, the
Mother City is known for her culinary culture. Restaurants and wineries had joined the initiative
However, this thriving industry was the first to be from all corners of the Mother City with the likes of
brought to its knees when the Covid-19 pandemic Blockhouse, The Aubergine Restaurant, Pot Luck
reached South Africa and national government Club and The Test Kitchen, to name just a few of the
responded with the hard lockdown. city’s most well-known and revered eateries.
13SUCCESS STORIES
Matt Manning and the Grub & Vine team
The success of the initiative is a testament
to the city’s resilient people and businesses,
and showcases the never-say-die spirit that
characterises not only Cape Town’s communities,
but patrons from across the world with “restaurant
adopters” hailing from the UK, USA, Germany and
many more countries. An estimated 750-plus direct
jobs have been preserved thanks to the Restaurant
Rescue Project, and thanks to the dedication of
the global community of food and wine lovers.
In supporting Cape Town’s treasured eating
destinations, over R5 million has been generated
through the sale of the vouchers – which has directly
helped many Cape Town eateries stay in business
through this difficult period.
While the Restaurant Rescue Project is no longer
active, this initiative has created a tangible impact
within the hospitality sector and the restaurant
industry. With restaurants and wineries reopened Alex Dale, founder and managing director
and operating safely, Capetonians can continue to of Radford Dale
show support in person.
1402
OVERVIEW

16
EPIC 2020: Q3

CAPE TOWN OVERVIEW
2020: QUARTER 3

    GROSS DOMESTIC                     R2,96 trillion
                                                                  CAPE TOWN GROSS GEOGRAPHIC
    PRODUCT (GDP)                         South Africa
                                                                  PRODUCT AND EMPLOYMENT
    The Western Cape                                              CONTRIBUTIONS TO SA, 2019e
    accounted for R408 billion a
    of the R2,96 trillion gross                                                                100%

    domestic product (GDP)
    generated by South Africa
    in the third quarter of 2020.
    While GDP data are not
    available at a city level
    on a quarterly basis,
                                                                            48,6%                                42,7%
    Cape Town typically
    contributes around                                                                         75%
                                       R408 billion
    72% of the provincial
                                         Western Cape
    GDP annually.b

a
    At constant 2010 prices; seasonally adjusted
    and annualised. Source: Quantec, 2020.
b
    Source: IHS Markit, 2020.

                                                                                               50%
    GDP GROWTH RATE                                                                                              10,1%
                                                                             7,9%
    During the third quarter
    of 2020, the Western
                                       57,7%       66,1%
    Cape achieved quarter-
    on-quarter GDP growth
                                                                            13,0%                                15,0%
    of 57,7%, compared to
    national GDP growth               Western      South
                                       Cape        Africa                                      25%
    of 66,1%.c
                                                                             7,7%                                 6,9%
c
    At constant 2010 prices; seasonally adjusted
    and annualised. Source: Quantec, 2020.                                   7,5%                                 9,5%

    GDP PER CAPITA                                                          10,2%                                 9,6%
                                                                          Cape Town                             Cape Town
    In 2019, South Africa
                                                                                                0%
    had a GDP per capita
                                                                          Employment                                GDP
    of R86 083, while the                                             (formal and informal)                   (current prices)
    Western Cape’s GDP per
    capita was R101 098                                                Rest of SA		      Buffalo City           Mangaung
                                                                       Tshwane		         Nelson Mandela Bay     Johannesburg
    and Cape Town’s was             South Western        Cape          Ekurhuleni		      eThekwini              Cape Town
    R111 364 .d                     Africa Cape          Town

d
    At current prices. Source: IHS Markit, 2020.                 At current prices. Source: IHS Markit, 2020.
                                                                e

17
OVERVIEW
SECTORAL SHARES, CAPE TOWN GROSS VALUE ADDED (GVA) VERSUS NATIONAL
GVA, 2019 f
SA GVA 2,1%
Agriculture and fishing
0,8%
Ca p e To w n GVA
8,3%
Mining
0,2%
13,2%
Manufacturing
14,6%
3,8%
Electricity
2,4%
3,8%
Construction
4,6%
15,1%
Trade
17,9%
9,8%
Transport
11,6%
19,7%
Finance and other business
29,4%
24,1%
Community services
18,5%
0% 10% 20% 30%
f
At current prices. Source: IHS Markit, 2020.
INFLATION POPULATION
At the end of the third South Africa has a population
quarter of 2020, South of 58 775 022. A total of
3% 3,6%
Africa had an inflation rate 6 844 272 people (11,6%
of 3%. The Western Cape’s of the national population)
inflation rate for the same live in the Western Cape.
period was 3,6%.g South Western Of those, 4 488 546 are
Africa Cape
residents of Cape Town.h
g
Source: Statistics South Africa (StatsSA), 2020. h
Source: City of Cape Town, 2020a.
GINI COEFFICIENT
In 2019, South Africa had a Gini coefficient* of 0,63, South Cape
Africa 0,63 0,62 Town
while Cape Town had a slightly lower value of 0,62.i
* T he Gini coefficient measures inequality in levels of income.
i
Source: Wesgro, 2020.
FOREIGN DIRECT INVESTMENT (FDI) INFLOWS INTO CAPE TOWN j
3 000 3 000
Number of jobs
2 500 2 500
2 000 2 000
R million
1 500 1 500
1 000 1 000
500 500
0 0
2008 2009 2010 2011 2012 2013 2014 2015 2016 2017 2018 2019 2020
Capex Jobs created
j
FDI Markets, 2020. Note: Investment data are subject to change due to reporting lags.
18EPIC 2020: Q3
LABOUR OVERVIEW
2020: QUARTER 3
LABOUR INDICATORS, 2020 Q3 (QUARTER-ON-QUARTER CHANGES)
Working-age population:
3 021 552
Broad labour force:
2 000 541
Employed: Informally employed:
1 418 157 151 652
Searching unemployed:
425 385
Discouraged and other non-searching unemployed:
157 000
Increase Decrease Improvement Deterioration
Labour force participation rate (strict) = 61,0% Absorption rate = 49,9% Dependency ratio = 43,7%
Source: Statistics South Africa, Quarterly Labour Force Survey, 2020 Quarter 3, November 2020.
STRICT VERSUS BROAD UNEMPLOYMENT RATES FOR
SOUTH AFRICA AND CAPE TOWN, 2013 Q1 TO 2020 Q3
45%
40%
35%
30%
25%
20%
15%
Q1 Q2 Q3 Q4 Q1 Q2 Q3 Q4 Q1 Q2 Q3 Q4 Q1 Q2 Q3 Q4 Q1 Q2 Q3 Q4 Q1 Q2 Q3 Q4 Q1 Q2 Q3 Q4 Q1 Q2 Q3
2013 2014 2015 2016 2017 2018 2019 2020
Cape Town broad Cape Town strict South Africa broad South Africa strict
Source: Statistics South Africa, Quarterly Labour Force Survey, 2020 Quarter 3, November 2020.
19OVERVIEW
2003 EPIC 2020: Q3 21
ECONOMIC
  GROWTH
 Gross domestic product (GDP)
 growth is one of the most widely
 used measures of economic
 performance in a country or
 region. It provides an indication
 of the level of value-added
 production that takes place in
 an economy during a specific
 period. Large cities such as
 Cape Town are typically the loci
 of economic production, and are
 therefore often the main drivers
 of economic growth in a region.

                                22
EPIC 2020: Q3
SOUTH AFRICA’S QUARTER-ON-QUARTER
ECONOMIC PERFORMANCE
Following its record contraction of 51,7%1 quarter- After declining to a record low of 5 index points in the
on-quarter for the second quarter of 2020 (which was previous quarter, this index rebounded to 24 index
revised downward by 0,7 of a percentage point), the points in the third quarter of 2020 (Bureau for Economic
South African economy rebounded in the third quarter Research [BER], 2020a). The BER cautions, however, that
with annualised growth of 66,1% quarter-on-quarter, despite the positive gains from the previous quarter’s
thus exiting its four-quarter long recession. Given that low base, “sentiment remains heavily depressed” as the
the second quarter’s performance is attributed to the majority of business executives surveyed view prevailing
impact of the Covid-19 lockdown restrictions (spanning business conditions as “unsatisfactory”.
levels 5 to 3), a large output recovery in the third quarter
was expected as the country experienced continued Similarly, the Absa Purchasing Manager’s Index (PMI)
easing of the lockdown restrictions during this period, recorded improvements throughout the third quarter of
which allowed for economic activity to resume, including 2020. From its 53,9 index points in June 2020, the PMI
leisure- and tourism-related activities (South African dropped slightly to 51,2 in July, thereafter increasing
Government, 2020a). to 57,3 index points in August and 58,3 index points in
September 2020. Despite the improvement in the overall
The primary drivers of the third quarter growth were the index, caution is once again advised. The BER explains
manufacturing, trade and mining sectors, which added that the index compares month-on-month conditions and,
the most to the national total growth rate, totalling 46,2 thus, an index recording that looks to have returned to
percentage points. pre-lockdown levels does not necessarily translate into
a full recovery in real manufacturing output. Rather, the
Notwithstanding the seemingly positive quarter-on- improvement in the index merely reflects an improvement
quarter GDP figures, the enduringly weak economic in business conditions in comparison to the prior month
climate is highlighted by additional market indicators (BER, 2020b).
such as the RMB/BER Business Confidence Index.
1
Unless otherwise stated, quarter-on-quarter growth rates are seasonally adjusted and annualised.
23ECONOMIC GROWTH
A GLOBAL COMPARISON OF ECONOMIC
PERFORMANCE IN THE THIRD QUARTER
According to the International Monetary Fund is expected to be slow and “remains prone to setbacks”.
(IMF, 2020a), the so-called ‘Great Lockdown’ – an The IMF has, however, upwardly revised its global growth
unprecedented global response to the Covid-19 forecast for 2020 to -4,4% (up by 0,5 of a percentage
pandemic – triggered the worst recession since the Great point). South Africa’s recent economic performance is not
Depression. In its latest World Economic Outlook (IMF, unique in the global context, as shown in Figure 1, with
2020b), the IMF notes that while some economies have many countries posting record annualised quarter-on-
slowly begun reopening, others have reinstated various quarter declines in the second quarter of 2020, followed
lockdown restrictions as the pandemic continues to pose by record increases in the third quarter.
a risk. Global economic recovery to pre-pandemic levels
FIGURE 1: BUREAU OF ECONOMIC RESEARCH’S COMPARISON
OF ANNUALISED ECONOMIC GROWTH RATES FOR 2020 Q3
125
100
66,1
Quarter-on-quarter % change (annualised)
75
50
25
0
-25
-50
-51,7
-75
United China South United
Japan Russia Brazil Germany Turkey Mexico India
States (Q1 & Q2) Africa Kingdom
2020 Q2 2020 Q3
Source: BER, 2020c.
Among developed economies, the United Kingdom In 2021, global growth is projected to be 5,2%, leaving
recorded one of the worst declines in economic growth 2021 GDP some 1,8 percentage points lower than in pre-
ever in the second quarter of 2020, but also recorded Covid-19 projections (IMF, 2020c), with an output loss of
one of the highest rebounds in the third quarter. Among more than USD12 trillion.
developing countries, India experienced a similar pattern
of precipitous decline, followed by an even larger
rebound. As Figure 1 illustrates, these countries’ second
quarter contractions ranged between -25% and -75%,
followed by growth in the third quarter ranging between
25% and over 100% (BER, 2020c).
24EPIC 2020: Q3
WESTERN CAPE AND CAPE TOWN
ECONOMIC PERFORMANCE
The Western Cape economy contributes around 14% of South Africa experienced negative year-on-year growth
South Africa’s gross domestic product (GDP). In line with for the fourth consecutive quarter, recording -6,1% in the
the national economy’s performance, the Western Cape’s third quarter of 2020, while the Western Cape economy
GDP grew by 57,7%, quarter-on-quarter for the third recorded its second negative year-on-year growth figure
quarter of 2020, rebounding from its contraction of 51,2% of -6,7%, reaffirming that, despite the positive quarter-on-
(which was revised downward by 1,1 percentage points) quarter annualised growth recorded in the third quarter
in the previous quarter. Alongside the historic quarter- of 2020, economic activity remains under strain.
on-quarter results, the year-on-year data for the Western
Cape also indicate a similar performance to that of the
country as a whole.
FIGURE 2: REAL GGP GROWTH FOR THE WESTERN CAPE, 2008 Q1 TO 2020 Q3
80%
60%
40%
20%
0%
-20%
-40%
-60%
Q2
Q2
Q2
Q2
Q2
Q2
Q2
Q2
Q2
Q2
Q2
Q2
Q2
Q3
Q3
Q3
Q3
Q3
Q3
Q3
Q3
Q3
Q3
Q3
Q3
Q3
Q4
Q4
Q4
Q4
Q4
Q4
Q4
Q4
Q4
Q4
Q4
Q4
Q1
Q1
Q1
Q1
Q1
Q1
Q1
Q1
Q1
Q1
Q1
Q1
Q1
2008 2009 2010 2011 2012 2013 2014 2015 2016 2017 2018 2019 2020
Quarter-on-quarter Year-on-year
Source: Quantec, 2020.
As restrictions were applied nationally, the Western 14,7 percentage points to total growth. Despite the
Cape’s sectoral performance, on a quarter-on-quarter mining sector recording quarter-on-quarter growth
basis, showed many similarities to that of the national of 129,9% in the third quarter of 2020, its small
economy. Notably, the top three growth sectors were share (0,2%) of the provincial economy meant it only
the same as at a national level. At the provincial level, added 0,2 of a percentage point to total growth.
the manufacturing sector recorded the highest growth The sector constitutes a much greater share of the
at 235,4% quarter-on-quarter and contributed the most national economy (8,1%) and, as such, its performance
(20,9 percentage points) to total growth. The trade had a much larger impact on national GDP growth
sector grew by 123,3% quarter-on-quarter, adding (contributing 11,8 percentage points).
25ECONOMIC GROWTH
FIGURE 3: SECTORAL REAL GDP-R GROWTH RATES IN
THE WESTERN CAPE AND SOUTH AFRICA, 2020 Q3
Agriculture, forestry 18,7
and fishing 18,5
Mining and 129,9
quarrying 288,3
Manufacturing 235,4
210,2
Electricity 47,3
and water 58,0
Construction 66,4
71,1
Wholesale and retail trade; 123,3
hotels and restaurants 137,0
Transport and 76,4
communication 79,3
Finance, real estate 16,7
and business services 16,5
Community, social and 39,1
other personal services 38,6
General government 0,9
services 0,9
0% 50% 100% 150% 200% 250% 300%
WC quarter-on-quarter % change SA quarter-on-quarter % change
Source: Quantec, 2020.
The most prominent contributors to total GDP (value) While quarterly GDP-R statistics for Cape Town are not
in the Western Cape are the finance, trade and timeously available for inclusion in this document, the
manufacturing sectors. These sectors contributed the performance of the metropolitan municipality’s economy
most to the province’s growth in the third quarter of can be expected to typically mirror that of the provincial
2020, adding a combined 42,2 percentage points to economy. This is because the city contributes around 72%
total growth. Of these, the manufacturing sector was of the total provincial economic output (IHS Markit, 2020).
the largest contributor, adding 20,9 percentage points, On average, in the last 10 years, the variation between the
reflecting the resumption of production activities city’s gross geographic product (GGP) growth rate and
alongside the eased lockdown restrictions. The transport the provincial rate has been 0,2 of a percentage point. If
sector was the fourth largest contributor to total this holds true for the third quarter of 2020, a plausible
provincial growth (6,4 percentage points), reflecting range for Cape Town’s quarter-on-quarter economic
greater mobility, inclusive of the economy’s labour force. growth in the third quarter would be between 57,5%
The agriculture sector, which historically has a greater and 57,9%. However, the nature of provincial economic
impact at the provincial level due to its higher share of growth is such that this range may not fully account
the economy (4,5% of the provincial economy compared for the performance of the city’s economy in these
to 2,9% of the national economy), remained fairly muted unprecedented times. Given that the manufacturing and
in its contribution2 (1,0 percentage point) to total growth trade sectors, amongst the top three contributors to
in the third quarter. This is attributable to exports, the province’s growth in the third quarter, contribute a
which continue to face constraints associated with trade considerable share (a combined 30,2%) to Cape Town’s
limitations across the world due to the impact of the GVA, the city’s economy may have experienced a more
pandemic. positive performance overall.
Similarly, the agriculture sector’s quarter-on-quarter growth for 2020 Q3 recorded a relatively low rate (18,7%) in comparison to other
2
sectors in the economy; this, however, is also impacted by its lower base, as well as not recording a contraction in 2020 Q2, as compared
to other sectors.
2604 EPIC 2020: Q3 27
INFLATION

  Price fluctuations of goods
  and services in an economy
  are measured by the
  consumer price index (CPI)
  inflation rate and producer
  price index (PPI) inflation
  rate. The CPI measures the
  change in the cost of living
  for households and the PPI
  measures the change in the
  cost of production.

                                 28
EPIC 2020: Q3
INFLATION OVERVIEW
At the end of the third quarter of 2020, the CPI increased to 2,5% in September 2020. The main inflationary
to 3,0% from 2,2% at the end of the second quarter. contributors to the PPI in September (in terms of final
As illustrated in figure 4, the CPI was 3,2% in July, manufactured products), were the prices of food
decreasing slightly to 3,1% in August and further to 3,0% products, beverages and tobacco products,
in September. Overall, the CPI moved within the inflation and transport equipment.
target range and hovered largely around the bottom of
the inflation target range of 3% for this quarter. Figure 4 illustrates changes in the repurchase rate (repo
rate). As indicated in the graph, the repo rate was cut
According to Statistics South Africa (2020), the main once during the third quarter of 2020, resulting in a total
contributors to the overall CPI inflation rate for September reduction of 300 basis points for 2020 thus far. According
2020 included food and non-alcoholic beverages, to the MPC statement of July 2020 (SARB, 2020b), the
housing and utilities, transport, and miscellaneous decision to lower the repo rate by 25 basis points during
goods and services. According to the Monetary Policy July (to reach 3,5%) was against a backdrop of low
Committee (MPC) statement of September 2020 (South inflation expectations, poor economic climate and weak
African Reserve Bank [SARB], 2020a), the overall inflation business confidence as a result of the continuous spread
outlook has decreased from a previous projection of 4,0% of Covid-19. Another key reason was to relieve financial
in 2021 and 4,4% in 2022 to 3,7% and 4,0%, respectively. constraints on households and businesses. This marks
The MPC noted that the economic contraction and the the lowest recording of the repo rate to date.
slow recovery will keep inflation below the mid-point
of the target range for the remainder of the year, while At its September 2020 meeting, the MPC decided to
risks to the overall inflation outlook remain balanced keep the repo rate unchanged at 3,5%. According to the
(at the time). Also adding downward pressure to overall MPC statement of September (SARB, 2020a), the easing
inflation are low oil prices, contained food prices and of lockdown regulations has facilitated and supported
the depreciation of the rand. economic recovery. This notion was supported by a
pick-up in economic activity in certain indicators from
For the third quarter of 2020, the PPI increased to an previous low levels of activity in April and May 2020.
average of 2,3% after averaging a low of 0,7% in the The slight improvement in economic activity, low inflation
previous quarter. The index recorded a monthly reading expectations and depreciation of the rand were key
of 1,9% in July, increasing to 2,4% in August, and further reasons for the MPC’s decision.
FIGURE 4: CPI AND PPI TRENDS FOR SOUTH AFRICA, JANUARY 2015 TO OCTOBER 2020
9%
8%
7%
6%
5%
4%
3%
2%
1%
0%
Q1 Q2 Q3 Q4 Q1 Q2 Q3 Q4 Q1 Q2 Q3 Q4 Q1 Q2 Q3 Q4 Q1 Q2 Q3 Q4 Q1 Q2 Q3 Q4
2015 2016 2017 2018 2019 2020
Repo rate PPI CPI Reserve Bank inflation target range
Source: CPI and PPI extracted from Statistics South Africa, 2020; repo rate extracted from SARB, 2020.
Note: 27 March to 20 September 2020 have been shaded above to highlight lockdown impacts, notably restriction levels 5 to 2 (inclusive).
Data extends beyond the third quarter of 2020 to include October.
29INFLATION
30EPIC 2020: Q3
GEOGRAPHICAL INFLATION
The Western Cape recorded an inflation rate of 3,6% inflationary increases. At the end of September, four
at the end of the third quarter of 2020. This was higher provinces moved to within the inflation target range,
than the 2,8% at the end of the preceding quarter. while the rest remained slightly below the inflation
The provincial inflation rate was also higher than the target range of 3%. The Western Cape recorded the
national rate of 3,0%. Figure 5 illustrates inflation rates highest inflation rate for the third quarter, with an
recorded in the third quarter of 2020 across all nine average of 3,7%, followed by the Eastern Cape (3,2%)
provinces of the country. In comparison to the end of the and Northern Cape (3,1%). Gauteng (2,7%) recorded the
second quarter of 2020, all nine provinces experienced lowest average inflation rate in the third quarter of 2020.
FIGURE 5: CPI INFLATION RATE AT A PROVINCIAL LEVEL, JULY TO SEPTEMBER 2020
7%
6%
5%
4%
3%
2%
1%
0%
South Western Eastern Northern Free State KwaZulu- North West Gauteng Mpumalanga Limpopo
Africa Cape Cape Cape Natal
July 2020 August 2020 September 2020 Reserve Bank Inflation Target
Source: Statistics South Africa, December 2020.
31INFLATION
The higher overall provincial inflation rate, compared to [its sub-category of] alcoholic beverages price inflation
the national level, for the third quarter of 2020 can largely (4,5% and 2,7% respectively) being the key driver for the
be attributed to restaurant and hotel price inflation, province in September 2020. Housing and utilities price
which was recorded at 3,0% for the Western Cape and inflation also recorded higher figures at the provincial
-0,4% nationally in September. Food and non-alcoholic level (3,3% in September) compared to nationally (2,9%
beverages price inflation was higher at a provincial level in September).
(5,1% in September) compared to nationally (3,6% in As indicated in Figure 6, the education and the
September) with [its sub-category of] food price inflation miscellaneous goods and services categories recorded
being the main driver for the province (5,5% compared relatively high inflation rates throughout the third
to 3,9% nationally in September). A notable difference quarter for both the Western Cape (average of 6,9%
between the Western Cape and South Africa was and 7,5% respectively) and South Africa (6,3% and 6,5%
also recorded in alcoholic beverages and tobacco respectively), and were the only categories to record
price inflation (5,6% and 3,9% respectively), with inflation rates above the target range.
FIGURE 6: AVERAGE CONSUMER PRICE INFLATION FOR
THE WESTERN CAPE AND SOUTH AFRICA, 2020 Q3
8
7
Consumer Price Inflation (%)
6
5
4
3
2
1
0
-1
Food Alcoholic Clothing Housing Household Health Transport Communi- Recreation Education Restaurants Miscel-
and non- beverages and and contents cation and and hotels laneous
alcoholic and tobacco footwear utilities and culture goods and
beverages equipment services
South Africa Western Cape Reserve Bank Inflation Target
Source: Statistics South Africa, December 2020.
32EPIC 2020: Q3
WESTERN CAPE FOOD INFLATION
In light of Covid-19, tracking and monitoring food price the third quarter of 2020 compared to 3,1% in the same
changes have become significant as millions of South period in 2019. The food items that demonstrated the
Africans are experiencing job losses and salary cuts, highest average inflation rates in the third quarter of 2020
which further threaten their access to food. Figure 7 were: fruit (36,9%); sugar, sweets and desserts (9,4%), and
tracks food price inflation in the Western Cape, which has oils and fats (8,7%), while vegetables recorded the lowest
been displaying an upward trend since the beginning of inflation rate (2,1%) for the quarter.
2020. Food price inflation recorded an average of 5,3% in
FIGURE 7: WESTERN CAPE FOOD PRICE INFLATION, 2019 Q1 TO 2020 Q3
40,0 6,0
35,0
5,0
30,0
Inflation rate for food item (%)
Total food inflation rate (%)
25,0 4,0
20,0
3,0
15,0
10,0 2,0
5,0
1,0
0
-5,0 0,0
Q1 Q2 Q3 Q4 Q1 Q2 Q3
2019 2020
Bread and cereals Meat Fish Milk, eggs and cheese Oils and fats
Fruit Vegetables Sugar, sweets and desserts Other food Total food
Source: Statistics South Africa, 2020.
A study by the Pietermaritzburg Economic Justice and food basket4 is more expensive in Cape Town compared
Dignity group (PMBEJD, 2020), which tracks a new food to other major metropolitan areas such as Johannesburg
basket in five metropolitan areas, 3 seeks to provide and Durban. The cost of the core food basket in October
insight into South Africa’s household affordability and 2020 for Cape Town was R2 181,44 while Johannesburg
food prices, with a particular focus on low-income reported a cost of R2 116,59 and Durban stood at
households. The data reveal that the cost of the core R2 058,78.
The research paper tracked prices for the areas of Johannesburg (Soweto, Alexandra, Tembisa and Hillbrow), Durban (eThekwini,
3
KwaMashu, Umlazi, Isipingo, Durban CBD, and Mtubatuba), Cape Town (Gugulethu, Philippi, Khayelitsha, Delft, Dunoon),
Pietermaritzburg and Springbok.
The core food basket of this PMBEJD study is based on their original methodology applied to Pietermaritzburg and based on the
4
respondents’ input of what “constitutes a good proxy for the typical core foods and volumes of these foods in the trollies
of low-income households, given affordability constraints”.
33INFLATION
Table 1 shows the prices of the core food items tracked Amidst the job losses and pay cuts as a result of the
in Cape Town supermarkets and butcheries located in global pandemic and the resultant lockdown, increased
Khayelitsha, Gugulethu, Philippi, Delft and Dunoon. food prices exert further pressure on household income,
The total cost of the core foods in Cape Town increased especially that of low-income households. This poses a
by 1,0% from the R2 159,11 recorded in September to
threat to their access to food, leading to a deepening of
R2 182,43 in October 2020. This increase can largely be
the country’s food crisis and poverty levels. Food prices
attributed to the rise in the price of potatoes from R73,10
to R87,80 – an increase of 20,1%. Furthermore, the cost are expected to escalate further over the festive season
of the core foods constituted 56% of the cost of the total and, coupled with increases in fuel, transport fares and
household food basket of R3 920,86, which tracks a total electricity tariffs, this will further worsen the household
of 44 food items. food affordability crisis (BusinessTech, 2020).
TABLE 1: COST OF CORE FOODS IN THE HOUSEHOLD FOOD BASKET,
SEPTEMBER TO OCTOBER 2020
PRICE (RANDS) MONTH-
FOOD ITEM QUANTITY TRACKED ON-MONTH
September October CHANGE (%)
Maize meal 30 kg R244,97 R240,61 -1,8%
Rice 10 kg R143,66 R146,99 2,3%
Cake flour 10 kg R92,88 R94,89 2,2%
White sugar 10 kg R160,21 R159,21 -0,6%
Sugar beans 5 kg R124,56 R124,07 -0,4%
Samp 5 kg R43,99 R43,49 -1,1%
Cooking oil 5 litres R106,12 R110,12 3,8%
Salt 1 kg R6,42 R6,65 3,6%
Potatoes 10 kg R73,10 R87,80 20,1%
Onions 10 kg R75,22 R74,05 -1,6%
Frozen chicken portions 10 kg R306,65 R311,98 1,7%
Curry powder 200 g R29,82 R29,65 -0,6%
Stock cubes 24 cubes x 2 R38,87 R38,42 -1,2%
Soup 400 g x 2 R40,48 R40,18 -0,7%
Tea 250 g R24,05 R23,77 -1,2%
White bread 25 loaves R335,86 R333,11 -0,8%
Brown bread 25 loaves R312,25 R316,44 1,3%
Total R2 159,11 R2 181,43 1,0%
Source: Pietermaritzburg Economic Justice and Dignity Group (PMBEJD), 2020.
3405 EPIC 2020: Q3 35
LABOUR MARKET

   The labour market is the point
   at which economic production
   meets human development.
   As such, employment creation
   and unemployment reduction
   are top priorities for all spheres
   of government. Labour market
   performance is tracked through
   a variety of indicators, many of
   which are considered in this section.

                                   36
EPIC 2020: Q3
On 19 March 2020, Statistics South Africa’s (2020) face-to-face data collection was suspended as a result of the
Covid-19 pandemic. As a result, Statistics South Africa changed the mode of data collection for their Quarterly
Labour Force Survey (QLFS) to Computer Assisted Telephone Interviewing (CATI). To facilitate CATI, the same sample
that was used for the QLFS Q1: 2020 was also used for Q2 and Q3, 2020. However, the process was not without
challenges. Further details on the methodology can be reviewed in the official QLFS publication.
CAPE TOWN’S LABOUR MARKET PERFORMANCE
IN THE THIRD QUARTER OF 2020
Cape Town’s working age population (3,02 million) The number of discouraged work seekers increased on a
increased on both a quarter-on-quarter and year-on-year quarter-on-quarter (by 840) and year-on-year (by 10 198)
basis. The labour force increased on a quarter-on-quarter basis to a total of 31 302 individuals in the third quarter of
level and decreased on a year-on-year level to a total of 2020. This marks the highest recording for this category
1,84 million individuals. Employment recorded a slight since the start of the QLFS in 2008. The increase recorded
improvement on a quarter-on-quarter level (by 19 976), in discouraged work-seekers and in the (searching)
however, it decreased on a year-on-year level (by 189 825) unemployed in the third quarter resulted in an overall
recording a total of 1,42 million individuals. The increases increase in the broad unemployment rate to 29,1% from
noted in the working age population and in employment for 28,9% in the previous quarter. At 29,1%, Cape Town’s broad
this quarter meant that the labour absorption rate improved unemployment rate remained lower than any of the other
slightly to 46,9% from 46,5% in the previous quarter. metros in South Africa.
Likewise, the labour force participation rate increased from
57,2% to 61,0% in the third quarter of 2020. Both rates,
however, recorded decreases when compared to the third
quarter of 2019.
TABLE 2: CAPE TOWN LABOUR MARKET INDICATORS
QUARTER-
YEAR-ON-YEAR
RECORDED ON-QUARTER
CHANGE
METRO CHANGE
2020 Q3 2020 Q2 2019 Q3 (vs 2020 Q2) (vs 2019 Q3)
Working-age population 3 021 552 3 008 114 2 967 498 13 438 54 054
Labour force 1 843 541 1 720 324 2 060 642 123 217 -217 101
Employed: Total 1 418 157 1 398 181 1 607 982 19 976 -189 825
Employed: Formal sector 1 177 638 1 178 490 1 290 859 -852 -113 221
Employed: Informal sector 151 652 134 572 205 424 17 079 -53 773
Unemployed 425 385 322 143 452 660 103 241 -27 275
Not economically active 1 178 011 1 287 790 906 856 -109 780 271 155
Discouraged work seekers 31 302 30 463 21 104 840 10 198
Other not economically active 1 146 708 1 257 328 885 752 -110 619 260 956
Source: Statistics South Africa, Quarterly Labour Force Survey, 2020 Quarter 3, November 2020.
37You can also read