2020 Retail Study
New Braunfels, TX
←
→
Page content transcription
If your browser does not render page correctly, please read the page content below
2020 Retail Study New Braunfels, TX
2020 NBEDC Retail Study

Contents
Retail Industry Snapshot New Braunfels, TX .............................................................................................................. 1
   ABOUT NEW BRAUNFELS ......................................................................................................................................... 4
      People ................................................................................................................................................................... 4
      Educational Attainment ........................................................................................................................................ 5
      Income and Spending: .......................................................................................................................................... 6
      Labor Force .......................................................................................................................................................... 7
   RETAIL INDUSTRY SNAPSHOT .................................................................................................................................. 8
      Occupations Employed by this Industry ............................................................................................................... 8
      Regional Trends .................................................................................................................................................... 9
      Gross Regional Product ........................................................................................................................................ 9
      Industry Requirements ......................................................................................................................................... 9
      Sales Tax Receipts...............................................................................................................................................10
      Consumer Expenditures ...................................................................................................................................... 11
      Retail Potential .................................................................................................................................................... 13
Retail Real Estate Submarket Report Comal County ................................................................................................... 14
      Net Absorption, Net Deliveries & Vacancy ........................................................................................................... 15
      Market Rent Per Square Foot............................................................................................................................... 16
      Deliveries and Demolitions .................................................................................................................................. 17
      Past & Future Deliveries In Square Feet .............................................................................................................. 17
      Under Construction ............................................................................................................................................. 17
      Proposed ............................................................................................................................................................. 18
      Sale Comparable Locations ................................................................................................................................. 19
      Sale Comparables Summary Statistics................................................................................................................ 19
2019 Buxton Study New Braunfels, TX ........................................................................................................................ 20
   INTRO TO THE STUDY: ............................................................................................................................................. 21
      Study Parameters ................................................................................................................................................ 21
      Resulting data:.................................................................................................................................................... 22
      Study Areas of Interest ....................................................................................................................................... 22
   STUDY FINDINGS: ................................................................................................................................................... 23
      Overall household profiles (most dominant segments): ..................................................................................... 23

01/31/2020                                                           Page |2                                                www.NewBraunfelsEDC.com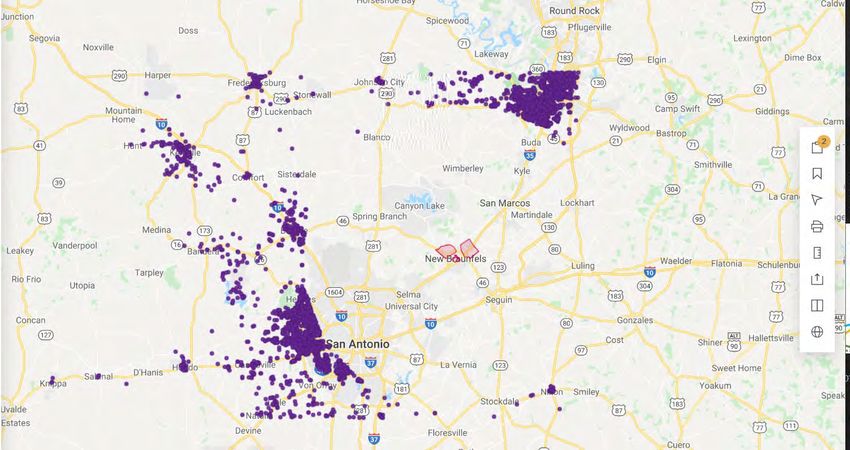
2020 NBEDC Retail Study

       Household distribution: ...................................................................................................................................... 23
       Core Consumers ................................................................................................................................................. 24
       Highly Represented Segments ........................................................................................................................... 26
       Segment Indices ................................................................................................................................................. 28
CREEKSIDE ................................................................................................................................................................. 30
       Creekside Visitor Analysis ................................................................................................................................... 31
       Creekside Retail Trade Area ............................................................................................................................... 32
       Retail Leakage and Surplus Analysis .................................................................................................................. 32
       Creekside Propensity.......................................................................................................................................... 33
       Creekside Daytime Population............................................................................................................................ 33
WESTPOINTE VILLAGE ............................................................................................................................................... 34
       Westpointe Village Visitor Analysis .................................................................................................................... 35
       WestPointe Village Retail Trade Area ................................................................................................................. 36
       Retail Leakage and Surplus Analysis .................................................................................................................. 36
       WestPointe Village Propensity............................................................................................................................ 37
       WestPointe Village Daytime Population.............................................................................................................. 37
DOWNTOWN NEW BRAUNFELS ................................................................................................................................. 38
       Downtown New Braunfels Visitor Analysis ......................................................................................................... 39
       Downtown New Braunfels Retail Trade Area ...................................................................................................... 40
       Retail Leakage and Surplus Analysis .................................................................................................................. 40
       Downtown New Braunfels Propensity ................................................................................................................. 41
       Downtown New Braunfels Daytime Population.................................................................................................... 41

01/31/2020                                                          Page |3                                               www.NewBraunfelsEDC.com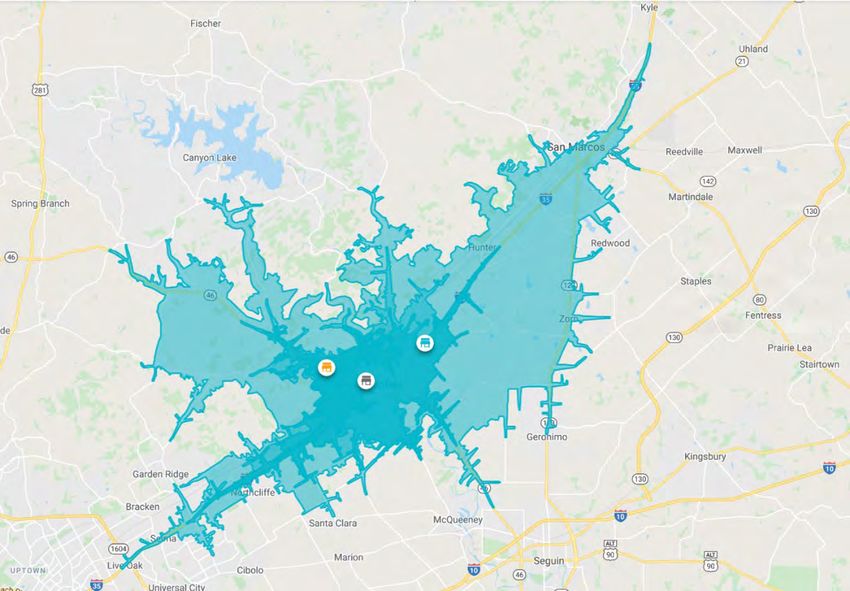
2020 NBEDC Retail Study

ABOUT NEW BRAUNFELS
  Communities like New Braunfels are unique. Refined by old-world German and Hispanic heritage and
  complemented by an affordable and unmatched quality of life, it’s no wonder we now rank as the second fastest
  growing community in the United States. New Braunfels also boasts exceptional transportation
  networks, multiple universities within a 30-minute drive, pro-business leadership, tax, and regulatory
  environment.

  New companies such as CBE, CGT, Calendar Holdings and PNC Bank have already realized the advantages of a
  growing, well-trained, 500,000-strong workforce within a 30-minute labor shed. These recent relocations have
  furthered our industry bases in manufacturing, healthcare, logistics and distribution and aviation businesses.
  Plus, with over 300 days of sunshine a year and 550+ acres of outdoor water recreation, New Braunfels is a
  premier destination for work and play - year round.

People
                     The total population of New Braunfels is 84,927. The median age is 35.78.

Source: AGS 2019

01/31/2020                                  Page |4                            www.NewBraunfelsEDC.com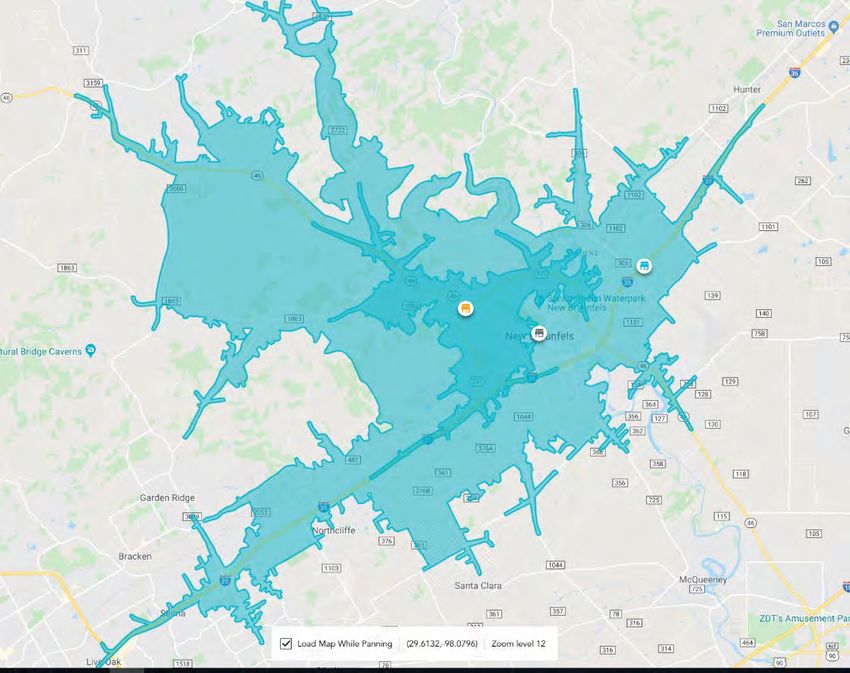
2020 NBEDC Retail Study

Educational Attainment

  Higher Education has grown in New Braunfels. In 2012, Howard Payne University opened a satellite campus and
  currently offer MBA classes to the community. In 2016, Wayland Baptist University relocated their entire School
  of Nursing to New Braunfels. By working closely with Alamo Colleges/CTTC, Howard Payne University, Texas
  Lutheran University and Wayland Baptist University New Braunfels is poised to deliver future diverse higher-
  education curriculum to meet the needs of the community. In addition to the local higher education facilities,
  more than 10 colleges and universities are within a 30-minute drive time.

  40.4% of the population in New Braunfels have an associate’s degree or higher and 90.1% have a high school
  degree or higher.

Source: AGS 2019

01/31/2020                                  Page |5                             www.NewBraunfelsEDC.com
2020 NBEDC Retail Study

Income and Spending:

  Households in New Braunfels earn a median yearly income of $70,478. The average Median Household
  Expenditure is $57,239, providing access to approximately $13,000 disposable income.

Source: AGS 2019

01/31/2020                                Page |6                          www.NewBraunfelsEDC.com
2020 NBEDC Retail Study

  Labor Force

  New Braunfels has a labor force of 43,918 people, with an unemployment rate of 3%.

Source: AGS 2019

01/31/2020                                 Page |7                            www.NewBraunfelsEDC.com
2020 NBEDC Retail Study

RETAIL INDUSTRY SNAPSHOT
New Braunfels area

Occupations Employed by this Industry

Source: EMSI 2020
01/31/2020                      Page |8   www.NewBraunfelsEDC.com
2020 NBEDC Retail Study

Regional Trends

Gross Regional Product

Industry Requirements

 Source: EMSI 2020
01/31/2020               Page |9   www.NewBraunfelsEDC.com
2020 NBEDC Retail Study

Sales Tax Receipts

Sales tax for New Braunfels continues to represent the single largest source of revenue to the General Fund,
totaling 30.7% of budgeted revenue. The retail portion of the sales tax (NAICS Code 44-45) show General
Merchandise Stores to be the largest generator of dollars and includes departments stores and big box retailers
such as Walmart, Target, Best Buy, etc.

   Category                                               2015                2016             2017               2018             2019
   (441) Motor Vehicle and Parts Dealers         $   738,289.94      $   807,062.76   $ 808,632.33      $   855,839.14    $   532,274.73
   (422) Furniture and Home Furnishings Stores   $ 1,133,804.86      $ 1,262,405.22   $ 1,276,512.71    $ 1,590,160.11    $ 1,183,521.43
   (433) Furniture and Home Furnishings Stores   $   485,932.45      $ 486,932.52     $ 524,810.55      $   519,698.49    $   767,126.04
   (444) Building material and garden supply
   stores                                        $   984,667.44      $   913,351.64   $ 747,831.43      $   578,411.32    $   561,509.66
   (446) Health and Personal Care Stores         $   208,932.78      $ 205,023.35     $ 202,039.34      $    198,756.13   $   194,640.37
   (447) Gasoline Stations                       $   468,092.63      $ 444,940.73     $ 456,775.67      $   482,903.52    $   686,744.44
   (448) Clothing and Clothing Accessories
   Stores.                                       $   507,913.54      $ 539,722.48     $ 657,905.90      $   776,325.81    $   785,244.78
   (451) Sporting Goods, Hobby, Musical
   Instrument, and Book Stores.                  $   249,096.91      $   272,056.18   $ 273,400.73      $   292,803.49    $   290,378.37
   (452) General Merchandise Stores              $ 2,490,200.21      $ 2,503,818.04   $ 2,611,138.39    $ 2,642,075.34    $ 2,745,023.53
   (453) Miscellaneous Store Retailer            $   601,527.16      $   651,997.43   $ 678,911.05      $   670,532.44    $   432,126.65
   (454) Nonstore Retailers                      $   265,418.12      $   309,179.66   $ 341,353.66      $   446,305.24    $   602,300.53
   Source: Texas Comptroller

01/31/2020                                            P a g e | 10                                www.NewBraunfelsEDC.com
2020 NBEDC Retail Study

Consumer Expenditures

According to a recent Buxton Group Mobile Analysis, the following retail sectors scored the highest with retail
leakage in New Braunfels.

Source: EMSI 2020

01/31/2020                                    P a g e | 11                        www.NewBraunfelsEDC.com
2020 NBEDC Retail Study

 Source: EMSI 2020
01/31/2020           P a g e | 12   www.NewBraunfelsEDC.com
2020 NBEDC Retail Study

Retail Potential
(sorted by most leakage by dollar amount)

                                                               $ per
             Category                                        household          Total 000s
             Gasoline Stations without Convenience Stores         $2,902                $92,856
             Full Service Restaurants                             $2,688               $85,994
             Warehouse Superstores                               $2,495                $79,835
             Mail Order and Catalog Stores                        $1,484               $47,478
             Department Stores                                    $1,004               $32,132
             Family Clothing Stores                                $500                 $15,999
             Other General Merchandise Stores                      $379                 $12,141
             Special Food Services and Catering                    $299                 $9,578
             Limited Service Restaurants                           $265                 $8,491
             Sporting Goods Stores                                 $252                 $8,070
             Pet and Pet Supply Stores                             $215                 $6,892
             Shoe Stores                                           $205                 $6,562
             Hotels and Other Travel Accommodations                 $189                $6,064
             Women's Clothing Stores                                $186                $5,980
             Fuel Dealers                                          $146                 $4,681
             Other Direct Selling Establishments                    $113                $3,634
             Jewelry Stores                                         $96                 $3,093
             Other Miscellaneous Retail Stores                      $93                 $3,000
             Book Stores                                            $90                 $2,893
             Drinking Places                                        $85                 $2,750
             Children and Infant Clothing Stores                     $81                $2,598
             Hobby, Toy, and Game Stores                            $73                 $2,338
             Gift and Souvenir Stores                               $63                 $2,033
             Other Apparel Stores                                   $60                 $1,948
             Other Health and Personal Care Stores                  $55                  $1,782
             Office and Stationary Stores                           $52                  $1,681
             Men's Clothing Stores                                  $43                  $1,381
             Vending Machines                                       $40                  $1,303
             Clothing Accessory Stores                              $40                  $1,281
             Used Merchandise Stores                                $36                  $1,164
             Mobile Home Dealers                                     $31                 $1,006

Source: EMSI 2020

01/31/2020                                    P a g e | 13                 www.NewBraunfelsEDC.com
2020 NBEDC Retail Study Retail Real Estate Submarket Report Comal County 01/31/2020 P a g e | 14 www.NewBraunfelsEDC.com
2020 NBEDC Retail Study

KEY INDICATORS

 12 Mo Deliveries in SF      12 Mo Net Absorption in SF                            Vacancy Rate                 12 Mo Rent Growth

     59.5 K                                  92.8 K                                   2.8%                            -1.9%
                                                                                                  et Absorption                    Under
     Current Quarter          RBA            Vacancy Rate         Market Rent vailability Rate                  Deliveries SF
                                                                                                      SF                        Construction

             Malls              0                    -                     -              -              0             0               0

        Power Center        1,032,904             0.8%                  $19.60                           0             0               0

                                                                                        2.7%

     Neighborhood Center    2,228,938             2.9%                  $18.40          4.1%             0             0           13,253

         Strip Center       429,708               5.7%                  $18.82          5.4%          (2,130)          0               0

        General Retail      5,037,706             2.7%                  $18.27          3.0%         (20,375)          0          216,500

             Other           192,190              11.1%                 $22.28          10.6%            0             0               0

         Submarket          8,921,446             2.8%                  $18.56          3.5%         (22,505)         0           229,753

                                               storical Average   recast Average
         Annual Trends          12 Month                                                Peak          When          Trough         When

     Vacancy Change (YOY)        -0.4%               5.2%           3.8%                13.3%        2006 Q3         2.5%         2019 Q2

       Net Absorption SF            92.8 K          240,287         99,410             743,880       2008 Q4       (205,725)      2006 Q3

         Deliveries SF              59.5 K          240,491         136,860            738,592       2008 Q3        53,154        2015 Q3

         Rent Growth                -1.9%            2.3%           1.8%                7.7%         2006 Q3        -2.8%         2020 Q1

         Sales Volume           $31.3 M              $1.2M               N/A            $7.6M        2017 Q2          $0          2019 Q4

 Net Absorption, Net Deliveries & Vacancy
 In 2019, PNC Bank announced plans to open a Customer Service Center in New Braunfels and occupy 60,000 sq.
 ft. of office space, thus absorbing a large amount of office space. Office Space Inventory has grown 154% since

01/31/2020                                               P a g e | 15                             www.NewBraunfelsEDC.com
2020 NBEDC Retail Study 2004. In 2018, the office space sector exceeded 1-million. More than 67% new office space was added in 2019 from 2011. Market Rent Per Square Foot 01/31/2020 P a g e | 16 www.NewBraunfelsEDC.com
2020 NBEDC Retail Study

Deliveries and Demolitions
                                                                                                               Past
&

Future Deliveries In Square Feet

Under Construction
     Property Name/Address     Rating       Bldg SF    Stories   Start      Complete   Developer/Owner

        3000 S Interstate 35                                                           HMT Engineering & Surveying Comal
                                                                                       County Texas
 1                                          200,000         -    Nov-2018   May-2020

        651 N IH-35                                                                    West Point Pepperell Wiggins
                                                                                       Commercial
 2                                          13,253          1    Jun-2019   Jun-2020

        17342 Lookout Rd                                                               -
 3                                          13,200          -    Oct-2018   Mar-2020   Penske Corporation

        Pad 1                                                                          -
 4      Rueckle Rd                          3,300           1    Nov-2019   Jul-2020   Renteria Bertha G & Antonio L

01/31/2020                              P a g e | 17                         www.NewBraunfelsEDC.com
2020 NBEDC Retail Study
Proposed
Property Name/Address Rating Bldg SF Stories Start Complete Developer/Owner
0 FM 306 -
1 230,000 - Jan-2020 Feb-2021 -
Singing Hills - Retail 6 -
2 Hwy 46 & US 281 162,165 1 Sep-2020 Jan-2022 SH-DJL Development, LLC
Singing Hills - Retail 7 REOC San Antonio
3 Hwy 46 & US 281 76,404 1 Jan-2020 Mar-2020 Mission City Management Inc
Alyssa Way Retail - Pad… -
4 2204 TX- 46 55,966 1 Feb-2020 Jul-2020 Dominion Advisory Group, Inc.
Freiheit Village Lot 2 - Gr… -
5 2259 Fm-1101 25,000 1 Jan-2020 Nov-2020 -
Singing Hills - Retail 1 (L… REOC San Antonio
6 Hwy 46 & US 281 18,080 1 Dec-2020 Dec-2021 SH-DJL Development, LLC
Build-to-Suit -
7 617 Gruene Rd 14,800 1 Apr-2020 Aug-2020 -
The Trees at Comal Creek -
8 105 N Walnut Ave 12,000 1 Jan-2020 Jun-2020 Comal Creek Retail LLC
Tract 28 -
9 Town Center Dr 11,200 1 Jan-2020 Jan-2021 NewQuest Properties
2 -
10 Loop 337 And Oak Run Pk… 9,015 1 Mar-2020 Dec-2020 -
1 -
11 Loop 337 And Oak Run Pk… 8,905 1 Mar-2020 Dec-2020 -
REST -
12 650 IH-35 North Fwy 7,400 1 Jan-2020 Dec-2020 Clearview Investments, Ltd.
Source: CoStar 2020
01/31/2020 P a g e | 18 www.NewBraunfelsEDC.com2020 NBEDC Retail Study
Sale Comparables Avg. Cap Rate Avg. Price/SF Avg. Vacancy At Sale
67 5.2% $242 6.2%
Sale Comparable Locations
Sale Comparables Summary Statistics
Sales Attributes Low Average Median High
Sale Price $299,000 $1,842,560 $836,823 $5,996,768
Price Per SF $52 $242 $262 $1,609
Cap Rate 4.9% 5.2% 5.2% 5.6%
Time Since Sale in Months 0.8 6.8 7.6 11.9
Property Attributes Low Average Median High
Building SF 22 5,719 3,150 33,264
Stories 1 1 1 3
Typical Floor SF 387 5,432 3,171 32,773
Vacancy Rate At Sale 0% 6.2% 0% 100%
Source: CoStar 2020
01/31/2020 P a g e | 19 www.NewBraunfelsEDC.com2020 NBEDC Retail Study
2019 Buxton Study
New Braunfels, TX
01/31/2020 P a g e | 20 www.NewBraunfelsEDC.com2020 NBEDC Retail Study
INTRO TO THE STUDY:
In early 2019, Buxton was contacted to accomplish a comprehensive retail study that utilized the most current
data collection practices. The contract included:
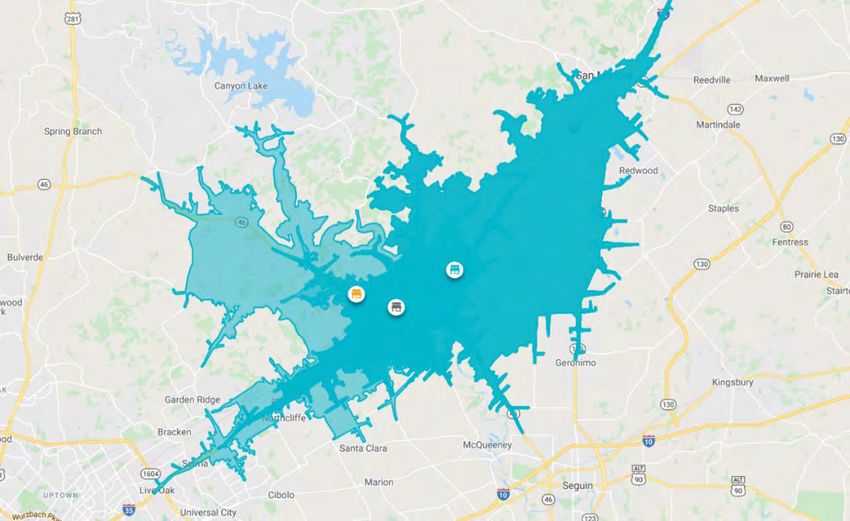
Mission: Buxton will develop the following analysis to determine the New Braunfels visitors:
• Capture mobile device IDs to identify visitors’ home locations
• Append Mosaic segmentation (consumer lifestyles) to create visitor profiles
• Identify the top metro areas that source visitors
_______________________________________________________________________________
Study Parameters
VISITOR PARAMETERS & RESULTING DATA
Buxton conducted the analysis using the following
parameters:
• Mobile devices collected for a customized list of
areas of interest within New Braunfels
• All devices found within 35 miles from the
centroid of New Braunfels were excluded from
the analysis
MOBILE DATA WAS ANALYZED FROM APRIL 2017 TO MAY 2019.
From April 2017 to May 2019, Buxton identified:
• 54.9MM+ Pings within Areas of Interest
• 2.5MM+ Unique Visits to Areas of Interest
• 375,000+ Unique GPS Devices
• 166,801 Households included in analysis (Outside 35-mile radius)
01/31/2020 P a g e | 21 www.NewBraunfelsEDC.com2020 NBEDC Retail Study
Resulting data:
• Overall household profiles of visitors within the New Braunfels areas of interest
• Household distribution by Designated Market Area (DMA) of visitors within the New Braunfels areas of
interest
• Index scores indicating how well New Braunfels is attracting visitors for each segment
• Visitor origin files for the areas of interest loaded to proprietary database as individual result layers
Study Areas of Interest
01/31/2020 P a g e | 22 www.NewBraunfelsEDC.com2020 NBEDC Retail Study
STUDY FINDINGS:
Overall household profiles (most dominant segments):
All household profiles share a similar set of top segments:
• Ethnically diverse (Hispanic)
• Bilingual
• Homeowners with single family properties
• Married with kids in household
• High likelihood of teenagers and ages 7-9 present in household
• Variable household incomes ranging $50,000 - $150,000
• Variable head of household age: 25 - 65
Household distribution:
• Overall – Houston, Dallas-Fort Worth, and the portions of Austin and San Antonio outside of the 35-mile
radius account for at least 64% of visits in each area of interest
o Additional markets with significant representation include Waco-Temple-Bryan & Corpus
Christi
o Approximately 85% of visits for each area of interest are from the state of Texas
• Creekside
o Austin and Dallas-Fort Worth markets account for nearly 40% of the visits
• Downtown New Braunfels
o 35% of visits from the Houston and Dallas-Fort Worth markets
o Balance of Austin and San Antonio account for an additional 30%
• WestPointe Village
o Houston represents nearly 22% of the visits
01/31/2020 P a g e | 23 www.NewBraunfelsEDC.com2020 NBEDC Retail Study
Core Consumers
To be a top consumer segment, a segment must come close to or outperform its makeup with visitors from the
mobile analysis. Top consumers are then differentiated as follows:
• Primary Consumers (Index > 120) have a high likelihood of being New Braunfels Visitors.
• Secondary Consumers (Index > 100) are more likely than average to be New Braunfels Visitors.
• Tertiary Consumers (Index > 80) are less likely to be New Braunfels Visitors, but should be considered
opportunity segments that could be targeted to expand the Consumer base.
Creekside
01/31/2020 P a g e | 24 www.NewBraunfelsEDC.com2020 NBEDC Retail Study Westpointe Village Downtown New Braunfels 01/31/2020 P a g e | 25 www.NewBraunfelsEDC.com
2020 NBEDC Retail Study

Highly Represented Segments

01/31/2020                    P a g e | 26   www.NewBraunfelsEDC.com
2020 NBEDC Retail Study

01/31/2020   P a g e | 27   www.NewBraunfelsEDC.com
2020 NBEDC Retail Study
Segment Indices
The chart below displays the top segments for each area of interest and provides the actual index for each
segment
Downtown New Westpointe
Creekside Braunfels Village
SEGMENT NAME Index Index Index
A01: American Royalty 1.36 1.66 1.69
A02: Platinum Prosperity 1.50 1.77 1.98
A03: Kids and Cabernet 2.78 2.88 2.76
A04: Picture Perfect Families 1.34 1.53 1.58
A05: Couples with Clout 2.52 2.67 2.66
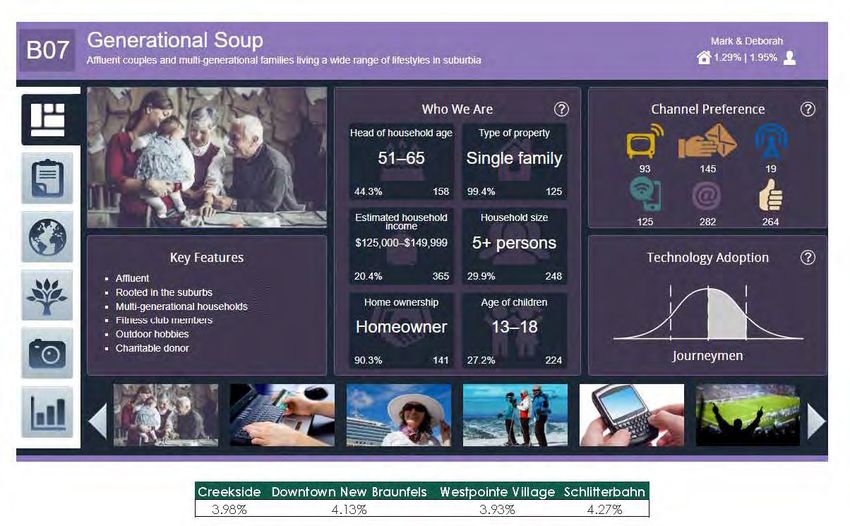
B07: Generational Soup 2.14 2.22 2.11
B08: Babies and Bliss 1.87 1.73 1.76
B09: Family Fun-Tastic 0.87 0.90 0.99
C11: Aging of Aquarius 0.98 1.09 1.13
C13: Silver Sophisticates 0.76 0.92 1.00
C14: Boomers and Boomerangs 1.58 1.52 1.55
D15: Sports Utility Families 1.06 1.12 1.17
D17: Cul de Sac Diversity 3.02 2.87 2.77
E19: Full Pockets, Empty Nests 0.69 0.80 0.63
E20: No Place Like Home 0.94 1.04 1.00
E21: Unspoiled Splendor 0.87 0.90 1.04
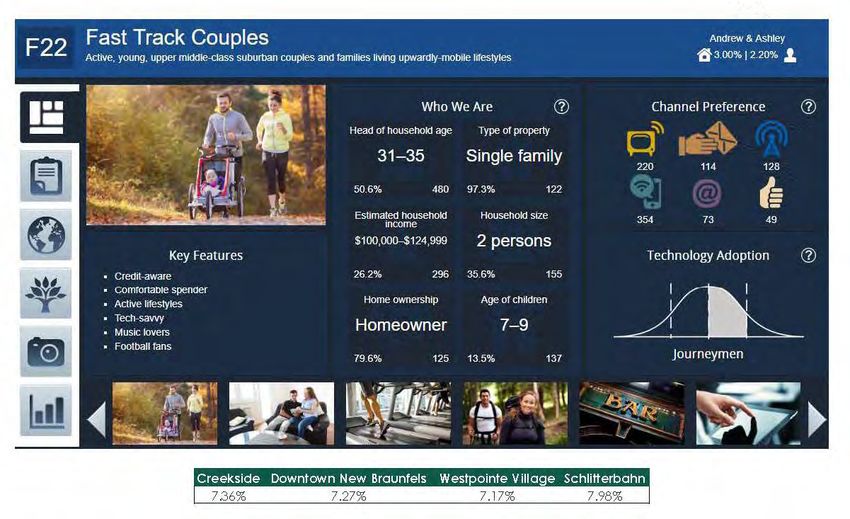
F22: Fast Track Couples 2.44 2.41 2.37
F23: Families Matter Most 1.27 1.31 1.16
G24: Status Seeking Singles 1.05 1.08 0.95
H26: Progressive Potpourri 0.82 0.81 0.68
H27: Birkenstocks and Beemers 1.17 1.33 1.47
H28: Everyday Moderates 2.63 2.39 2.36
I30: Stockcars and State Parks 0.87 0.88 1.12
I32: Latin Flair 0.94 0.79 0.66
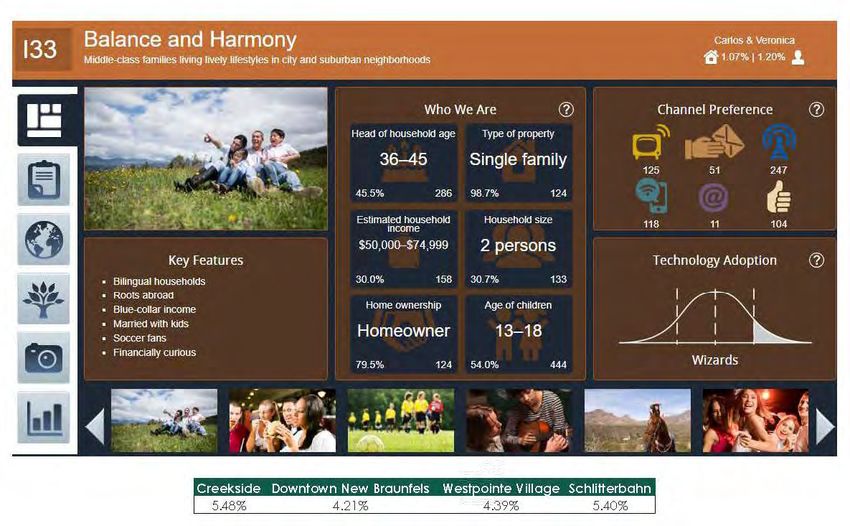
I33: Balance & Harmony 3.79 2.92 3.04
J35: Rural Escape 1.05 1.09 1.23
K37: Wired for Success 1.07 0.99 1.08
N46: True Grit Americans 1.09 1.31 1.32
N47: Countrified Pragmatics 1.45 1.49 1.69
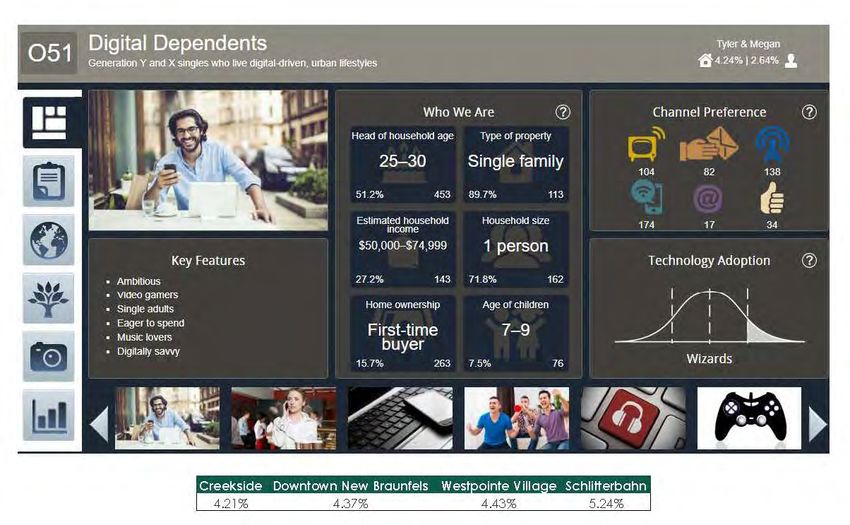
O51: Digital Dependents 1.10 1.15 1.16
O53: Colleges and Cafes 1.02 1.10 1.16
O55: Family Troopers 0.95 0.86 0.94
P59: Nuevo Horizons 2.96 2.03 1.78
Q62: Reaping Rewards 0.70 0.78 0.82
01/31/2020 P a g e | 28 www.NewBraunfelsEDC.com2020 NBEDC Retail Study 01/31/2020 P a g e | 29 www.NewBraunfelsEDC.com
2020 NBEDC Retail Study

             CREEKSIDE

01/31/2020     P a g e | 30   www.NewBraunfelsEDC.com
2020 NBEDC Retail Study Creekside Visitor Analysis 01/31/2020 P a g e | 31 www.NewBraunfelsEDC.com
2020 NBEDC Retail Study

Creekside Retail Trade Area

Retail Leakage and Surplus Analysis
The Retail Leakage and Surplus Analysis examines the quantitative aspect of the community's retail opportunities.
It is a guide to understanding retail opportunities but it is not an analysis that indicates unconditional
opportunities. The analysis is sometimes called "a gap analysis" or "a supply and demand analysis" and can aid in
the following:

01/31/2020                                  P a g e | 32                        www.NewBraunfelsEDC.com
2020 NBEDC Retail Study

Creekside Propensity
  CATEGORY           DESCRIPTION                                               RESIDENTIAL      WORKPLACE
  BEVERAGES -
  ALCOHOLIC DRINKS   DRINK LA GRANDE DAME CHAMPANGE AND SPARKLING WINE          234.5093424       135.0229852
  SHOPPING           PURCHASED ROWING MACHINE DURING LAST 12 MONTHS              195.4513468        124.6731791
  FOOD - GENERAL     USE EARTHS BEST BABY FOODS/BABY CEREALS/JUICES              191.9934482        127.978595
  FOOD - GENERAL     USE BEECH-NUT STAGE 1 BABY FOODS, BABY CEREALS/JUICES        191.8124242      131.3752334
  FOOD - GENERAL     USE KOSHERABLES PREPARED LUNCH KITS                          184.2336811      120.1725327
  AUTOMOTIVE         MOST RECENTLY ACQUIRED FOREIGN VEHICLE - SCION              182.3843727      159.3227984
  BEVERAGES -
  ALCOHOLIC DRINKS   DRINK COCKBURN PORT, SHERRY AND DESSERT WINES              176.0087357        163.7899727
  APPAREL            USE PAMPERS SWADDLERS DISP DIAPERS/TRAIN PANTS               171.590148      140.9594886
  BEVERAGES -
  ALCOHOLIC DRINKS   DRINK HENRY WEINHARDS REGULAR DOMESTIC BEER                165.5236593       141.7912656
  SHOPPING           PURCHASED STAIR CLIMBING MACHINE DURING LAST 12 MONTHS     157.7204562       127.0127855
  HEALTH AND
  BEAUTY AIDS        USE REMBRANDT MOUTHWASH/DENTAL RINSE                        157.7097792      109.8981468
  FOOD - GENERAL     USE RO-TEL TOMATO PASTE                                     152.8184907      123.0099124

Creekside Daytime Population

01/31/2020                                 P a g e | 33                       www.NewBraunfelsEDC.com
2020 NBEDC Retail Study

             WESTPOINTE VILLAGE

01/31/2020         P a g e | 34   www.NewBraunfelsEDC.com
2020 NBEDC Retail Study Westpointe Village Visitor Analysis 01/31/2020 P a g e | 35 www.NewBraunfelsEDC.com
2020 NBEDC Retail Study

WestPointe Village Retail Trade Area

Retail Leakage and Surplus Analysis
The Retail Leakage and Surplus Analysis examines the quantitative aspect of the community's retail opportunities.
It is a guide to understanding retail opportunities but it is not an analysis that indicates unconditional
opportunities. The analysis is sometimes called "a gap analysis" or "a supply and demand analysis" and can aid in
the following:

01/31/2020                                  P a g e | 36                        www.NewBraunfelsEDC.com
2020 NBEDC Retail Study

WestPointe Village Propensity
  CATEGORY      DESCRIPTION                                                            RESIDENTIAL      WORKPLACE
  AUTOMOTIVE    MOST RECENTLY ACQUIRED FOREIGN VEHICLE - PORSCHE                        268.5162549      217.3243045
  FINANCIAL     BANKING AND INVESTMENTS - CASH MANAGEMENT ACCOUNT(S) FROM DISC
  SERVICES      BROKERAGE FIRM                                                          254.1144343      154.0896779
  SHOPPING      PURCHASED SKI POLESN DURING LAST 12 MONTHS                              231.4505852      157.5724744
  FINANCIAL     BANKING AND INVESTMENTS - CASH MANAGEMENT ACCOUNT(S) FROM FS
  SERVICES      BROKERAGE FIRM                                                           223.6716515     133.7785505
  FINANCIAL     BANKING AND INVESTMENTS - INTEREST BEARING CHECKING ACCOUNT(S) FROM
  SERVICES      FS BROKERAGE FIRM                                                       223.4144993      113.6925329
  FINANCIAL
  SERVICES      CURRENTLY CARRY CONVALESCENT (LONG TERM) CARE INSURANCE                 216.2662549       115.3341874
  FINANCIAL
  SERVICES      MONEY MARKET VALUED AT $100,000 OR MORE                                  215.4577373     132.5706442
  FINANCIAL
  SERVICES      TYPE OF INVESTMENT - OWN CITY/MUNICIPAL OR STATE BONDS                  213.9362809      118.6240849
  FINANCIAL
  SERVICES      CURRENTLY CARRY UMBRELLA COVERAGE LIABILITY INSURANCE                   213.7382965       138.0581991
  FINANCIAL
  SERVICES      TYPE OF INVESTMENT - OWN CORPORATE BONDS                                  211.9661899    124.0380673
  AUTOMOTIVE    RECENTLY ACQUIRED A PREMIUM LUXURY CAR                                   208.9210013     126.3938507
  AUTOMOTIVE    MOST RECENTLY ACQUIRED FOREIGN VEHICLE - ACURA                           205.4811443      129.3199122
  BEVERAGES -
  ALCOHOLIC
  DRINKS        DRINK RUFFINO IMPORTED DINNER WINES                                     205.2074122       131.8770132

WestPointe Village Daytime Population

01/31/2020                                 P a g e | 37                       www.NewBraunfelsEDC.com
2020 NBEDC Retail Study

               DOWNTOWN
             NEW BRAUNFELS

01/31/2020       P a g e | 38   www.NewBraunfelsEDC.com
2020 NBEDC Retail Study Downtown New Braunfels Visitor Analysis 01/31/2020 P a g e | 39 www.NewBraunfelsEDC.com
2020 NBEDC Retail Study

Downtown New Braunfels Retail Trade Area

Retail Leakage and Surplus Analysis
The Retail Leakage and Surplus Analysis examines the quantitative aspect of the community's retail
opportunities. It is a guide to understanding retail opportunities but it is not an analysis that indicates
unconditional opportunities. The analysis is sometimes called "a gap analysis" or "a supply and demand analysis"
and can aid in the following:

01/31/2020                                  P a g e | 40                        www.NewBraunfelsEDC.com
2020 NBEDC Retail Study

Downtown New Braunfels Propensity
 CATEGORY                 DESCRIPTION                                  RESIDENTIAL   WORKPLACE
                          BOUGHT PITCH FORK (LAWN AND GARDEN
 LAWN & GARDEN            HAND EQUIPMENT) DURING LAST 12 MONTHS        199.9885152 116.7441397
 COMPUTERS/INTERNET       USED/VISITED DELLCOM DURING LAST 7 DAYS      181.0155865 124.6506818
                          LISTEN TO OLDIES ROCK- 80S ON RADIO MON-
 CABLE/TELEVISION/RADIO   SUN TOTAL (24 HRS)                           180.1296144 117.3971197
                          MOST RECENTLY ACQUIRED DOMESTIC
 AUTOMOTIVE               VEHICLE - HUMMER                             178.9433962 97.12915581
                          MOST RECENTLY ACQUIRED DOMESTIC
 AUTOMOTIVE               VEHICLE - OLDSMOBILE                         178.8383921   105.452888
                          USE IVORY SNOW LAUNDRY
 CLEANING PRODUCTS        SOAPS/DETERGENTS                             178.2731747 110.3468669
 HEALTH AND BEAUTY AIDS   USE NATURAL WHITE TOOTH WHITENERS            178.0541427 128.6496093
 BEVERAGES - ALCOHOLIC
 DRINKS                   DRINK ST PAULI GIRL IMPORTED BEER            173.6447908 103.6005822
 BEVERAGES - ALCOHOLIC    DRINK LORD CALVERT CANADIAN CANADIAN
 DRINKS                   WHISKEY                                      172.2682527 121.2894132
 PRINT MEDIA              READ THE MAGAZINE SMARTMONEY                 167.9433962 101.9178796
                          BANKING AND INVESTMENTS - CASH
                          MANAGEMENT ACCOUNT(S) FROM MUTUAL
 FINANCIAL SERVICES       FUND FIRM                                    167.0623462 103.8555232
 HEALTH AND BEAUTY AIDS   USE BOBBI BROWN LIPSTICK AND LIPGLOSS        165.3297785 123.1820132

Downtown New Braunfels Daytime Population

01/31/2020                        P a g e | 41                       www.NewBraunfelsEDC.com
2020 Retail Study
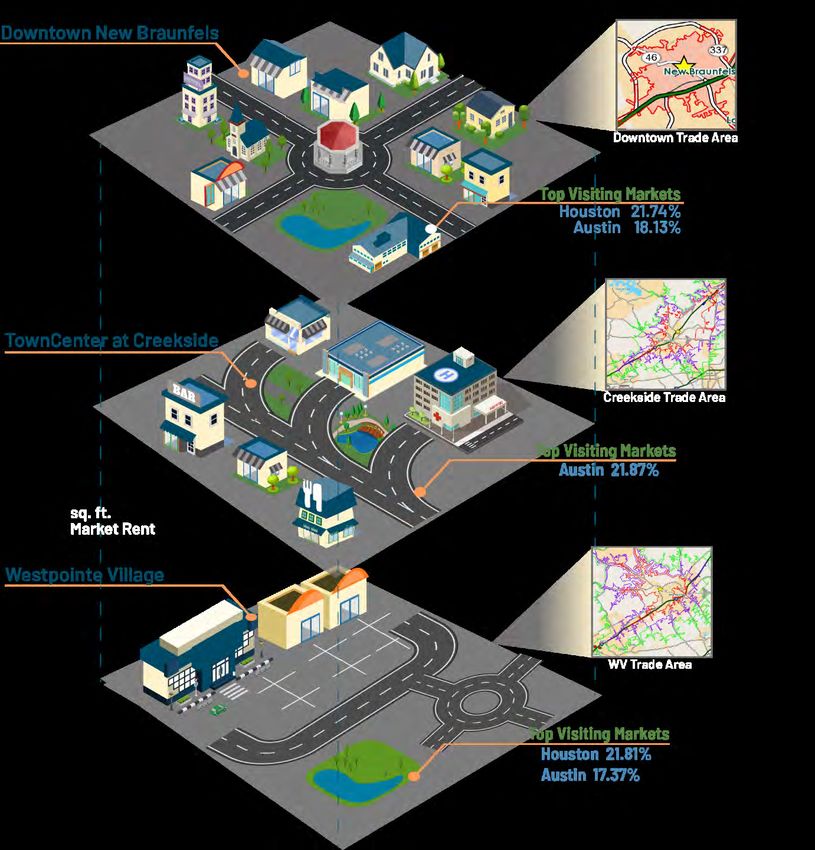
Industry Snapshot
Downtown New Braunfels
Downtown Trade Area
Top Visiting Markets
Houston 21.74%
Austin 18.13%
TownCenter at Creekside
Creekside Trade Area
Top Visiting Markets
Austin 21.87%
DFW 16.56%
Westpointe Village
WV Trade Area
Top Visiting Markets
Houston 21.81%
Austin 17.37%
Prevailing Segmentation Top Retail Leakage (by location)
Fast Track Couples
Active,young
Upper middle class
Credit aware
Tech-savvy
Westpointe
Balance & Harmony
Middle class
Bilingual Downtown
Blue-collar income Creekside
Married with kids
Bldg materials Sport Goods Food & Bev
Gen. merchandise Furniture Clothing
Real Estate Electronics Misc. retail Nonstore
retailer
Top Sales Tax by Category2020 RETAIL MARKET PROFILE WESTPOINTE VILLAGE NEW BRAUNFELS, TEXAS OVERVIEW Deep in the heart of the Texas Hill Country rests beautiful New Braunfels. Founded in 1845 by German settlers. New Braunfels boasts great museums, historic districts, and performing arts all within a short distance. Interstate 35 is a major thoroughfare along with Loop 337 and TX 46, providing convenient access into and around town. A 146,988-square foot community shopping center anchored by an 89,192 SF H-E-B Grocery, WestPointe Village is strategically located at the gateway to the desirable Texas Hill Country. This community retail center serves the affluent trade areas in west New Braunfels, the Canyon Lake region and throughout Comal County. The SH 46 corridor has experienced dramatic residential growth over the past decade, and construction of roadway improvements is underway to support and sustain this continued growth. RETAIL DEMOGRAPHICS SECTOR POTENTIAL RETAIL TRADE AREA Motor Vehicle Parts/Dealers $28,070,018 2018 Population Estimate 71,567 Foodservice/Drinking $14,592,810 2023 Population Estimate 78,555 General Merchandise $14,044,765 2018 Population Density (0.5 mile) 1,042 Food & Beverage Stores $13,943,861 2018 Workplace Population 39,532 Bldg Material/Garden Equip. $8,385,718 2018 Total Households 26,491 Health & Personal Care $7,351,624 2018 Avgerage HH Income $79,895 Source: 2020 Buxton Group
RETAIL RETAIL TRADE AREA
The Retail Industry in New Braunfels employs over 11,000
people, 29% of the overall labor force market share. The
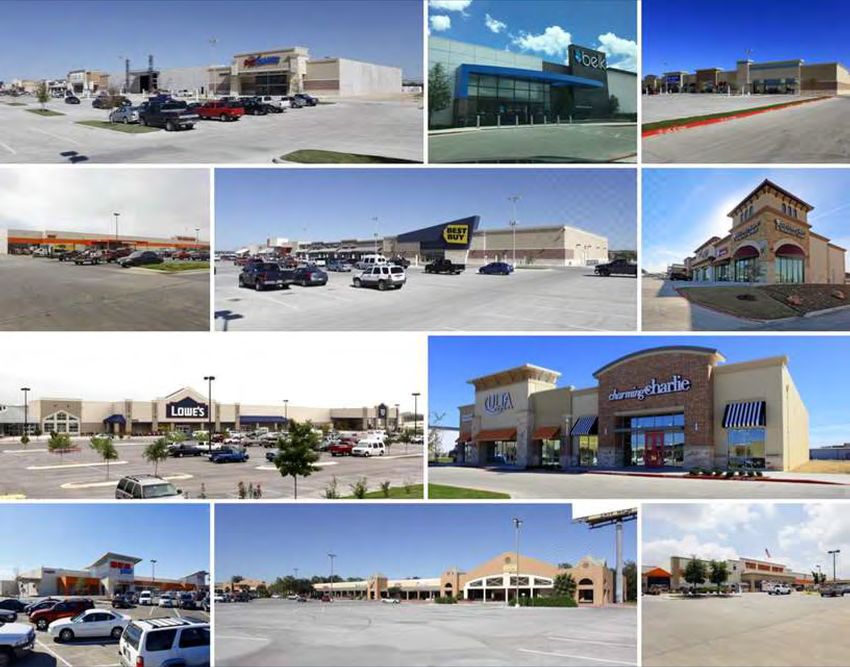
growth of retail can be attributed to new developments
such as Westpointe Village, Downtown New Braunfels, Town
Center at Creekside and Village at Creekside.
Together these developments alone will have over 3.5
million square feet of retail space at full build-out. At one
time, a 2015 retail gap study indicated New Braunfels and
Comal County were experiencing over $1 billion dollars in
retail leakage. Since the study was completed, there still are
potential sales of $46 million to be made.
Some of the businesses at Westpointe Village include:
• HEB • Longhorn Cafe
• Chick-Fil-A • The Reel Seafood Co
• Tomlinson’s • McAlister’s Deli
• Discount Tire • Schlotzky’s TRAFFIC
• Dunkin Donuts • Twin Liquors
• Orange Leaf • Modern Dentistry
MARKET SEGMENTATION
10 MIN DRIVE TIME
Market Avg. Avg. Age of
Notes
Segment Age Salary Kids
C11 Affluent
58 $180,000 0-3
Aging of Aquarius Upscale
J34 Retired
70 $40,000 0-3
Aging in Place Republican
O51: Single,
27.5 $62,499 7-9
Digital Dependent Tech
LOCATION MAP
15 MIN DRIVE TIME
F22: Active,
32.5 $115,000 7-9
Fast Track Couple Spender
J34: Retired,
70 $42,500 Grown
Aging In Place Fine Arts
O51: Single,
27.5 $62,499 7-9
Digital Dependent Tech
Source: 2020 Buxton Group
Source: Buxton Group2020 RETAIL MARKET PROFILE CREEKSIDE NEW BRAUNFELS, TEXAS OVERVIEW Deep in the heart of the Texas Hill Country rests beautiful New Braunfels. Founded in 1845 by German settlers. New Braunfels boasts great museums, historic districts, and performing arts all within a short distance. Interstate 35 is a major thoroughfare along with Loop 337 and TX 46, providing convenient access into and around town. New Braunfels Town Center at Creekside is a 400+ acre master planned, mixed use development positioned at the epicenter of the rapidly growing Austin/San Antonio corridor in historic New Braunfels, TX. The project integrates over one million square feet of retail with a 130+ bed hospital, a multi-family development and an entertainment complex—all interlaced with streams and fountains. RETAIL DEMOGRAPHICS SECTOR POTENTIAL RETAIL TRADE AREA Motor Vehicle Parts/Dealers $36,984,132 2018 Population Estimate 121,113 Foodservice/Drinking $18,521,442 2023 Population Estimate 132,134 General Merchandise $17,585,129 2018 Population Density (0.5 mile) 1,122 Food & Beverage Stores $17,460,252 2018 Workplace Population 66,543 Bldg Material/Garden Equip. $8,754,846 2018 Total Households 45,816 Health & Personal Care $8,029,565 2018 Average HH Income 70,000 Source: 2020 Buxton Group
RETAIL                                                                  RETAIL TRADE AREA
The Retail Industry in New Braunfels employs over 11,000
people, 29% of the overall labor force market share. The
growth of retail can be attributed to new developments
such as Town Center at Creekside, Village at Creekside,
Westpointe Village, and Downtown New Braunfels.
Together these developments alone will have over 3.5
million square feet of retail space at full build-out. At one
time, a 2015 retail gap study indicated New Braunfels and
Comal County were experiencing over $1 billion dollars in
retail leakage. Since the study was completed, there still are
potential sales of $46 million to be made.
Some of the businesses at Creekside include:
•      Target                      •      Hobby Lobby
•      JCPennys                    •      Five Below
•      Dick’s Sporting Goods       •      Belk
•      Best Buy                    •      Bath & Body Works
                                                                        TRAFFIC
•      Petsmart                    •      Ulta
•      Burlington Coat Factory     •      Specs
•      Panda Express               •      James Avery

MARKET SEGMENTATION
    15 MIN DRIVE TIME
    Market                  Avg.          Avg.     Age of
                                                               Notes
    Segment                 Age         Salary       Kids
    O51:                                                      Single,
                            27.5   $62,499            7-9
    Digital Dependent                                           Tech
    F22:
                            32.5   $115,000           7-9
    Fast Track Couple
    E20:                                              0-3      Smart
                             58    $62,499
    No Place Like Home                           Grandkid    Shopper

                                                                        LOCATION MAP
    20 MIN DRIVE TIME
    053:                                                      Active,
                             22        $15,000         0
    College and Cafe                                        Educated
    O54                                                       Career,
                             27    $20,000             0
    Striving Single                                           Foodie
    O51:                                                      Single,
                            27.5   $62,499            7-9
    Digital Dependent                                           Tech

Source: 2020 Buxton Group
2020 RETAIL MARKET PROFILE DOWNTOWN NEW BRAUNFELS, TEXAS OVERVIEW Deep in the heart of the Texas Hill Country rests beautiful New Braunfels. Founded in 1845 by German settlers. New Braunfels boasts great museums, historic districts, and performing arts all within a short distance. Interstate 35 is a major thoroughfare along with Loop 337 and TX 46, providing convenient access into and around town. The New Braunfels Main Street and Downtown Development program actively supports expansion of the downtown economic base by assisting in recruiting more businesses to downtown, advertising available properties in the district, and assisting with historic preservation efforts. RETAIL DEMOGRAPHICS SECTOR POTENTIAL RETAIL TRADE AREA Motor Vehicle Parts/Dealers $13,224,935 2018 Population Estimate 93,779 Foodservice/Drinking $7,038,518 2023 Population Estimate 103,156 General Merchandise $6,6,04,477 2018 Population Density (0.5 mile) 2,315 Food & Beverage Stores $6,604,196 2018 Workplace Population 47,628 Bldg Material/Garden Equip. $3,314,716 2018 Total Households 34,004 Health & Personal Care $3,159,253 2018 Average HH Income $81,146 Source: 2020 Buxton Group
RETAIL                                                             RETAIL TRADE AREA
The Retail Industry in New Braunfels employs over 11,000
people, 29% of the overall labor force market share. The
growth of retail can be attributed to new developments
such as Downtown New Braunfels , Westpointe Village, Town
Center at Creekside and Village at Creekside.
Together these developments alone will have over 3.5
million square feet of retail space at full build-out. At one
time, a 2015 retail gap study indicated New Braunfels and
Comal County were experiencing over $1 billion dollars in
retail leakage. Since the study was completed, there still are
potential sales of $46 million to be made.
Some of the businesses downtown include:
• Myrons Steakhouse       • Red Stag Antiques
• 188 South               • Henne Hardware
• 2 Tarts Bakery          • Brauntex Theater
• River Rose Company      • Huisache Grill
• McAdoo’s Restaurant     • Pour Haus                              TRAFFIC
• New Braunfels Brewing   • Downtown Social
• Jackalope Clothing      • Score’s
• Krause’s                • Phoenix Saloon

MARKET SEGMENTATION

 10 MIN DRIVE TIME
 Market                     Avg.      Avg.    Age of
                                                          Notes
 Segment                    Age     Salary      Kids
 O51:                                                    Single
                            27.5   $62,499      7-9
 Digital Dependent                                        Tech
 L42:                                                     Single
                             58    $62,499     13-19
 Rooted Flower Pwr                                       Liberal
 Q64:                                                     Home
                             76    $30,000    Grown
 Town Elders                                           Centered

                                                                   LOCATION MAP
 15 MIN DRIVE TIME
 F22:                                                   Active,
                            32.5   $115,000     7-9
 Fast Track Couple                                     Spender
 J34:                                                   Retired,
                             70    $42,500    Grown
 Aging In Place                                        Fine Arts

Source: 2020 Buxton Group
You can also read