2021-23 CAPITAL BUDGET DEVELOPMENT
←
→
Page content transcription
If your browser does not render page correctly, please read the page content below
2021-23 CAPITAL
BUDGET DEVELOPMENT
Columbia Basin College Richland Campus on Thursday, May 9, 2019
Green River Community College on Tuesday, May 28, 2019

 PLEASE…

           Feel free to ask questions at any time.

           Take cell calls outside the room.

           Let me know if you need anything.

                                                                  2

                                                                      1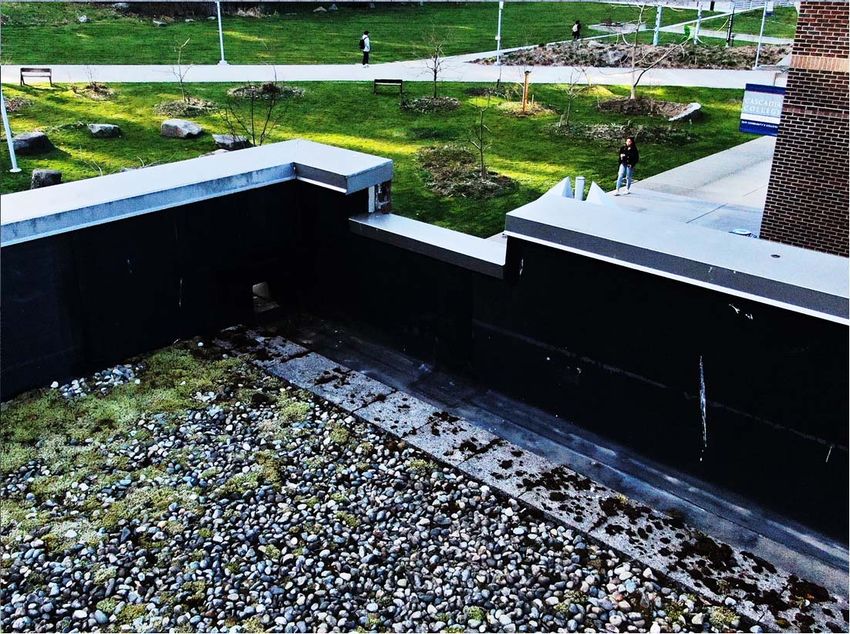
INTRODUCTIONS
                 Wayne Doty, Capital Budget Director

                 Steve Lewandowski, Chief Architect

                 Cheryl Bivens, Capital Budget Analyst

                 You?

                                                                                                      3

AGENDA
9:00 – 10:00 Welcome, General Information and Trends
             Construction Costs and Bidding            12:30 – 1:45 Minor Projects
             Prevailing Wages                                       Types and Target Funding
             Enrollment Projections                                 Minor Work List Changes
                                                                    Use of URF/RMI
10:00 – 10:15 Break                                                 Emergency and HazMat Pools

10:15 – 10:45 Topics of Interest                        1:45 – 2:00 Break
              Implementing the 2019-21 Budget
              Planning for the 2020 Supplemental        2:00 – 3:00 Major Projects
                                                                    Allotment Phases
10:45 – 12:00 Condition Surveys for 2021-23                         Furniture, Fixtures & Equipment
              New Infrastructure Condition Survey                   Previous Scores
              Facility Condition Survey                             Policies
              Office of Civil Rights Review                         Scoring Criteria
              Use of an aerial drone                                Scoring Worksheets
                                                                    Alternative Financing
12:00 – 12:30 Lunch
                                                       3:00 – 3:30 Wrap Up
                                                                   Remaining Questions
                                                                   Program Evaluation

                                                                                                      4

                                                                                                          2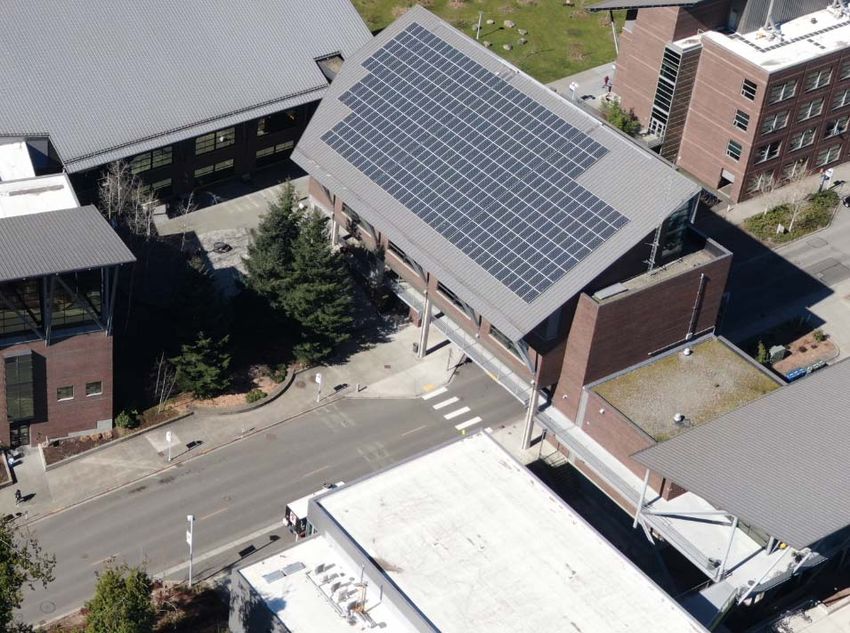
CAPITAL PRINCIPLES
 We are required to prioritize our requests for new appropriations.
 Funding for maintenance and operation of existing facilities is our top
 priority.
 Next comes funding for emergencies, minor repairs, and minor program
 improvement projects to take care of existing facilities.
 Major projects are added to a pipeline of projects, in rank order from the
 most recent selection, below the projects already in the pipeline.
 Requests are structured so that major projects are constructed in pipeline
 order. This includes requesting design-phase funding the biennium before
 construction is anticipated.
 Projects stay in the pipeline until funded for construction.
 WACTC has a policy to avoid end-runs.

                                                                                              5

PRIORITIZATION OF FACILITY NEEDS
  Programmatic                                                           Facility Condition
      Need

                           Minor Repairs by
                               Severity
                                                       Worse Condition

                             Candidate for
                              Renovation
  Space Deficit?
                   No
                             Candidate for
         Yes                 Replacement

                             Candidate for
                            Additional Area
                                                                                              6

                                                                                                  3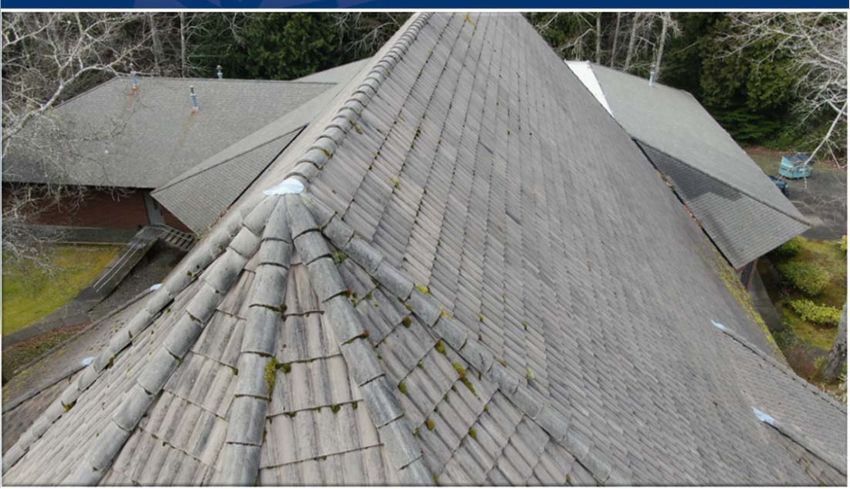
CAPITAL DEVELOPMENT TIMELINE
March – May 2018          Collected feedback on previous biennium process and outcomes
June 2018 – April 2019    System developed recommendations for improvement
March – December 2019     State Board staff evaluate existing facility conditions
May 2019                  State Board adopts criteria for request
May 2019                  Share information in budget development workshops

May – December 2019       Colleges develop proposals for new appropriations
July 2019 – March 2020    State Board staff evaluate existing infrastructure conditions
January – February 2020   System task force scores proposals
March – May 2020          Staff build request for new and re-appropriations
May – September 2020      State Board adopts and staff submits request
December 2020             Governor’s proposal
January – April 2021      Legislative proposals
May – June 2021           Enacted budget
July 2021 – June 2023     State Board staff and colleges implement the budget

                                                                                          7

CONSTRUCTION COSTS

                                                                                              4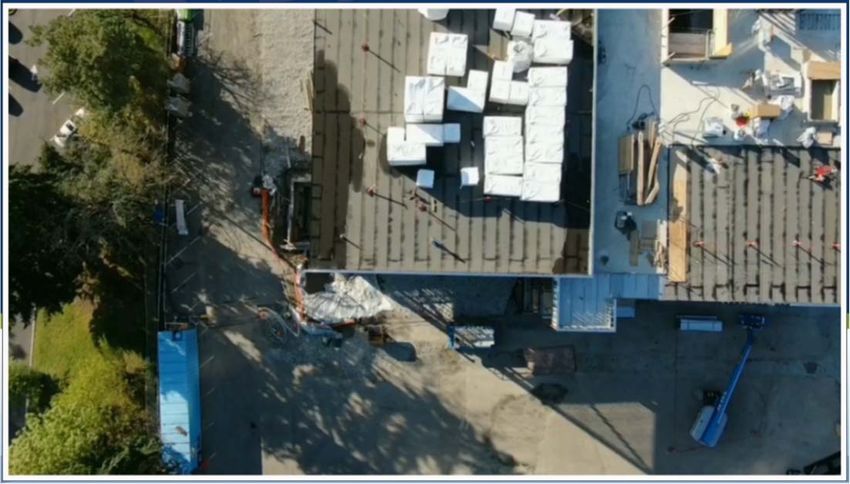
USACE COST INDEX SYSTEM
                                          1,000
                                                        Mar‐18 Projection
                                                                                                                                                                      2.8%
                                                        Actual
                                           900
                                                        Biennia Lines
Index for Buildings, Grounds &Utilities

                                                        Escalation Trend Lines                                                        5.0%
                                           800

                                                                                                              6.0%
                                           700
                                                                                                                                                      2015‐
                                                                                                                                                       17
                                           600
                                                                                                                                              2013‐
                                                                                                                                               15
                                           500
                                                                                    2.1%                                              2011‐
                                                                                                                                       13
                                           400
                                                                                                                              2009‐
                                                                                                                               11
                                           300
                                                                                                                      2007‐                                                   2021‐
                                                                                                                       09                                                      23
                                           200
                                                                                                              2005‐                                                   2019‐
                                                                                                               07                                                      21
                                           100
                                                                                                      2003‐                                                   2017‐
                                                                                                       05                                                      19
                                              ‐
                                             Jan‐1980                    Jan‐1990          Jan‐2000                      Jan‐2010                                Jan‐2020         9

         BID CLIMATE
         The following analysis is based on 197 construction bids for community and technical
         college projects between Jul 2014 and April 2019 as reported by DES.

         Some of the projects did not have sufficient details to be included in the analysis.
         • 6 were missing low bid amounts
         • 3 were missing project estimates
         • 2 had low bids but did not report the number of bidders

                                                                                                                                                                                10

                                                                                                                                                                                      5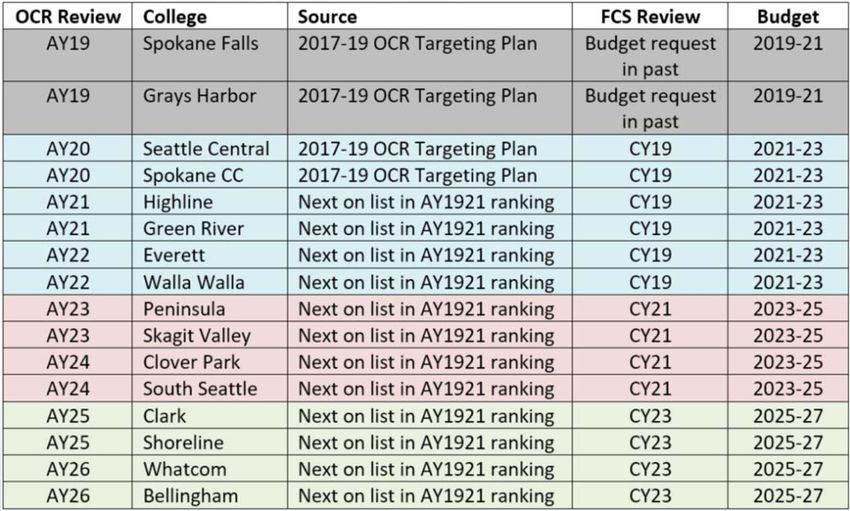
BID CLIMATE
  Number
   Numberof ofBidders
              Bidders   Number of Bids Minimum Low Bid Average Low Bid   Maximimum Low Bid
            1               26         $        28,000 $       208,423   $          494,000
            2               35         $        33,000 $     2,677,566   $       30,000,000
            3               35         $        40,000 $       960,548   $       17,000,000
            4               40         $        30,000 $       735,633   $       12,500,000
            5               16         $        28,000 $     1,146,438   $       10,800,000
            6               12         $        90,000 $       454,642   $        1,022,700
            7                7         $       450,000 $       845,714   $        2,600,000
            8                7         $       272,000 $       925,171   $        3,000,000
            9                3         $       440,000 $       668,333   $        1,100,000
           10                2         $       570,000 $       902,500   $        1,235,000
           11                2         $       375,000 $       702,500   $        1,030,000
           12                2         $       350,000 $       775,000   $        1,200,000
           13                1         $       960,000 $       960,000   $          960,000
Grand Total                 188        $        28,000 $     1,096,267   $       30,000,000
About 14% of the projects received only one bid.
About 74% received two to six bids.
Less than 13% of the projects received more than six bids.                              11

BID CLIMATE – ALL PROJECTS
Average of Low Bid / Est Bid Mo                    Bid Month
   Number of Bidders     Jan Feb Mar Apr May Jun Jul       Aug Sep    Oct Nov Dec Total
           1               95% 94%      92% 66% 111% 91% 92% 92%       89% 93%     95%
           2               97% 92% 90% 90% 90% 95% 93% 95%             91% 95% 95% 93%
           3                    85% 90% 90% 94% 87% 94% 91% 107%       95% 78%     90%
           4                    96% 91% 97% 81% 87% 93% 96% 105%       96% 95% 92% 92%
           5               95% 95% 96%      93%        88%      96%   128% 89% 94% 97%
           6               95% 95% 92%      95% 93%             95%        65% 95% 92%
           7                        85% 88% 99% 97%             95%    82%         91%
           8                    93%         98%             89%        95% 94% 95% 94%
           9                    91%         94%                            95%     93%
           10                       93%                                    95%     94%
           11                   93%                                    95%         94%
           12                                                          90% 93%     92%
           13              95%                                                     95%
Total                      95% 92% 91% 91% 88% 95% 92% 93% 99%         98% 90% 94% 93%

Bids in May and November tend to be lowest relative to the estimates.
September tends to be the month with the highest bids relative to the estimates.
Receiving three bids corresponded with the lowest bids relative to the estimates.       12

                                                                                              6
BID CLIMATE - MAJORS

            Average of Low Bid / Est Bid Mo
               Number of Bidders     Mar Apr Jun Jul    Nov Dec                                     Total
                        2                   93% 95% 92%                                              93%
                        3             93%                                                            93%
                        4                                95%                                         95%
                        5                                    94%                                     94%
            Total                     93% 93% 95% 92% 95% 94%                                        94%

                 Bids in July tend to be lowest relative to the estimates.
                 June and November tends to be the month with the highest bids relative to the estimates.
                 Receiving two or three bids corresponded with the lowest bids relative to the estimates.
                                                                                                          13

                 BID CLIMATE
                 200%
                                                                                             High
                 180%                                                                        Average of Low/Est
                                                                                             Low
                 160%

                 140%
Bid / Estimate

                 120%

                 100%

                  80%

                  60%

                  40%

                  20%

                   0%
                         Jan   Feb    Mar    Apr    May    Jun    Jul   Aug    Sep    Oct    Nov        Dec
                                                           Bid Month
    February, June, September and October were the only months with bids over the estimates.              14

                                                                                                                  7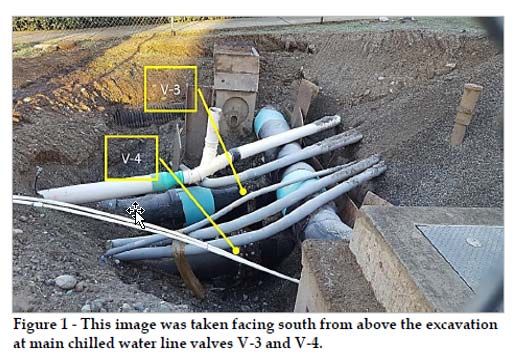
BID CLIMATE

                                                                Major projects received two to five bids.
                                                                Minor projects received one to twelve bids.

                                                                                                           15

      BID CLIMATE                                 No discernable difference between bids relative
                                                  to estimates for east and west of the mountains.
                           100%
                           99%
                           98%
Average of Low Bid / Est

                           97%
                           96%
                           95%
                           94%
                           93%
                           92%
                           91%
                           90%
                                  0   1   2   3    4     5      6       7      8   9     10    11     12        13
                                                             Number of Bidders
                                                                                                           16

                                                                                                                     8
IMPACT OF PREVAILING WAGE
RATE CHANGES ON MAJOR
CAPITAL PROJECTS

PREVAILING WAGES
The Department of Labor and Industries
updates prevailing wage rates every six
months.
The rates are published the first day of
August and February and take effect 30
days after publication.
The rate effective on the day a contract is
bid is the rate for the entire project.
                                              18

                                                   9
PREMISE
The impact of prevailing wage rate
changes can be estimated by applying
rates that were effective at different times
to the study project’s labor hours.
The cost of labor will also be affected by
contractor mark-ups and labor
productivity.

                                           19

ALLOWABLE ESCALATION
The Office of Financial Management sets
the allowable escalation rates for
estimating major project costs.

Effective Rate          Effective Rate
7/1/2013 3.00%          7/1/2017 2.80%
7/1/2015 3.08%          7/1/2019 3.12%
                                           20

                                                10
STUDY PROJECT
Description: Green River Community College Trades & Industry Complex
Project Numbers: OFM 20081222 DES 2012-909
Gross Square Footage: 76,684
Architect: S.M. Stemper Contractor: The Walsh Group
Bid Date: February 16, 2014
County: King
General Contract: $ 22,316,000
Project Total: $ 35,862,221
PW Labor Cost: $ 7,300,912 (32.72% of contract, 20.36% of project total)
21
Share of
Sorted by share of hours in project Journeyman Apprentice Total Project Total
Sign Makers & Installers (Non‐Electrical) 15 15 0%
Electricians ‐ Powerline Construction 37 37 0%
Metal Fabrication (In Shop) 109 109 0%
Traffic Control Stripers 111 111 0%
Soft Floor Layers 121 121 0%
Fence Erectors 278 278 0%
Surveyors 293 293 0%
Insulation Applicators 343 343 0%
Millwright 408 408 0%
Heat & Frost Insulators And Asbestos Workers 438 438 0%
Tile Setters 448 448 0%
Electronic Technicians 504 504 0%
Hod Carriers & Mason Tenders 538 538 0%
Drywall Tapers 808 144 952 1%
Telecommunication Technicians 1,374 1,374 1%
Sprinkler Fitters (Fire Protection) 1,271 935 2,206 2%
Landscape Construction 2,880 2,880 2%
Brick Mason 2,395 533 2,928 2%
Truck Drivers 3,071 3,071 2%
Painters 2,852 1,341 4,192 3%
Drywall Applicator 3,190 1,489 4,679 3%
Cement Masons 4,897 146 5,043 4%
Glaziers 7,372 7,372 5%
Power Equipment Operators 7,422 725 8,146 6%
Roofers 9,293 214 9,506 7%
Ironworkers 9,316 799 10,114 7%
Plumbers & Pipefitters 7,970 2,406 10,376 7%
Sheet Metal Workers 9,161 2,599 11,759 8%
Laborers 13,597 313 13,909 10%
Electricians ‐ Inside 14,402 4,875 19,277 13%
Carpenters 19,020 2,821 21,840 15% 22
Total 123,930 19,335 143,265 100%
11Effective Date of Prevailing Wage
Sorted by 9/1/2018 % increase from 2/16/2014 2/16/2014 9/1/2017 9/1/2018
% of total % of total % increase from % of total % increase from
Trade labor cost labor cost 2/16/2014 labor cost 2/16/2014
Metal Fabrication (In Shop) $ 1,511 0% $ 1,548 0% 103% $ 1,564 0% 104%
Traffic Control Stripers $ 4,677 0% $ 4,965 0% 106% $ 5,031 0% 108%
Sprinkler Fitters (Fire Protection) $ 117,568 2% $ 125,686 2% 107% $ 130,307 2% 111%
Truck Drivers $ 145,333 2% $ 158,210 2% 109% $ 163,013 2% 112%
Surveyors $ 15,442 0% $ 17,471 0% 113% $ 17,471 0% 113%
Power Equipment Operators $ 420,890 6% $ 476,291 6% 113% $ 476,305 6% 113%
above OFM allowable escalation rate ‐‐>
Electricians ‐ Powerline Construction $ 2,248 0% $ 2,501 0% 111% $ 2,581 0% 115%
Plumbers & Pipefitters $ 701,083 10% $ 769,431 9% 110% $ 806,993 9% 115%
Drywall Applicator $ 224,640 3% $ 250,998 3% 112% $ 258,657 3% 115%
Painters $ 142,239 2% $ 160,297 2% 113% $ 163,787 2% 115%
Brick Mason $ 136,780 2% $ 152,409 2% 111% $ 157,625 2% 115%
Sign Makers & Installers (Non‐Electrical) $ 409 0% $ 409 0% 100% $ 473 0% 116%
Ironworkers $ 584,679 8% $ 651,751 8% 111% $ 675,961 8% 116%
Roofers $ 418,939 6% $ 466,877 6% 111% $ 488,292 6% 117%
Laborers $ 577,319 8% $ 644,895 8% 112% $ 676,843 8% 117%
Soft Floor Layers $ 5,111 0% $ 5,773 0% 113% $ 5,993 0% 117%
Hod Carriers & Mason Tenders $ 23,129 0% $ 25,835 0% 112% $ 27,126 0% 117%
Glaziers $ 396,342 5% $ 446,474 5% 113% $ 464,905 5% 117%
Cement Masons $ 255,903 4% $ 277,818 3% 109% $ 300,742 3% 118%
Carpenters $ 1,082,889 15% $ 1,218,241 15% 112% $ 1,279,124 15% 118%
Insulation Applicators $ 17,431 0% $ 19,613 0% 113% $ 20,594 0% 118%
Millwright $ 21,183 0% $ 23,941 0% 113% $ 25,108 0% 119%
Sheet Metal Workers $ 752,625 10% $ 849,168 10% 113% $ 895,476 10% 119%
Drywall Tapers $ 45,185 1% $ 52,114 1% 115% $ 53,859 1% 119%
Electricians ‐ Inside $ 1,064,822 15% $ 1,211,373 15% 114% $ 1,284,728 15% 121%
Heat & Frost Insulators And Asbestos Workers $ 25,811 0% $ 29,753 0% 115% $ 32,228 0% 125%
Electronic Technicians $ 15,609 0% $ 15,609 0% 100% $ 24,198 0% 155%
Landscape Construction $ 55,938 1% $ 55,938 1% 100% $ 118,027 1% 211%
Telecommunication Technicians $ 31,261 0% $ 31,261 0% 100% $ 66,010 1% 211%
Tile Setters $ 9,699 0% $ 23,009 0% 237% $ 23,569 0% 243%
Fence Erectors $ 4,216 0% $ 4,216 0% 100% $ 11,513 0% 273%
Total $ 7,300,912 100% $ 8,173,875 100% 112% $ 8,658,104 100% 119%
23
OFM allowable escalation 111.17% 114.28%
24
12PROJECT SPECIFIC LABOR COST
INCREASES OVER TIME
Cumulative increases due to changes in
prevailing wages –
From bid to 9/1/2017 From bid to 9/1/2018
Labor cost 11.96% 18.59%
OFM allowable escalation 11.17% 14.28%
25
PROJECT SPECIFIC LABOR COST
INCREASES OVER TIME
Average annual increases due to change
in prevailing wages –
From bid to 9/1/2017 From bid to 9/1/2018
Labor cost 3.24% 5.93%
OFM allowable escalation 3.04% 2.98%
Solution: add 3% to all projects in the
pipeline.
26
13ENROLLMENT PROJECTIONS
HOW DOES THE STATE BOARD FORECAST
ENROLLMENT FOR CAPITAL PROJECTS?
Population: OFM/Census population projections by county and
age group
Enrollment: All fund sources but excludes DOC and Community
Service courses
Projection = Fall 2018 participation rates by county/age group
applied to OFM population projections by county/age group for
2028
28
14TYPES OF ENROLLMENT
Total enrollment projections are adjusted based on current
ratios of:
Type 1 FTE (day on-campus, excluding online) for
determining need for classrooms and labs
Type 2 FTE (day on-campus, including online) for
all other space types
We also breakdown Basic Skills, Academic & Workforce
Breakdown for the Capital Analysis Model
29
HOW ACCURATE HAS THE
STATE BOARD PROJECTIONS BEEN?
Enrollment is strongly correlated with population
Some variation from projections due to inaccurate population
projections
Some variation from projections due to changes in participation
rates
30
15PROJECTED CHANGE 2018-28
120%
118%
116%
114%
112%
110%
108%
106%
104%
102%
100%
31
ALTERNATIVE PROJECTIONS
Potential sources for alternative projections:
Local knowledge of business and development activity
More granular demographics or population projections
Research & Planning Council will provide colleges with
qualitative feedback on proposed alternatives
RPC will also provide qualitative feedback to scorers if a
proposal is submitted with an alternative projection
**REMEMBER**
There is a community of researchers and resources to help with
developing a strong argument for alternative projections.
32
16ENROLLMENT FORECAST EVALUATION RUBRIC
Below Expectations Meets Expectations Above Expectations
1 2 3 4 5
Accuracy of Type 1 Forecast is based on Calculation of FTE is off Forecast is based on
inaccurate calculation by an insignificant accurate calculation of
and Type 2 FTE. of FTE. amount. FTE.
Modification of Data for forecast is Data has mixture of Data for forecast uses Data for forecast has Data for forecast
derived indirectly from direct or original a small amount of had some modification comes from unchanged
source data original data source. sourced data that has derived or modified done to provide ease of or unmodified sources.
been in part modified. data. analysis.
Neutrality of data Data comes from Data is provided by an Data is provided by Data is provided by Data comes from fully
commercial or interest group or accountable, interested third party vendors, disinterested or
sources interested parties that professional society parties, such as cities, sourcing neutral, government sources.
have financial interest that has financial non-profits or other disinterested or
in the data. interest in the data. non-fiscally interested government sources.
group.
Length of Forecast has less than Forecast has 10 years Forecast has 15 years Forecast has 20 years Forecast has 25 or
10 years of historical of historical data. of historical data. of historical data. more years of historical
historical data data. data.
Statistical Forecast uses no Forecast relies only on Forecast uses single- Forecast uses Forecast uses a mix of
discernable statistical trend analysis. variate regression or multivariate or high trend, single-variate,
approach to analysis. non-parametric level trend analysis like non-parametric,
forecast approaches. Box-Jenkins or ARIMA. multivariate or high
level trend analysis.
Multiple statistical Forecast uses no Forecast uses a single Forecast uses two or Forecast uses four or Forecast uses four or
statistical approach. statistical approach. three statistical more statistical more statistical
approaches to approaches. approaches. approaches blended
forecast into a single forecast.
Model impacts Forecast makes no Forecast makes Forecast provides Forecast provides Forecast incorporates
account of possible minimal verbal note of adequate consideration adequate consideration possible positive and
positive or negative possible positive or of possible positive or of possible impacts negative impacts into
impacts on the model. negative impacts on negative impacts on with supporting the statistical model.
the model. the model. documentation or data. 33
BREAK
17IMPLEMENTING THE
2019-21 BUDGET
LARGE NUMBER OF MINOR PROJECTS
$143M in 363 projects – twice as much as we have every had
$160 M
$140 M
$120 M
$100 M
$80 M
$60 M
$40 M
$20 M
2005‐07 2007‐09 2009‐11 2011‐13 2013‐15 2017‐19 2019‐21
36
18GAPS BETWEEN DESIGN AND
CONSTRUCTION FUNDING
One half of the projects currently in design are not funded for
construction next biennium.
College Number Project 2017‐19 2019‐21 2021‐23
Wenatchee 30000985 Wells Hall Replacement $ 2,840,000 $ 29,531,000 $ ‐
Olympic 30000986 Shop Building Renovation $ 953,000 $ 7,652,000 $ ‐
Pierce Fort Steilacoom 30000987 Cascade Building Renovation ‐ Phase 3 $ 3,508,000 $ 31,592,000 $ ‐
South Seattle 30000988 Automotive Technology $ 2,501,000 $ 23,376,000 $ ‐
Bates 30000989 Medical Mile Health Science Center $ 3,238,000 $ 40,828,000 $ ‐
Shoreline 30000990 Allied Health, Science & Manufacturing $ 3,592,000 $ 36,642,000 $ ‐
Spokane Falls 30001458 Fine and Applied Arts Replacement $ 2,827,000 $ ‐ $ 35,663,000
Clark 30000135 North Clark County Satellite $ 5,688,000 $ ‐ $ 49,766,000
Everett 30000136 Learning Resource Center $ 4,015,000 $ ‐ $ 45,365,000
Grays Harbor 30000127 Student Services and Instructional Building $ 4,151,000 $ ‐ $ 41,460,000
North Seattle 30001451 Library Building Renovation $ 3,448,000 $ ‐ $ 28,579,000
Walla Walla 30001452 Science and Technology Building Replacement $ 1,156,000 $ ‐ $ 8,796,000
37
2020 SUPPLEMENTAL REQUEST
Due to OFM in September 2019
Update budgets for all projects not funded for construction
Start with 2019-21 or predesign C100
Adjust schedule for delay in funding
Add new costs imposed on project
Due from college in July
Re-request funding in the supplemental
State Board to adopt principles June 26, 2019
New alternative financing requests
Due from colleges by June 1, 2019
State Board to adopt request June 26, 2019
38
19ALTERNATIVE FINANCING
The COP sales are planned for January, June and October each year. Need to have bid
work a couple months before the sale.
If adding a request in the supplemental, earliest sale will be June 2020 with bid by
May 2020, last sale will be June 2021.
Once approved and sold the college can be reimbursed for qualifying expenses back
to the filing of an intent to finance with the Treasurer’s office.
You can get the Intent form and read more about the COP program here –
https://tre.wa.gov/local-program/
Our form is on the 2019-21 capital budget development web page.
Note we added a requirement for a title report due to a recent problem where we did
not have title of the underlying land where the improvements were to be made.
39
Outstanding COP Principal As of 25Mar19 Pending
District Equipment Real Estate State Backed 2017‐19 2019‐21 Total
Bates Technical College $ 562,524 $ ‐ $ ‐ $ ‐ $ ‐ $ 562,524
Bellevue Community College $ ‐ $ 56,105,000 $ ‐ $ ‐ $ ‐ $ 56,105,000
Bellingham Technical College $ ‐ $ 19,500,000 $ (18,525,000) $ ‐ $ ‐ $ 975,000
Big Bend Community College $ 125,000 $ 1,885,000 $ ‐ $ ‐ $ ‐ $ 2,010,000
Cascadia College $ ‐ $ ‐ $ ‐ $ 30,225,000 $ ‐ $ 30,225,000
Centralia College $ ‐ $ 2,555,000 $ ‐ $ ‐ $ ‐ $ 2,555,000
Clark College $ 385,000 $ 6,870,000 $ ‐ $ ‐ $ ‐ $ 7,255,000
Clover Park Technical College $ ‐ $ 37,565,000 $ (31,155,000) $ ‐ $ ‐ $ 6,410,000
Columbia Basin College $ 1,976,841 $ 1,795,000 $ ‐ $ ‐ $ 27,000,000 $ 30,771,841
Community Colleges of Spokane $ ‐ $ 16,395,000 $ ‐ $ ‐ $ ‐ $ 16,395,000
Community/Technical College System $ 32,350,000 $ ‐ $ ‐ $ ‐ $ ‐ $ 32,350,000
Edmonds Community College $ 299,112 $ 6,060,000 $ ‐ $ ‐ $ ‐ $ 6,359,112
Everett Community College $ ‐ $ 16,375,000 $ ‐ $ ‐ $ 10,000,000 $ 26,375,000
Grays Harbor Community College $ ‐ $ 955,000 $ ‐ $ ‐ $ ‐ $ 955,000
Green River Community College $ 10,721 $ 46,240,000 $ (17,105,000) $ ‐ $ ‐ $ 29,145,721
Highline Community College $ ‐ $ 4,675,000 $ ‐ $ ‐ $ ‐ $ 4,675,000
Lake Washington Technical College $ ‐ $ ‐ $ ‐ $ ‐ $ ‐ $ ‐
Lower Columbia College $ ‐ $ 30,540,000 $ (24,955,000) $ ‐ $ ‐ $ 5,585,000
Olympic Community College $ 222,164 $ ‐ $ ‐ $ ‐ $ ‐ $ 222,164
Peninsula College $ 86,498 $ 2,170,000 $ ‐ $ ‐ $ ‐ $ 2,256,498
Pierce College $ 2,260,000 $ 2,305,000 $ ‐ $ ‐ $ 2,831,000 $ 7,396,000
Renton Technical College $ ‐ $ 1,740,000 $ ‐ $ ‐ $ ‐ $ 1,740,000
Seattle Community College $ 880,000 $ 6,590,000 $ ‐ $ ‐ $ ‐ $ 7,470,000
Shoreline Community College $ 377,637 $ 35,760,000 $ ‐ $ ‐ $ ‐ $ 36,137,637
Skagit Valley College $ 95,481 $ 21,320,000 $ (20,350,000) $ ‐ $ ‐ $ 1,065,481
South Puget Sound Community College $ ‐ $ 22,515,000 $ ‐ $ ‐ $ ‐ $ 22,515,000
Tacoma Community College $ ‐ $ 9,995,000 $ ‐ $ ‐ $ ‐ $ 9,995,000
Walla Walla Community College $ 490,000 $ 2,155,000 $ ‐ $ ‐ $ 8,000,000 $ 10,645,000
Wenatchee Valley College $ 1,771,000 $ 7,200,000 $ ‐ $ ‐ $ 4,500,000 $ 13,471,000
Whatcom Community College $ ‐ $ 32,050,000 $ ‐ $ ‐ $ ‐ $ 32,050,000
Yakima Valley College $ ‐ $ ‐ $ ‐ $ ‐ $ 22,700,000 $ 22,700,000
40
Grand Total $ 41,891,979 $ 391,315,000 $ (112,090,000) $ 30,225,000 $ 75,031,000 $ 426,372,979
20RECENT STATE COP RATES
41
CONDITION SURVEYS
21NEW INFRASTRUCTURE
CONDITION SURVEY
Qualifying Infrastructure
Electrical, potable water, non-potable water, steam, sewer, natural
gas, storm water, fire protection, emergency access roads, and
communication work more than five feet outside of a building’s
foundation, unless it is connecting to a building with no other work
in the project in which case the infrastructure may terminate
inside the building.
Non-qualifying Infrastructure
Landscaping that is not disturbed by qualifying infrastructure
work, roads (except emergency access), driveways, parking lots
and walkways. 43
INFRASTRUCTURE
CONDITION SURVEY PROCESS
Between July 2019 and March 2020, State Board staff will visit
each campus and collect information about existing owned
infrastructure.
• Quantities – length, area, volume and capacity
• Locations
• Materials
• Ages
• Observable conditions & deficiencies
• Repair history
Deficiencies will be prioritized system wide for repair or
replacement in $34 million 2021-23 minor work list.
44
22Start part 2
45
23FACILITY CONDITION SURVEY
OVERVIEW
FACILITY CONDITION SURVEY
• Surveys have been scheduled Feb – Dec 2019
• “Preparation” documents have been provided with Outlook meeting
invite
• Facility Condition Survey Tool is available : sbctc.edu
• Results of the survey will be used to ask for repair funding in the 2021-
23 capital budget
• Building condition scores will be used for major capital project requests
48
24PROCESS
• The survey is completed roughly every two years at each college.
• All owned buildings are evaluated and scored based on their condition.
• Building, roof and site deficiencies are evaluated and scored.
• Special focus on accessibility compliance for colleges that are included
in the Office for Civil Rights audit targeting plan.
• Each report provides a snapshot of the capital condition of a college as
well as informative comparisons related to their maintenance effort.
• All college deficiencies are ranked by score. The highest ranking
deficiencies are included in the next capital budget proposal as minor
works projects.
• The building condition scores will be used by colleges that request a
major capital project (worth 15% of major project proposal score).
• Minor works funding becomes available 2 years after survey (on
average).
49
REVIEW PLAN FOR OFFICE OF CIVIL RIGHTS COMPLIANCE
25PREPARING FOR THE SURVEY
• Review Pre-survey questions (college use only)
• Review State Board guide to identify deficiencies
• Use the Facility Condition Survey tool to enter data
http://www.sbctc.edu/colleges-staff/programs-services/capital-budget/facility-assessment.aspx
• Evaluate and obtain supporting documentation for deficiencies that are
not observable.
More examples: underground utilities, obsolete safety equipment with
verification that it is no longer supported, moisture damage report, etc
51
SITE VISIT
1
• Initial interview with facility director and business officer
Update facility condition and planning data
Discuss currently funded and previously identified minor works projects
Review and update deficiency and maintenance management data provided by college
2
• Survey building and site conditions
Inspect and score buildings
Review and score deficiencies
3
• Exit interview
Go over survey highlights
Overview of building and site score changes
Overview of deficiencies that will be included in the survey report
52
26DRONE HELP DURING FCS
DRONE HELP DURING FCS
• Prior to survey, consider advantages of drone inspections
• Hard to reach locations (interior and exterior)
• Unsafe conditions
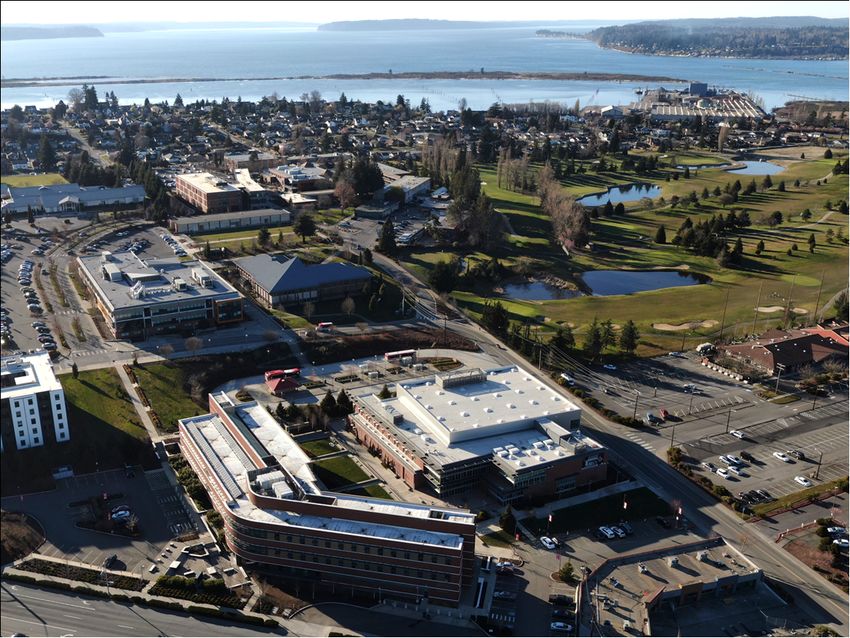
• Useful for building or overall campus images or video
27CONSTRUCTION RECORD
28Questions?
57
MINOR WORKS PROJECTS
29MINOR WORKS PROJECT TYPES
Repair Improvement
59
MINOR WORKS PROJECT TYPES
Repairs
• Typical capital budget appropriations
Roof Facility Site URF (RMI)
• Funds must be used to repair existing assets
• Acquired buildings qualify for repair funds after 6 years of ownership (no minimum for constructed
buildings)
• Up to 25% of project can be used for related improvements
• $59.1 M in 2019-21 (Plus $16.5 M in postponed projects)
• 2021-23 budget target will be 10% higher
60
30MINOR WORKS PROJECT TYPES
Repairs
Historical level of repair funding:
Funded Identified Ratio
2013 $35,735,000 $57,176,000 63%
2015 $39,306,000 $88,008,000 45%
2017 $43,172,000 $94,771,000 46%
• To “right-size” the FCS effort, $2M to $3M in high priority
repairs should be identified for an average size college.
This is roughly 2x the expected funding level.
61
MINOR WORKS PROJECT TYPES
Improvements
• Program improvement projects
• Every college receives funding
based on size and enrollment
• Funds can be used for repairs or
improvements to existing space
(new area not allowed)
• No operating impact
• $39.8 Million in 2019-21 (some
postponed)
• $32.2 Million in 2021-23
• 2021-23 requests due March 2020
62
31PRELIMINARY MINOR PROGRAM TARGETS (2021-23)
College Minor Program College Minor Program
Bates $ 1,067,000 Peninsula $ 584,000
Bellevue $ 1,456,000 Pierce Fort Steilacoom $ 886,000
Bellingham $ 629,000 Pierce Puyallup $ 605,000
Big Bend $ 817,000 Renton $ 857,000
Cascadia $ 502,000 Seattle Central $ 1,493,000
Centralia $ 654,000 Seattle North $ 1,156,000
Clark $ 1,258,000 Seattle South $ 1,010,000
Clover Park $ 844,000 Shoreline $ 912,000
Columbia Basin $ 1,102,000 Skagit Valley $ 888,000
Edmonds $ 1,065,000 South Puget Sound $ 813,000
Everett $ 1,072,000 Spokane $ 1,674,000
Grays Harbor $ 643,000 Spokane Falls $ 1,083,000
Green River $ 1,093,000 Tacoma $ 947,000
Highline $ 1,052,000 Walla Walla $ 963,000
Lake Washington $ 824,000 Wenatchee Valley $ 793,000
Lower Columbia $ 833,000 Whatcom $ 681,000
Olympic $ 912,000 Yakima Valley $ 1,055,000
Distribution based on Fall 2018 enrollment and 2018 inventory report to OFM
Final amounts to be based on Fall 2019 enrollment and 2019 inventory report to OFM
63
MINOR WORKS PROJECT CHANGES
What can you change?
• Move funds between existing projects (fast)
• Re-purpose funds to add new projects (slower)
How to get it done:
• Minor works project change tool : sbctc.edu
• Funds cannot be moved between repair
appropriations (roof, facility, site)
• Program project funds are more flexible
• Program project request form
64
3265
66
3367
68
3469
70
3571
72
3673
Minor Works Fund Sharing
• Project funds that cannot be spent by the end of the biennium
should be offered to other colleges with funding shortfalls.
• Provide notification to the State Board of any excess funds as
soon as possible. Excess funds must be reported by June 28th.
• The State Board will equally distribute excess funds to colleges
that have had to spend local funds to supplement a minor
project.
74
37Minor Works Schedules – Start EARLY!
• BE READY - All minor works projects included in the proposed
budget are expected to be funded (project list included in FCS
tool). 1
• Start planning before funds become available. Right after the
start of the biennium, allocations can usually be set up for
projects within a week.
• New To help track early progress, the state board will
automatically receive copies of all PWRs from DES.
75
Questions?
76
38HOW IS IT CALCULATED?
Factors Approx Share of
Available Dollars
Total GSF of owned buildings 35%
Total State supported FTE 35%
Total GSF buildings > 25 years old 30%
79
PRELIMINARY URF TARGETS
College URF (RMI) College URF (RMI)
Bates $ 623,000 Peninsula $ 226,000
Bellevue $ 1,018,000 Pierce Fort Steilacoom $ 488,000
Bellingham $ 264,000 Pierce Puyallup $ 253,000
Big Bend $ 410,000 Renton $ 455,000
Cascadia $ 168,000 Seattle Central $ 989,000
Centralia $ 286,000 Seattle North $ 701,000
Clark $ 819,000 Seattle South $ 593,000
Clover Park $ 449,000 Shoreline $ 515,000
Columbia Basin $ 685,000 Skagit Valley $ 489,000
Edmonds $ 656,000 South Puget Sound $ 435,000
Everett $ 665,000 Spokane $ 1,156,000
Grays Harbor $ 274,000 Spokane Falls $ 650,000
Green River $ 702,000 Tacoma $ 550,000
Highline $ 645,000 Walla Walla $ 545,000
Lake Washington $ 428,000 Wenatchee Valley $ 404,000
Lower Columbia $ 431,000 Whatcom $ 320,000
Olympic $ 523,000 Yakima Valley $ 634,000
Preliminary 2021-23 distribution based on Fall 2018 enrollment and 2018 inventory report to OFM
Final amounts to be based on Fall 2019 enrollment and 2019 inventory report to OFM 80
40URF - Allowable Expenditures
Emergency project matching funds
Code / Regulatory compliance
Emergent / deferred capital repairs
Supplemental funding for capital repair
81
URF - Unallowable Expenditures
Maintenance & Operations
Enterprise Operations
Salaries & Benefits (some exceptions)
Instructional Equipment
Equipment / Furnishings
Leased Facilities
Parking
Student Government
Energy Conservation
Telecommunications / IT
82
41EMERGENCY AND
HAZARDOUS MATERIALS
POOLS
83
These pools are part of our
Minor Works – Preservation appropriation
84
42SYSTEM-WIDE EMERGENCY FUNDS
The State Board manages a pool for college emergencies. For this pool the definition of an
“emergency“ is:
I. Catastrophic loss or failure* of a building or system.
II. When a capital repair cannot be deferred into the next biennial budget cycle.
III. When work cannot be accomplished through URF and exceeds college’s ability to
respond with available minor work preservation funding.
IV. When delays in repair would cause costly collateral damage.
V. When large portions of a college’s programs would be placed at risk.
VI. When life safety and property risks are too high to leave un-addressed.
* Catastrophic loss or failure often presents an immediate threat to life or property
85
RESTRICTED USE OF EMERGENCY FUNDS
System-wide emergency funds cannot be used to:
I. Augment a non-emergency local-capital project.
II. Augment another state-funded project.
III. Construct a repair or replacement that is deferrable to the next
legislative-funding opportunity.
FUNDING IS LIMITED
To minimize the college’s risk, we will initially allocate the funding based on
the estimated cost and then adjust to actuals as realized. The maximum
amount from either the Emergency or HazMat pool is $500,000 per
occurrence.
86
43HOW TO REQUEST EMERGENCY FUNDING
Take care of the immediate need for people and property
Notify SBCTC of your emergency situation as a “heads up”
Complete the Emergency Assistance Request form to help us evaluate the
need for emergency funding and calculate the share of project expenses.
87
SBCTC will assign a
project number for
you to post all your
expenses. When the
project is complete,
give final expenditure
info to SBCTC for final
campus/SBCTC
distribution.
88
44HOW TO REQUEST A PUBLIC WORKS EMERGENCY
Not all emergencies require a public works emergency declaration. For instance,
an unexpected hazardous material exposure during a planned project may be
resolved with the current contractor on site through a field authorization or
change order. An emergency declaration is not required in order to access
SBCTC Emergency or Hazardous Materials funding.
Secure life, limb, and property
Campus president declares emergency in writing
Work with your DES E&AS project manager to expedite the services from
consultants and contractors
Notify SBCTC of emergency event and gather supporting documents of the
capital costs associated with the emergency
89
SYSTEM-WIDE HAZARDOUS MATERIAL FUNDS
The State Board also manages a pool for hazardous materials
encountered at the colleges. The criteria is the same as for the
emergency pool except there is no college deductible.
90
45MAJOR PROJECTS
ALLOTMENT PHASES
46WASHINGTON ARTS COMMISSION
• RCW 43.17.200: Every major project is appropriated .5% of escalated
MACC to be used for Art in Public Places
• Allocation will appear in SBCTC project list
93
94
47• Washington Arts Commission staff will work directly with the college to
identify regionally relevant artists and projects
• Costs for administration, design, construction, and maintenance are the
responsibility of Washington Arts Commission
• These assets are inventoried and reported by the commission
• Any buildings scheduled for demolition that contain AIPP pieces should
be reported to the Commission for disposal or removal
• Major project funding requests will include 10% of the Artwork budget
during Design phase. All other costs to be incurred during Construction
phase
• Engage with the commission early!
95
PREDESIGN
• State Board requests an allotment for Predesign as soon as
Design phase appropriations are approved.
• No action needed by the college.
96
48• College submits Predesign document to State Board capital staff for review
prior to OFM submission
• OFM reviews and approves Predesign
• State Board requests allotment of remaining Design phase funds based on
project schedule
97
CONSTRUCTION PHASE
• State Board requests the Construction phase allotment after legislature
approves capital budget and supporting allotment materials are collected
• Allotment based on estimated expenditures for current biennium based on
project schedule
• Artwork portion will be listed in the State Board capital projects
• Construction allotment does not include Furniture, Fixtures, and
Equipment
98
49FURNITURE, FIXTURES, AND EQUIPMENT
• A listing of all FF & E to be purchased including part numbers and
website links
• Summary of percentage of FF & E intended to be procured from
Correctional Industries, if known at time of allotment request
• An affirmation statement from the agency that the FF & E purchases
will remain within the appropriation amount, and that all FF & E
required for start-up and operation of the new facility is included in the
FF & E purchases
99
WHAT QUALIFIES AS FF & E?
Allowed Not Allowed
• Built-in equipment permanently • Consumable inventories (office,
attached to building janitorial, chemical supplies)
• Fixed equipment attached to • Custodial, grounds, office
building and contributes to equipment
facility’s function • Glassware
• Movable equipment necessary
• Software unless component of
for the function of the building
specialized equipment
and remains in the building
• Spare or replacement parts
• Average useful life 13 years or
more • Moving furniture, equipment, and
supplies
100
50FF&E Template
101
Components needed for allotment packets
102
51for 2015‐17 PREVIOUS SCORES
Score Rank
89.784 1
87.888 2 for 2017‐19 for 2019‐21 for 2019‐21
84.305 3 Score Rank Score Rank Score Rank
82.535 5 80.150 1 93.480 1 82.020 13
81.853 4 78.607 2
93.070 2 81.900 14
81.684 7 77.986 3
77.755 4
88.720 3 81.510 15
80.376 6
76.411 5 87.950 4 80.640 16
80.304 8
78.947 9 75.227 6 87.260 5 80.300 17
78.872 10 73.183 7 86.970 6 79.760 18
77.599 11 72.368 8 86.120 7 77.450 19
76.320 12 71.786 9 84.610 8 76.500 20
72.214 13 83.660 9 75.420 21
68.411 14 82.800 10 73.310 22
67.614 15 82.170 11 73.130 23
67.380 16
82.080 12 71.200 24
64.947 17
63.449 18
82.020 13 62.250 25
61.298 19 103
UPDATED SCORING CRITERIA
1. Incorporated definition of infrastructure eligible for our
budget request per the AY1718 infrastructure task force
recommendation.
2. Incorporate new criteria and guidance for scoring per the
AY1718 “built environment” task force recommendations
with examples.
3. Removed criteria that are not necessary for submitting the
budget request and are not likely to affect the project cost.
Separate handout for criteria.
104
52PENDING UPDATE OF SCORING
CRITERIA AND WORKSHEET
1. Update points and incorporate new criteria.
2. Update reasonableness of cost standard with new OFM
Higher Ed Study results due this month.
3. Update escalation with latest Global Insight forecast.
4. Notify BAC list serve when posted on web site
105
EVERY MAJOR PROJECT SCORED
ON A 100 POINT SCALE
Overarching Criteria
Applies to every project. Has 23 potential points.
Matching Infrastructure Renovation Replacement New Area
Criteria Criteria Criteria Criteria Criteria
For projects For projects with For projects For projects that For projects that
with non-state non-building that include will demolish increase the
funding. infrastructure. renovation of existing space square footage
existing space. and replace it of a campus.
with new
construction.
Category-specific criteria always totals 77 potential points.
106
53CURRENT REQUEST AND PIPELINE
MANAGEMENT PRACTICES
• Minor projects are prioritized above major projects in our
request.
• We are growing our minor project funding level by 10% each
biennium.
• We are adding a new $34 million minor project category for
infrastructure repairs in 2021-23.
• Once a major project is added to the pipeline it remains until
it is funded for construction.
• New major projects are added below existing projects in the
pipeline in rank order from their selection.
Continued on next slide 107
CURRENT REQUEST AND PIPELINE
MANAGEMENT PRACTICES - CONTINUED
• Major projects are constructed in the order they were added
to the pipeline.
• We request design-phase funding the biennium before we
plan to construct each project.
• The design-phase requests are woven into the construction-
phase requests such that the same level of funding that
funds the design could fund the construction in the
subsequent biennium.
• Once they enter the pipeline, major project costs go up with
OFM approved cost escalation and new requirements.
108
54WHO IS NOT IN THE PIPELINE TODAY
AND AFTER JUNE 30TH?
College Last Major Construction-phase Funding
Big Bend 2017-19 for Prof-Tech Education Center
Clover Park 2017-19 for Advanced Manufacturing Center
Green River 2013-15 for Trades & Industry Building
Yakima 2013-15 for Palmer Martin Replacement
South Puget Sound 2011-13 for Learning Resource Center
109
SELECTION OF NEW MAJOR
PROJECTS FOR 2021-23 CAPITAL REQUEST
Holding a limited competition for new major projects to enter the pipeline in 2021-23.
Each of the five colleges not currently in the pipeline can submit one proposal. Those colleges are:
1. Big Bend Community College 4. Yakima Valley College
2. Clover Park Technical College 5. South Puget Sound Community
3. Green River College College
Major project proposals will be due mid-December 2019.
Major project proposals will be scored by a task force with representatives from WACTC, WSSSC,
BAC, IC, OFC, and state board staff with oversight from ACT.
No one on the scoring task force may have worked at one of the five colleges submitting a proposal.
The proposals will be evaluated using the AY1819 capital task force recommended criteria by April
2020.
All proposals that score 70 points or more will be added to the pipeline in rank order for construction
after the projects currently in the pipeline. 110
55NEXT STEPS
2019
May 2nd SBCTC adopts criteria and rules for 2021-23 major project selection
May 9th 2021-23 budget development workshop at Columbia Basin – Richland
May 28th 2021-23 budget development workshop at Green River
Jun Colleges begin development of 2021-23 capital requests
Jun 26th SBCTC adopts guidance for 2020 supplemental request
Jul Colleges update major project cost estimates for 2020 supplemental
Sep SBCTC staff submit 2020 supplemental to OFM and legislature
Dec Colleges submit major projects requests for scoring
2020
Jan Legislature convenes for consideration of supplemental budget
Feb Major project scoring complete
Mar Colleges submit minor capital program requests
Apr WACTC recommends 2021-23 capital request to State Board
May SBCTC adopts 2021-23 capital request
Jun Colleges update major project cost estimates
Sep SBCTC staff submit 2021-23 request to OFM and legislature
Except where otherwise noted, this work is licensed under CC BY 4.0.
56You can also read