2021 Half Year Report incorporating Appendix 4D - Rance Chadwick Multi-Skilled Operator Lead - Origin Energy
←
→
Page content transcription
If your browser does not render page correctly, please read the page content below
2021 Half Year Report
incorporating Appendix 4D
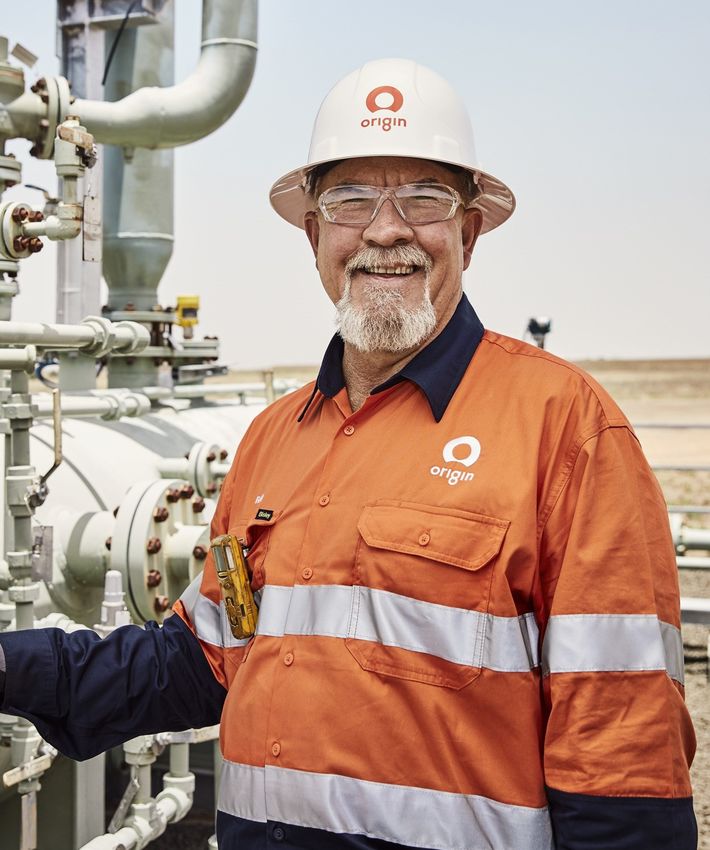
Rance Chadwick
Multi-Skilled Operator Lead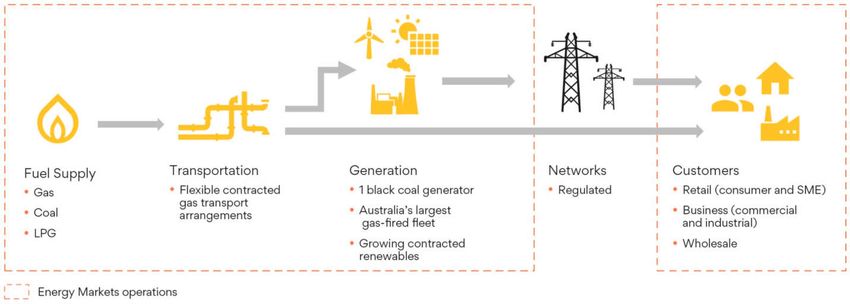
Appendix 4D

Origin Energy Limited and its Controlled Entities

Results for announcement to the market

31 December 2020

                                                                                                                           31 December 2020           31 December 2019
Total Group Revenue ($m)                                                                            down 10% to                           6,068                      6,728
Profit for the period attributable to members of the parent entity ($m)                             down 98% to                                13                      599

                                                                                                                           31 December 2020                30 June 2020
Net tangible asset backing per ordinary security1                                                   down 12% to                              $3.41                     $3.86

                                                                                                                                                       Franked amount
                                                                                                                                 Amount                  per security
Dividends                                                                                                                      per security           at 30 per cent tax
Interim dividend determined subsequent to 31 December 2020                                                                      12.5 cents                     nil
Previous corresponding period (31 December 2019)                                                                                  15 cents                  15 cents
Record date for determining entitlements to the dividend                                                                                     4 March 2021
Dividend payment date                                                                                                                     26 March 2021

1 The calculation of net tangible assets excludes lease related right-of-use assets of $448 million (Jun 2020: $467 million), categorised under Property, Plant & Equipment on
  balance sheet, as these are not considered tangible in nature.

Brief explanation of any of the figures reported above or other item(s) of importance not previously released to the market.
Refer to the attached Directors' Report and Operating and Financial review for explanations.
Discussion and Analysis of the results for the year ended 31 December 2020.
Refer to the attached Directors' Report and Operating and Financial Review for commentary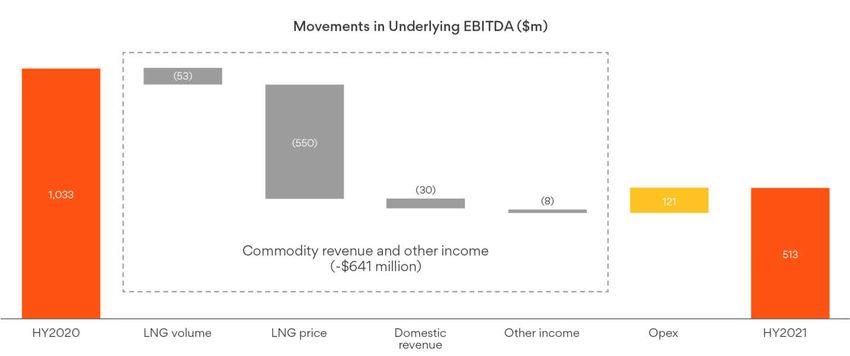
1

Contents

About Origin                               2

Where We Operate                           3

Operating and Financial Review            4

Directors’ Report                         31

Lead Auditor’s Independence Declaration   32

Interim Financial Statements              33

Glossary and Interpretation               62
2                                                                                  Origin Energy Interim Report 2021

About Origin

    Leading integrated                     4.2 million                           5,200
    energy company                         customer accounts                     employees

    Listed on the Australian Securities    Electricity, gas and LPG customers    Inclusivity in the workplace,
    Exchange in 2000                       across Australia and the Pacific      leading parental support

    Five-pillar approach                   Powering                              37.5% interest in Australia
    to decarbonisation                     Australia                             Pacific LNG

    Australia's first science-based        7,500 MW generation portfolio,        Exporting to Asia, supplied ~30%
    emissions targets                      including 1,400 MW owned              of Australian east coast gas
                                           and contracted renewables             demand in CY2020
                                           and storage

    Supporting                             Driving future                        Exploration and
    Australian communities                 energy innovation                     development

    Over its 10 years, the Origin Energy   Investing in new technology, start-   Positions in three large prospective
    Foundation has contributed more        ups and future fuels                  onshore basins - the Beetaloo,
    than $27 million                                                             Canning and Cooper-Eromanga
3
Where We Operate
Beetaloo
Beetaloo
Basin
Browse Basin
Browse
Basin Beetaloo
Basin Basin
Browse
Beetaloo
Basin
Basin
Browse
Basin
Canning
Canning
Basin
Basin
Canning
Basin
Canning 637k Gladstone
Basin 637k Gladstone
LNG Export
180k LNG Export
180k 637k Gladstone
Bowen/ LNG Export
242k Cooper 180k
637k
Bowen/
Surat Gladstone
Brisbane
242k Cooper
Eromanga Surat
basins
basins Bowen/ Brisbane LNG Export
213k Eromanga
Basin 180k
213k 242k Basin Cooper Surat
basins Brisbane
Eromanga Bowen/
213k
242k BasinCooper 1181k Surat
Brisbane
Eromanga1181k basins
213k Basin 343k
343k 1181k
14k 343k 1181k
14k
Sydney
14k 343k Sydney
14k Adelaide
Sydney
Adelaide
Sydney
Adelaide Melbourne
Melbourne
Adelaide Melbourne 555k
555k
482k
Melbourne
482k 555k
482k
555k
South East Queensland
South East Queensland Hobart
482k
South East Queensland
Gladstone
Hobart
Gladstone Hobart
South East Queensland
Gladstone Hobart
Bowen/
Bowen/ Gladstone
Surat
Surat
basinsBowen/
basinsSurat
Bowen/
basins
Surat
basins Exploration & production acreage Generation
Exploration & production acreage Generation
Origin upstream acreage Gas
Brisbane Exploration
Origin upstream& production
acreage acreage GasGeneration
Brisbane APLNG upstream acreage Pumped hydro
APLNG Origin upstream
Exploration
upstream acreage acreage
& production
acreage Pumped Gas
Generation
hydro
Brisbane Production facility Solar (contracted)
APLNG upstream
Origin
Production upstream
facility acreage
acreage Pumped
Gas hydro
Solar (contracted)
Brisbane APLNG pipeline Wind (contracted)
APLNG Production facility
APLNG upstream
pipeline acreage Wind Solar (contracted)
Pumped
(contracted) hydro
Coal
APLNG pipelinefacility
Production Coal Wind (contracted)
Solar (contracted)
Under construction
APLNG pipeline UnderCoal
construction
Wind (contracted)
Under construction
Coal
LPG seaboard terminal
LPG seaboard
Underterminal
construction
LPG seaboard terminal
Pacific countries LPG Electricity customer accounts
Pacific countries LPG ElectricityLPG
customer accounts
seaboard terminal
Natural gas customer accounts
Pacific countries
RabaulLPG Electricity customer accounts
Natural gas customer accounts
Rabaul
Pacific countries LPG Natural gas customer
Electricity accounts
customer accounts
Lae Rabaul
Lae Natural gas customer accounts
Port Moresby Lae Rabaul
Port Moresby Honiara
Lae Honiara
Port Moresby
Apia
Honiara Apia
Port Moresby Labasa
Santo
Honiara Labasa Pago Rarotonga
PagoApia
Santo Pago Pago Rarotonga
Lautoka Labasa
Port Vila
Santo Lautoka ApiaPago Rarotonga
Pago
Port Vila Suva Labasa
Lautoka
Suva
PortSanto
Vila Pago Pago Rarotonga
Lautoka Suva
Port Vila
Suva4 Origin Energy Interim Report 2021
Operating and Financial Review
For the half year ended 31 December 2020
This report forms part of the Directors’ Report.
1 Highlights
Sustainability performance
Getting energy right for our customers
Our customers are at the heart of everything we do. We are committed to Customers
providing ‘good energy’ that is reliable, affordable and sustainable.
• Support during COVID-19 with a commitment to not disconnect or default
18,100
list retail customers who contact us, until at least 31 March 2021
• Ongoing customer support with payment extensions and flexible payment
plans through our Power On hardship program
• Spike (demand response) growing to ~28k customers customers completed our
• Lower energy prices passed through to our customers, including 11 per cent PowerOn hardship program
average reduction in Victorian residential prices from 1 January 2021
in HY2021
• APLNG supplied ~30 per cent of east coast gas demand in CY2020
Getting energy right for our communities
We respect the rights and interests of the communities in which we operate, Communities
and consult with them to understand and manage our impact.
• Regional procurement increased to 18 per cent from 17 per cent in HY20201
• Continued engagement with Traditional Owners (TOs) in the Beetaloo,
including completing sacred site clearance surveys, hosting our TOs on-site
during fracture stimulation operations and annual on-country meetings 18%
• $4.9 million direct and indirect spend with Aboriginal and Torres Strait regional procurement as a %
Islander businesses in HY2021, up from $2.0 million in HY2020
of total procurement spend, up
• Our employees volunteered over 4,800 hours through the Origin Energy
from 17% in HY2020
Foundation’s Give Time Volunteer program during the half year period
• Released our first Modern Slavery Statement in August 2020
Getting energy right for the planet
We unequivocally support the Paris Agreement to limit the world’s temperature Planet
rise to well below 2°C above pre-industrial levels and pursue efforts to further
limit this increase to 1.5°C.
38 MW
• Solar installations increased by 47 per cent to 38 MW in HY2021
• New short term emissions target linked to executive remuneration
• Commenced plans to update Origin's emissions reduction targets to a
1.5°C pathway residential and business solar
• Green hydrogen and ammonia collaborations and projects underway installs, up 47% from 26MW
• Progressing plans for a battery at Eraring with capacity of up to 700MW in HY2020
over three stages, with expression of interest to supply and install issued
• Joined EV100, a global initiative to accelerate the uptake of electric vehicles
Our people
Our people are one of our greatest strengths. Having a diverse and inclusive People
workplace is key to creating a culture where people thrive, contributing to the
success of our business.
2.8
• Continued support for our people and their wellbeing during COVID-19 and
now transitioning to hybrid ways of working
• TRIFR of 2.8 at December 2020, compared to 2.6 at June 2020. We are
enhancing our focus on HSE learning to prevent serious harm
• 32 per cent of women in senior roles, consistent with June 2020 TRIFR (rolling 12 months)
• Launched the Good Energy Moments internal recognition platform compared to 2.6 at June 2020
• Origin named Australia’s Best workplace to Give Back in 2021 for the
second year in a row, and awarded Silver in 2020 Workplace Giving
Excellence Awards2,3
• Origin certified a Great Place to Work by the Great Place to Work Institute
1
HY2020 regional procurement spend adjusted from previously reported 14 per cent to reflect inclusion of indirect spend.
2
In GoodCompany’s list of the Top 40 Best Workplaces to Give Back.
3
Workplace Giving Australia Awards, in the “Best Employer Response to a Crisis" category.Operating and Financial Review
5
Financial performance
Underlying ROCE
Statutory Profit Underlying Profit (12 month rolling)
599
528 8.3%
6.8%
224
13
HY20 HY21 HY20 HY21 HY20 HY21
Free Cash Flow Adjusted Net Debt Interim Dividend
680 655
5,158
12.5 cps
4,698
Unfranked
HY20 HY21 Jun-20 Dec-20
(34% of HY2021 Free Cash Flow)
Lease liabilities
HY2021 was characterised by the ongoing impacts of the COVID-19 pandemic on energy demand and prices across our key commodities:
electricity, natural gas and oil. The impact in domestic energy markets has been exacerbated by mild summer weather, continued growth in
renewables and regulatory uncertainty.
Underlying Profit was lower at $224 million with Energy Markets impacted by lower wholesale prices, one-off network costs, roll-off of legacy
contracts and increased amortisation expense. Earnings from APLNG were impacted by a lower realised oil price, partially offset by gains in
oil hedging and lower interest expense. Statutory Profit of $13 million reflected non-cash unrealised losses on fair value and FX movements
and costs relating to a decision to defer the surrender of large-scale generation certificates (LGCs).
During the period our operations continued to perform reliably and efficiently. Our generation fleet met all demand requirements with minimal
unforced outages. APLNG responded swiftly to recovering market demand with record production in the December 2020 quarter. APLNG
also delivered record low capital and operating expenditure driven by improved field performance and ongoing operational efficiencies. Oil
prices have recovered from lows in April 2020, however because of the pricing lag in APLNG’s oil-linked contracts, more recent prices will
be realised in the second half of FY2021.
Strong Free Cash Flow of $655 million was driven by a high cash conversion in Energy Markets due to lower working capital requirements,
$265 million cash distributions from APLNG, lower capital expenditure, and lower interest and tax payments. This enabled Adjusted Net
Debt to reduce by $460 million to $4.7 billion while allowing for investment in future growth and dividends to shareholders. Adjusted Net
Debt/Adjusted Underlying EBITDA (annualised) was 2.0x, the low end of our 2.0-3.0x target range.
Our strategic partnership with Octopus Energy to radically transform our retail operations is progressing with 51,000 customer accounts
migrated to the new platform by late 2020. Octopus continues its growth trajectory, announcing a new partnership with Tokyo Gas and
entry into the Japanese market, providing Origin with exposure to these growth opportunities through our 20 per cent shareholding in
Octopus Energy.
We progressed upstream exploration and appraisal in the Beetaloo and Cooper-Eromanga Basins and in late 2020 we announced a farm in
to seven permits in the prospective Canning Basin.6 Origin Energy Interim Report 2021
Energy Markets performance
Underlying EBITDA Operating cash flow Underlying ROCE
(12 month rolling)
$635M $756M 8.7%
Down $88m or 12% vs HY2020 Up $53m vs HY2020 with cash Down 1.5% vs HY2020
to EBITDA conversion of 119%
Cost to serve Customer accounts Retail X
$254M 4,240k 51k
Down $13m or 5% vs HY2020 Including electricity, gas, First wave of customer accounts
broadband and LPG migrated to the new Kraken platform
The impacts of COVID-19 on energy demand, combined with milder weather and increased renewable penetration, has contributed to a
decline in wholesale energy prices. Energy Markets Underlying EBITDA reduced in HY2021 primarily due to these lower prices flowing
through to customer tariffs, as well as increased network costs not recovered in regulated tariffs and the roll-off of certain gas transport
capacity sales contracts. This was partially offset by lower portfolio cost of energy and continued savings in cost to serve. Operating cash
flow increased in the period, achieving an EBITDA to cash conversion rate of 119 per cent. Despite the challenges posed by COVID-19, our
operational performance remains strong with minimal unforced generation outages and delivery of our retail cost out program is on track.
Our peaking generation portfolio is well positioned for the energy transition and we continue to explore opportunities that would further
improve our flexibility and capacity, including grid-scale storage, pumped hydro and fast-start gas. We are also changing the role of Eraring
to better position it for increasing renewables. While current market and policy conditions make investment challenging, our longer-term
view remains that as coal generation exits, new firm and flexible generation capacity will be required to complement increasing renewable
generation. We will look to partner with governments or other players as opportunities arise.
Our gas portfolio remains a strength with scale to contract from major supply fields and commit to significant transport and storage capacity,
providing us flexibility to move gas to where it is needed most. We are actively exploring options to incorporate new gas supply and capacity
into our portfolio over the longer term.
Our retail transformation program is on track with a focus on leading in customer experience at the lowest cost, growing new revenue streams
and offering simplified, rewarding and flexible products. Our strategic NPS was +5 in the month of December 2020 and we continue to
provide support to customers impacted by COVID-19 with payment extensions, our hardship program and a pause on credit default listing.
We are on track to deliver cost savings of $100 million by FY2021 with $85 million realised since FY2018.
Retail markets remain competitive, however with our disciplined approach we held the number of overall customer accounts relatively stable
and maintained a churn rate of 4.4 per cent below the market. We continue to see growth in Community Energy Services (CES), Solar, Storage
and Broadband.
Our strategic partnership with Octopus Energy aims to accelerate our strategy to deliver a superior customer experience at low cost, while
opening up future growth opportunities. We have established a standalone business (Retail X) to undertake a bottom up build of Octopus’
operating model, technology platform (Kraken) and distinctive culture. We migrated 51,000 customer accounts to the Kraken platform in
HY2021 and are targeting capital and operating cost savings of $100 - $150 million by FY2024.
In December 2020, we announced an additional investment of ~$65 million in Octopus Energy to maintain our 20 per cent equity share
following a partnership between Octopus and Tokyo Gas that will see the launch of an Octopus branded retailer into the Japanese market.
Tokyo Gas will also invest US$200 million for a 9.7 per cent equity stake alongside Origin. The transaction reflects a material value uplift in
Octopus Energy since our initial investment, evidencing the company’s strong performance and impressive growth trajectory.Operating and Financial Review
7
Integrated Gas performance
Underlying EBITDA Cash distributions Underlying ROCE
from APLNG (12 months rolling)
$566M $265M 5.6%
Down $340m or 38% vs HY2020, Down $255m or 49% vs HY2020 Down 2.8% vs HY2020
Underlying EBIT down $124m
APLNG Average realised LNG price Opex and capex/GJ
production (37.5%)
US$5.5/
133 PJ $2.9/GJ
MMBTU
Down 1% vs HY2020 Down 43% vs HY2020, 17% improvement vs HY2020
down 46% in A$ terms at $7.2/GJ
APLNG delivered stable production in HY2021 despite curtailing production in the first quarter in response to lower demand. The ramp up to
record production in the second quarter demonstrated APLNG's ability to respond to changes in market demand with strong well recovery
post curtailment and continued improvement in utilisation of processing capacity and facility reliability.
Total APLNG capital and operating expenditure was at a record low, decreasing by more than $500 million compared with HY2020. This was
driven by improved field performance enabling lower gas purchases and reduced development activity with fewer drilling rigs, along with
lower infrastructure spend, as well as lower royalties and tariffs and exploration spend.
Despite this strong operational performance at APLNG, Integrated Gas Underlying EBITDA reduced due to lower APLNG earnings primarily
as a result of lower realised oil prices on contracted LNG, partially offset by oil hedging gains.
APLNG matched its previous operated daily production record of 1,614 TJ/day on two occasions and delivered 64 contract and spot LNG
cargoes, with strong demand expected under long term contracts for CY2021.
Other highlights across Integrated Gas during the period included:
• fracture stimulation and initial flowback and production testing undertaken at the Kyalla-117 well in the Beetaloo Basin with encouraging
results that met the objective to flow liquid-rich gas. Further work is underway to enable continuous unassisted production before
commencing an extended production test during the dry season with results expected in Q4 FY2021;
• drilling the Obelix-2 vertical exploration well to test the maturity of the Toolebuc Formation in the Cooper-Eromanga Basin, with log and
core data currently being evaluated;
• announcing a farm-in with Buru Energy for a 40-50 per cent equity share in seven permits in the prospective Canning Basin where Origin
will fund an estimated $35 million work program over two-years;
• undertaking a number of renewable fuel partnerships and projects, including a green hydrogen export project in Townsville, a feasibility
study into an export scale green ammonia plant in Tasmania’s Bell Bay, and a green hydrogen project with Jemena for the Western Sydney
Green Gas Project.8 Origin Energy Interim Report 2021
2 FY2021 guidance
Guidance is provided on the basis that market conditions and the regulatory environment do not materially change, adversely impacting on
operations. Considerable uncertainty exists relating to potential ongoing impacts of COVID-19 and this guidance is subject to any further
material impact on demand and customer affordability.
FY20 FY21 previous guidance FY21 updated guidance
Energy Markets Underlying EBITDA A$m 1,459 1,150-1,300 1,000-1,140
Integrated Gas - APLNG 100%
Production PJ 708 675-705 685-705
Capex and opex, excluding purchases1 A$m (2,482) (2,100)-(2,300) (2,100)-(2,300)
Unit capex + opex, excluding purchases1 A$/GJ 3.5 3.0-3.4 3.0-3.4
Distribution Breakeven2 US$/boe 29 US$25-29 US$24-28
Cash distribution from APLNG A$m 1,275 575-6753
Integrated Gas - Other
Oil/LNG hedging and trading (loss)/gain4 A$m (92) 54 53
Corporate
Net corporate costs A$m (59) (75)-(85) (90)-(100)
Capital expenditure (excluding investments) A$m (500) (420)-(470) (400)-(440)
1 Opex excludes purchases and reflects royalties at breakeven oil prices. FY2020 excludes Ironbark acquisition costs
2 FY2021 AUD/USD rate 0.74 (previous guidance: 0.69, FY2020 0.67)
3 Assuming an average AUD/USD rate of 0.74 and that all APLNG debt covenants are met
4 FY2021 guidance is based on forward market prices as at 15 February 2021
Energy Markets
We estimate Energy Markets Underlying EBITDA to be lower than FY2020 at $1,000 -$1,140 million driven by:
• Electricity Gross Profit reduction of $250-$290 million reflecting lower wholesale prices flowing into retail and business tariffs, a one-off
increase in network costs not recovered in regulated tariffs ($40 million), as well as the impacts of mild summer conditions on demand
and volatility;
• Natural Gas Gross Profit reduction of $200-$250 million reflecting the roll-off of legacy supply and transport capacity sales contracts
($70 million), repricing of tariffs, as well as the impact of lower business sales volumes. Higher gas procurement costs are expected in the
second half, as a portion of Origin's supply costs are linked to the JKM index. While this was hedged over the northern hemisphere winter
peak, Origin has some exposure to JKM prices in the final quarter of FY2021 and these prices have increased substantially; and
• Cost to serve savings of approximately $70 million offsetting the above impacts, including ~$40 million related to COVID-19 impacts from
FY2020 not repeating, and in line with the target of $100 million savings from FY2018.
Integrated Gas
We have upgraded APLNG (100 per cent) FY2021 production guidance to 685-705 PJ.
We estimate total APLNG capex + opex of $2,100-$2,300 million reflecting reduced development activity with fewer drilling rigs, reduced
workovers and lower infrastructure spend due to Talinga Orana Gas Gathering Station being online, and lower exploration and appraisal
(E&A) spend.
Targeting FY2021 APLNG distribution breakeven of US$24-28/boe including approximately US$11/boe in project finance costs.
Origin's FY2021 cash distributions from APLNG are expected to be $575-$675 million, at an estimated realised oil price of US$43/bbl.1
We estimate a net gain on Origin’s oil/LNG hedging and trading positions of $53 million based on current forward prices. Other Origin only
costs are estimated to be similar to FY2020 and include overheads net of recoverables from APLNG, Beetaloo Basin and other costs.
Corporate
FY2021 Corporate costs are estimated to be $90-$100 million, reflecting declining functional costs more than offset by higher insurance
costs, one-off enterprise resource planning (ERP) costs and FY2020 FX gains reversing.
Capital expenditure is estimated to be $400-$440 million primarily due to lower spending on generation projects, and includes $60–
$70 million E&A spend, primarily relating to Beetaloo appraisal. This excludes $140-$150 million relating to the Octopus equity investment.
Depreciation and amortisation is estimated to be $50-$60 million higher than FY2020 driven by decommissioning retail IT systems and
increased generation restoration provisions.
Estimated net interest savings of $60-$70 million.
Free cash flow yield is estimated to be greater than 10 per cent for FY2021.2
1
As at 29 January 2021, ~97 per cent of FY2021 APLNG related JCC oil exposure (~24mmbbl Origin share) priced at ~US$43/bbl before hedging, based on contract lags.
2
Based on Free Cash Flow over last twelve months and 30 day VWAP of $4.82 per share as at 16 February 2021.Operating and Financial Review
9
3 Financial update
3.1 Reconciliation from Statutory to Underlying Profit
HY21 HY20 Change Change
($m) ($m) ($m) (%)
Statutory Profit/(Loss) - total operations 13 599 (586) (98)
Items Excluded from Underlying Profit (post-tax)
Increase/(decrease) in fair value and foreign exchange movements (124) 78 (202) (259)
Oil and gas (126) 9 (135) n/a
Electricity (12) 23 (35) (152)
FX and interest rate 1 (42) 43 (102)
Other financial asset/liabilities (134) 64 (198) (309)
FX loss on foreign-denominated financing 146 24 122 508
Disposals, business restructuring and other (87) (7) (80) n/a
Total Items Excluded from Underlying Profit (post-tax) (211) 71 (282) (397)
Underlying Profit 224 528 (304) (58)
Fair value and foreign exchange movements reflect fair value gains/(losses) associated with commodity hedging, interest rate swaps and other
financial instruments. These amounts are excluded from Underlying Profit to remove the volatility caused by timing mismatches in valuing
financial instruments and the underlying transactions they relate to.
• Oil and gas derivatives manage exposure to fluctuations in the underlying commodity price to which Origin is exposed through its gas
portfolio and indirectly through Origin’s investment in APLNG. See Section 4.2.2 for details of Origin’s APLNG related oil hedging.
• Electricity derivatives including swaps, options and forward purchase contracts, are used to manage fluctuations in wholesale electricity
and environmental certificate prices in respect of electricity purchased to meet customer demand.
• Foreign exchange and interest rate derivatives manage exposures associated with the debt portfolio. A significant portion of debt is
Euro-denominated and cross-currency interest rate swaps hedge that debt to AUD.
• Other financial assets/liabilities reflects investments held by Origin, including MRCPS issued by APLNG.
• Foreign exchange on foreign-denominated financing reflects currency fluctuations on unhedged USD debt. Debt is maintained in USD to
offset the USD investment in MRCPS, which delivers USD cash distributions.
Disposals, business restructuring and other are either non-cash or non-recurring items and are excluded from Underlying Profit to better
reflect the underlying performance of the business. They include:
• $112 million net cost relating to a decision to defer the surrender of a portion of Origin’s 2020 Large-scale generation certificates.
This decision results in Origin accruing a non-deductible shortfall charge of $152 million that is refundable provided the certificates are
surrendered within three years. Included in Underlying Profit is a charge of $40 million reflecting the estimated future surrender cost based
on a weighted average of the current forward price and purchases to date. The balance of $112 million is excluded from Underlying Profit.
The refund is currently tax assessable, however legislative change is before Parliament (refer to the Appendix for details);
• $22 million relating to losses on disposal and restructuring, transformation and transaction costs; and
• $47 million benefit relating to a revaluation of the Cameron LNG onerous contract provision associated with stronger near term
assumptions for LNG prices relative to Henry Hub prices. The realised loss for the period is recognised in Underlying Profit.
The nature of Items Excluded from Underlying Profit set out in the above table have been reviewed by our auditor for consistency with the
description in note A1 of the Origin Energy Financial Statements.
3.2 Unrecognised deferred tax liability - investment in APLNG
As previously disclosed, there are a number of items for which deferred tax positions have not been recognised, including a deferred tax
liability of $1,377 million as at 31 December 2020 in respect of our investment in APLNG.
A deferred tax liability arises when the accounting base of an asset is higher than the tax cost base. The accounting base of our investment
in APLNG is significantly higher than the tax cost base primarily as a result of our equity accounted share of retained profits to date.
AASB 112 Income Taxes requires a deferred tax liability to be recognised for differences between the asset base and the tax cost base of
investments unless two criteria are met:
1. the entity is able to control the timing of the reversal of the temporary difference; and
2. it is probable that the temporary difference will not reverse in the foreseeable future.
To date we have not recognised a deferred tax liability as we are able to control the timing of the reversal of the temporary difference and it
has not been probable that the temporary difference will reverse in the foreseeable future, via dividends, capital returns or disposal.
It is possible that the temporary difference could reverse partly or fully, if current year profits or retained earnings are expected to be used to
pay dividends or capital returns in a subsequent year that is within the foreseeable future, or if the investment is expected to be disposed of
fully or partly.10 Origin Energy Interim Report 2021
An assessment of whether the conditions for the recognition of the deferred tax liability, in whole or in part, are met is completed each
reporting period. Recognition would result in an upfront statutory non-cash tax expense, however the future economic impact will be driven
by the timing and quantum of dividends, capital returns or disposal, including any potential franking credits. However, franking credits
expected to be earned by APLNG in the future cannot be considered in the assessment of the quantum of deferred tax liability.
3.3 Underlying Profit
HY21 HY20 Change Change
($m) ($m) ($m) (%)
Energy Markets 635 723 (88) (12)
Integrated Gas - Share of APLNG 513 1,033 (520) (50)
Integrated Gas - Other 53 (127) 180 (142)
Corporate (47) (39) (8) 21
Underlying EBITDA 1,154 1,590 (436) (27)
Underlying depreciation and amortisation (D&A) (284) (253) (31) 12
Underlying share of ITDA of equity accounted investees (472) (672) 200 (30)
Underlying EBIT 398 665 (267) (40)
Underlying interest income - MRCPS 58 95 (37) (39)
Underlying interest income - Other 3 11 (8) (73)
Underlying interest expense (127) (176) 49 (28)
Underlying profit before income tax and non-controlling interests 332 595 (263) (44)
Underlying income tax expense (108) (66) (42) 64
Non-controlling interests’ share of Underlying Profit (1) (2) 1 (50)
Underlying Profit 224 528 (304) (58)
Refer to Sections 4.1 and 4.2 respectively for Energy Markets and Integrated Gas analysis.
Corporate costs increased by $8 million, primarily reflecting unfavourable FX movements ($8 million) and ERP implementation costs
($7 million) partly offset by the self-insurance costs from HY2020 not repeating ($7 million).
Underlying D&A increased by $31 million driven by decommissioning of retail IT systems and increased generation restoration provisions.
Underlying share of ITDA decreased $200 million driven by lower ITDA from APLNG ($218 million), comprising lower tax expense
($130 million), lower net interest expense ($46 million), and lower amortisation ($42 million); partly offset by the inclusion of ITDA from
Origin’s 20 per cent equity share of Octopus Energy ($18 million).
Underlying MRCPS interest income reduced $37 million with a lower principal balance following buy-backs by APLNG, and a higher
AUD/USD exchange rate.
Underlying net interest expense reduced by $41 million, reflecting a lower net debt balance and refinancing activities.
3.4 Cash flows
Operating cash flow
HY21 HY20 Change Change
($m) ($m) ($m) (%)
Underlying EBITDA 1,154 1,590 (436) (27)
Underlying equity accounted share of EBITDA (non-cash) (511) (1,033) 522 (51)
Other non-cash items in Underlying EBITDA 59 59 - -
Underlying EBITDA adjusted for non cash items 702 616 86 14
Change in working capital 64 (45) 109 (242)
Energy Markets - excluding futures exchange collateral 67 22 45 205
Energy Markets - electricity futures exchange collateral 28 (80) 108 (135)
Integrated Gas - excluding APLNG (9) 10 (19) (190)
Corporate (22) 3 (25) (833)
Other (48) (33) (15) 45
Tax (paid)/refunded (49) (188) 139 (74)
Cash flow from operating activities 669 351 318 91
Operating cash flow increased $318 million reflecting an increase in Underlying EBITDA adjusted for non-cash items ($86 million) as well as
lower working capital requirements ($109 million) and lower tax paid ($139 million).
Underlying equity accounted share of EBITDA (non-cash) reflects share of APLNG ($513 million) and share of Octopus Energy (-$2 million).
Other non-cash items include bad and doubtful debts (+$44 million), share based remuneration (+$14 million) and exploration expense
(+$1 million).Operating and Financial Review
11
Working capital decreased $64 million in the period, primarily in Energy Markets reflecting lower net working capital in Retail driven by
seasonality and lower tariffs (+$104 million), the unwind of forward electricity hedge positions (+$28 million), offset by higher green inventory
(-$52 million) primarily relating to the small scale renewable energy scheme.
Electricity futures collateral relates to cash deposited with the futures exchange associated with forward electricity hedge positions.
Investing cash flow
HY21 HY20 Change Change
($m) ($m) ($m) (%)
Capital expenditure (172) (258) 86 (33)
Distribution from APLNG 265 520 (255) (49)
Interest received from other parties 3 14 (11) (79)
Investments/acquisitions (48) (8) (40) 500
Disposals 1 233 (232) (100)
Cash flow from investing activities 49 501 (452) (90)
In response to the current economic and policy environment we are tightly managing our capital spend, with HY2021 capital expenditure of
$172 million down 33 per cent and comprising:
• generation sustain ($33 million), primarily at Eraring ($20 million) and Mortlake power station ($4 million);
• other sustain ($60 million) including spend in preparation for the move to five minute settlement of pool prices ($18 million), LPG
($11 million), and Origin ERP system replacement ($14 million);
• productivity/growth ($57 million) including licencing payment to Octopus Energy ($20 million) and implementation of the Kraken system
($5 million), CES ($10 million), and other Energy Markets projects; and
• exploration and appraisal spend ($22 million) primarily related to the appraisal program in the Beetaloo Basin.
Cash distributions from APLNG amounted to $265 million comprising $60 million of MRCPS interest (down from $97 million in HY2020) and
$205 million of MRCPS buy-backs (down from $423 million in HY2020). Disposals in the prior period relate primarily to sale of Ironbark.
Interest received decreased reflecting a lower cash balance following repayment of maturing debt obligations.
Investments include progress payment for the equity interest in Octopus Energy ($36 million) and deferred consideration for OC Energy
($11 million).
Financing cash flow
HY21 HY20 Change Change
($m) ($m) ($m) (%)
Net proceeds/(repayment) of debt (1,035) (1,065) 30 (3)
Operator cash call movements (30) 1 (31) n/a
On-market purchase of employee shares (38) (28) (10) 36
Close out of foreign currency contracts (65) (25) (40) 160
Interest paid (125) (173) 48 (28)
Payment of lease liabilities (33) (35) 2 (6)
Dividends paid (155) (241) 86 (36)
Total cash flow from financing activities (1,481) (1,566) 85 (5)
Effect of exchange rate changes on cash (3) - (3) n/a
Repayment of debt reflects capital market debt repaid from cash held and from Free Cash Flow.
Operator cash call movements represent the movement in funds held and other balances relating to Origin's role as the upstream operator
of APLNG. On-market purchase of shares represents the purchase of shares associated with employee share remuneration schemes and the
dividend reinvestment plan. Settlement of foreign currency contracts represents the partial closure of contracts executed in prior periods to
monetise the value in certain cross currency interest rate swap contracts. The value of outstanding contracts as at 31 December 2020 was
$93 million.12 Origin Energy Interim Report 2021
Free Cash Flow
Free Cash Flow represents cash flow available to pay dividends, repay debt, invest in major growth projects or return surplus cash to
shareholders. This is prepared on the basis of equity accounting for APLNG.
The Octopus Energy investment is considered a major growth project and $61 million of investing cash outflows has been excluded from
HY2021 Free Cash Flow.
Integrated Gas
- Share Integrated
Energy Markets of APLNG Gas - Other Corporate Total
($m) HY21 HY20 HY21 HY20 HY21 HY20 HY21 HY20 HY21 HY20
Underlying EBITDA 635 723 513 1,033 53 (127) (47) (39) 1,154 1,590
Non-cash items 53 46 (513) (1,033) 5 3 4 10 (452) (974)
Change in working capital 95 (58) - - (9) 10 (22) 3 64 (45)
Other (27) (8) - - (26) (9) 6 (15) (48) (33)
Tax (paid) /refunded - - - - - - (49) (188) (49) (188)
Operating cash flow 756 703 - - 21 (123) (108) (229) 669 351
Capital expenditure (135) (211) - - (29) (42) (7) (5) (172) (258)
Cash distribution from APLNG - - - - 265 520 - - 265 520
(Acquisitions)/disposals (48) (8) - - - 234 1 - (47) 225
Interest received - - - - - - 3 14 3 14
Investing cash flow (184) (219) - - 236 712 (3) 9 49 501
Interest paid - - - - - - (125) (173) (125) (173)
Free Cash Flow including major growth 572 484 - - 257 589 (236) (393) 594 680
Major growth spend 61 - - - - - - - 61 -
Free Cash Flow 633 484 - - 257 589 (236) (393) 655 680
3.5 Shareholder returns
The Board has determined to pay an unfranked 12.5 cps dividend in respect of the first half of FY2021, which represents 34 per cent of Free
Cash Flow.
During the period, $61 million was incurred in respect of the strategic partnership with Octopus Energy. This has been treated as major growth
expenditure and excluded from Free Cash Flow when measuring the dividend pay-out percentage.
The nil franking percentage reflects the current franking credit balance. A low franking balance is expected over FY2021-23 due to higher
tax deductions and consequential lower tax payments associated with realised foreign exchange losses on debt maturities and deducting the
remaining tax cost base of Browse Basin exploration permits in the FY2020 income tax return.
Origin will seek to deliver sustainable shareholder returns through the business cycle and will target a payout range of 30 per cent to 50 per
cent of Free Cash Flow per annum in the form of ordinary dividends and/or on-market share buybacks. Free Cash Flow is defined as cash
from operating activities and investing activities (excluding major growth projects), less interest paid. Remaining cash flow will be applied to
further debt reduction and other financing activities, value accretive organic growth and acquisition opportunities and/or additional capital
management initiatives.
The Board maintains discretion to adjust shareholder distributions for economic and business conditions.
The Dividend Reinvestment Plan (DRP) will operate with nil discount and will be satisfied through on-market share purchases. The DRP price
of shares will be the average purchase price, rounded to two decimal places, bought on market over a period of 10 trading days commencing
on the third trading day immediately following the Record Date.Operating and Financial Review
13
3.6 Capital management
During HY2021 the following capital management initiatives were completed:
• Repaid and extended the tenor of our debt facilities:
- repaid €750 million (A$950 million) 2.8 per cent effective interest rate debt;
- repaid US$65 million (A$86 million) 4.4 per cent fixed interest rate debt;
- extended the tenor of A$1.1 billion of bank debt from FY2023 to FY2025; and
- extended the tenor of a US$200 million (A$260 million) bank guarantee facility from FY2023 to FY2025.
• Cancelled $0.2 billion in undrawn bank loan facilities that were surplus to requirements.
Adjusted Net Debt
(669)
(22)
155
$m
122
47
5,158 (265)
172
4,698
30 Jun 2020 Operating cash flow Net cash from Capex Net acquisitions / Net interest Dividend FX/Other 31 Dec 2020
APLNG disposals payments
Adjusted Net Debt decreased $460 million, driven by strong operating cash flow and APLNG cash distributions. This was partially offset by
capital expenditure, dividends and interest payments.
Foreign exchange/other includes primarily the non-cash translation of unhedged USD debt and fees ($191 million), partially offset by
on-market purchase of shares ($38 million), operator cash call movements ($30 million), payment of lease liabilities ($33 million) and
settlement of foreign currency contracts ($65 million).
Origin’s objective is to maintain an Adjusted Net Debt/Adjusted Underlying EBITDA ratio of 2.0-3.0x and a gearing target of 20 per cent to
30 per cent. As at 31 December 2020, these ratios were 2.0x and 28 per cent, compared to 2.1x and 29 per cent, respectively, at 30 June
2020. We expect the capital structure to increase to the top of our 2-3x target range by the end of FY2021, reflecting the reduction in Energy
Markets earnings.
Our long-term credit ratings are BBB (stable) from S&P and Baa2 (stable) from Moody’s.14 Origin Energy Interim Report 2021
Debt portfolio management Debt maturity profile
- excluding lease liabilities (A$b)
Average term to maturity remained constant at 3.9 years from
2.0
30 June 2020. The rolling 12-month average interest rate on drawn
debt decreased from 4.8 per cent in FY2020 to 4.3 per cent
in HY2021.
As at 31 December 2020, Origin held $0.4 billion1 of cash and 1.5
$2.9 billion in committed undrawn debt facilities. This liquidity
position of $3.3 billion is held to meet near-term debt and lease
liability payment obligations of $1.9 billion (net of $0.1 billion fair 1.0
value adjustments) and to maintain a sufficient liquidity buffer.
0.5
0.0
FY21 FY22 FY23 FY24 FY25 FY26 FY27 FY28 FY29 FY30+
Capital Markets Debt & Term Loan
Loans and Bank Guarantees - Drawn
Loans and Bank Guarantees - Undrawn
APLNG funding
During construction of APLNG, shareholders contributed capital via ordinary equity and the investment in preference shares (termed MRCPS)
issued by APLNG. APLNG distributes funds to shareholders firstly via fixed dividends of 6.37 per cent per annum on the MRCPS balance,
recognised as interest income by Origin, and secondly via buy-backs of MRCPS, refer to Section 3.4 above. The fair value of MRCPS held by
Origin at 31 December 2020 was A$1,679 million.
APLNG also funded construction via US$8.5 billion (100% APLNG) in project finance facilities. These facilities were partially refinanced
in FY2019. The outstanding balance at 31 December 2020 was US$6,154 million (A$7,987 million), net of unamortised debt fees of
US$72 million (A$95 million). APLNG’s average interest rate associated with its project finance debt portfolio for FY2021 is estimated to be
approximately 3.0 per cent.
Gearing2 in APLNG was constant at 28 per cent from 30 June 2020 to 31 December 2020.
1
Excludes $88 million cash held on behalf of APLNG as upstream operator
2
Gearing is defined as project finance debt less cash, divided by project finance debt less cash plus equity.Operating and Financial Review
15
4 Review of segment operations
4.1 Energy Markets
Origin’s Energy Markets business comprises one of Australia’s largest energy retail businesses by customer accounts, Australia’s largest fleet
of gas-fired peaking power stations supported by a substantial contracted fuel position, a growing supply of contracted renewable energy
and Australia’s largest power station, the black coal-fired Eraring Power Station.
Energy Markets reports on an integrated portfolio basis. Electricity and Natural Gas Gross Profit and cost to serve are reported separately, as
are the EBITDA of the Solar and Energy Services, Future Energy and LPG divisions, and our share of earnings from the 20 per cent equity
holding in Octopus Energy.
4.1.1 Financial summary
HY21 HY20 Change Change
($m) ($m) ($m) (%)
Electricity Gross Profit 503 549 (46) (8)
Natural Gas Gross Profit 327 383 (56) (15)
Electricity and Natural Gas cost to serve (254) (267) 13 (5)
LPG EBITDA 48 53 (5) (10)
Solar and Energy Services EBITDA 25 15 10 73
Future Energy costs (12) (10) (2) 20
Share of EBITDA from Octopus Energy (2) - (2) N/A
Underlying EBITDA 635 723 (88) (12)
Underlying EBIT 353 484 (131) (27)16 Origin Energy Interim Report 2021
4.1.2 Electricity
Volume Summary
Volumes sold HY21 HY20 Change Change
(TWh) Retail Business Total Retail Business Total (TWh) (%)
NSW1 4.0 4.2 8.2 4.0 4.4 8.4 (0.3) (3.6)
Queensland 2.1 1.8 4.0 2.0 1.8 3.7 0.2 5.3
Victoria 1.4 1.6 3.0 1.5 1.8 3.3 (0.2) (6.1)
South Australia 0.6 0.9 1.5 0.7 0.9 1.6 (0.1) (6.4)
Total volumes sold 8.2 8.5 16.6 8.1 8.9 17.0 (0.4) (2.4)
1 Australian Capital Territory customers are included in New South Wales.
Gross Profit summary
HY21 HY20 Change Change
$m $/MWh $m $/MWh (%) ($/MWh)
Revenue 3,601 216.6 3,780 222.5 (5) (5.9)
Retail (residential/SME) 2,223 272.5 2,299 283.7 (3) (11.2)
Business 1,379 162.7 1,481 166.6 (7) (3.9)
Cost of goods sold (3,098) (186.3) (3,230) (190.1) (4) 3.8
Network costs (1,569) (94.4) (1,549) (91.2) 1 (3.2)
Energy procurement costs (1,529) (91.9) (1,681) (99.0) (10) 7.0
Gross Profit 503 30.3 549 32.3 (9) (2.0)
Gross margin % 14.0% 14.5% (4)
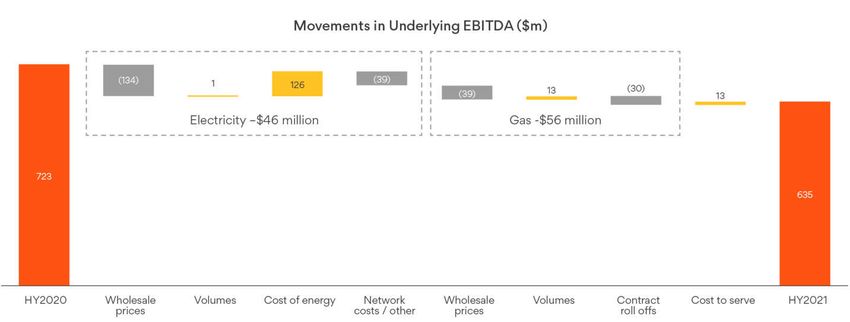
Electricity Gross Profit declined by $46 million driven by: Sources and uses of Electricity (TWh)
• $2.0/MWh decrease in unit margins (-$47 million): 20
- -$134 million due to lower wholesale electricity and renewable
certificate prices flowing into tariffs;
- -$39 million due to increased network costs (-$20 million) and
metering costs (-$6 million) not recovered in regulated tariffs 15
and ongoing customer support during COVID (-$13 million);
- partially offset by +$126 million cost improvement relating
to lower generation fuel and operating costs (+$33 million),
lower green scheme costs (+$37 million), net reduction in pool
and swap costs (+$26 million) and other (+$30 million). 10
• 0.4 TWh volume decline driven by reductions in lower margin
Business and SME customers, and solar uptake and efficiency,
offset by increased residential demand due to COVID-19, with a
marginal impact to gross profit (+$1 million). 5
Owned and contracted generation output of 11 TWh was lower by
0.7 TWh driven primarily by lower gas generation (-0.6 TWh) due
to lower pool prices, lower demand and elevated gas generation
in HY2020 to cover an outage at Eraring Power Station. Output
at Eraring was lower (-0.2 TWh) due to lower demand. Both were 0
partially offset by increased generation from renewable PPAs (+0.1 HY20 HY21 HY20 HY21
Sources Sources Uses Uses
TWh). Refer to Electricity Supply table on the next page.
~16 TWh per annum (or ~50 per cent) of our electricity supply costs Renewables Solar FiT
are relatively fixed representing Eraring and the renewable PPAs. Coal (Eraring) Gas
Energy procurement costs overall decreased with lower volumes, Other Swap Contracts
lower pool costs and lower green scheme costs, the latter due to Short Position Retail
a decision to defer a portion of our CY2020 large-scale certificate Business Losses
surrender (refer to the Appendix for details). Unit procurement costs
reduced due to lower pool prices on our short position, and lower
fuel costs offset by higher contract prices due to timing of sale and
purchase of swaps and solar feed-in tariff rates.Operating and Financial Review
17
Wholesale energy costs
HY21 HY201
$m TWh $/MWh $m TWh $/MWh
Fuel cost2 448 9.4 47.7 517 10.2 50.7
Generation operating costs 124 9.4 13.2 137 10.2 13.4
Owned generation2 572 9.4 60.9 654 10.2 64.1
Net pool costs3 91 2.3 40.2 114 1.7 65.7
Bundled renewable PPAs4 146 1.6 92.5 137 1.5 90.9
Market contracts4 230 3.2 72.2 216 3.5 61.5
Solar feed-in tariff 107 1.0 109.2 92 0.8 115.1
Capacity hedge contracts 154 174
Green schemes (excl. PPAs) 216 253
Other 14 41
Energy procurement costs 1,529 17.45 87.9 1,681 17.85 94.6
1 Certain line items have been reallocated to better reflect the nature of expenditure.
2 Includes volume from internal generation and contracted from Pelican Point.
3 Net pool costs includes gross pool purchase costs net of pool revenue from generation, gross and net settled PPAs, and other contracts.
4 Bundled PPAs includes cost of electricity and renewable certificates. Market contracts include swap and energy hedge contracts.
5 Volume differs from sales volume due to energy losses of 0.8 TWh (HY2020: 0.8 TWh).
Electricity supply
HY21 HY20 Change
Nameplate Output Pool revenue Output Pool revenue Output Pool revenue
capacity
(MW) Type1 (GWh) ($m) ($/MWh) (GWh) ($m) ($/MWh) (GWh) ($m) ($/MWh)
Eraring 2,922
Units 1-4 2,880 Black Coal 6,950 423 61 7,101 561 79 (152) (138) (18)
GT 42 OCGT - - - - - - - - -
Darling Downs 644 CCGT 889 48 54 830 66 79 60 (18) (25)
Osborne2 180 CCGT 295 15 52 434 40 93 (139) (25) (41)
Uranquinty 664 OCGT 45 6 124 363 45 125 (318) (40) (1)
Mortlake 566 OCGT 365 27 73 464 49 106 (99) (23) (33)
Mount Stuart 423 OCGT 4 0 110 3 0 103 1 0 7
Quarantine 230 OCGT 50 4 73 125 19 153 (76) (16) (80)
Ladbroke Grove 80 OCGT 51 4 73 109 13 123 (59) (10) (50)
Roma 80 OCGT 13 1 81 8 1 109 5 0 (28)
Shoalhaven 240 Pump/Hydro 83 7 90 82 11 135 1 (4) (45)
Internal Generation 6,029 8,744 535 61 9,520 807 85 (776) (272) (24)
Pelican Point 240 CCGT 647 677 (30)
Renewable PPAs 1,207 Solar / Wind 1,573 1,517 56
Owned and
contracted
generation 7,476 10,964 11,714 (750)
1 OCGT = open cycle gas turbine; CCGT = combined cycle gas turbine.
2 Origin has a 50 per cent interest in the 180 MW plant and contracts 100 per cent of the output.18 Origin Energy Interim Report 2021
4.1.3 Natural Gas
Volume summary
HY21 HY20 Change Change
Volume sold (PJ) Retail Business Total Retail Business Total (PJ) (%)
NSW1 6.3 13.9 20.2 6.0 9.3 15.3 4.9 32
Queensland 1.8 35.3 37.0 1.7 33.1 34.8 2.2 6
Victoria 13.9 28.9 42.8 14.0 31.4 45.5 (2.6) (6)
South Australia2 3.2 4.8 8.0 3.2 5.8 9.0 (1.0) (11)
External volumes sold 25.2 82.8 108.1 24.9 79.7 104.6 3.5 3
Internal sales (generation) 21.9 29.7 (7.8) (26)
Total volumes sold 130.0 134.3 (4.3) (3)
1 Australian Capital Territory customers are included in New South Wales.
2 Northern Territory and Western Australia customers are included in South Australia.
Gross Profit summary
HY21 HY20 Change Change
$m $/GJ $m $/GJ (%) ($/GJ)
Revenue 1,362 12.6 1,466 14.0 (7) (1.4)
Retail (residential/SME) 617 24.5 615 24.7 0 (0.2)
Business 745 9.0 851 10.7 (12) (1.7)
Cost of goods sold (1,035) (9.6) (1,082) (10.3) (4) 0.8
Network costs (421) (3.9) (400) (3.8) 5 (0.1)
Energy procurement costs (614) (5.7) (683) (6.5) (10) 0.8
Gross profit 327 3.1 383 3.7 (15) (0.7)
Gross margin % 24.0% 26.1% (8)
Natural Gas Gross Profit decreased $56 million driven by: Sources and uses of gas (PJ)
• $0.7/GJ decline in unit margin (-$39 million) primarily due to 140
lower prices flowing through to customer tariffs, including oil
linked sales, partially offset by lower procurement costs driven by 120
lower priced spot and JKM purchases;
• -$30 million decline due to the roll-off of long-term transport 100
capacity contracts;
• partially offset by a 3.5 PJ increase in external sales volume
80
(+$13 million) due to higher Retail customer accounts and
wholesale contract wins offsetting COVID-19 impacts.
60
40
20
0
HY20 HY21 HY20 HY21
Sources Sources Uses Uses
APLNG - fixed price Other fixed price
Oil/JKM linked Retail
Business - C&I Business - Wholesale
GenerationOperating and Financial Review
19
4.1.4 Electricity and Natural Gas cost to serve
Change Change
HY21 HY20 ($) (%)
Cost to maintain ($ per average customer)1 (52) (56) 4 (6)
Cost to acquire/retain ($ per average customer)1 (19) (19) (0) 1
Electricity and Natural Gas cost to serve ($ per average customer)1 (71) (75) 4 (5)
Maintenance costs ($m) (187) (200) 13 (7)
Acquisition and retention costs ($m)2 (67) (67) (0) 1
Electricity and Natural Gas cost to serve ($m) (254) (267) 13 (5)
1 Represents cost to serve per average customer account, excluding CES accounts.
2 Customer wins (HY2021: 232,000; HY2020: 252,000) and retains (HY2021: 642,000; HY2020: 735,000).
HY21 HY20 Change Change
($m) ($m) ($) (%)
Labour (73) (79) 6 (8)
Bad and doubtful debts (40) (39) (1) 3
Other variable costs (55) (65) 9 (14)
Retail and Business (168) (183) 15 (8)
Wholesale (30) (26) (4) 16
Corporate services and IT (56) (58) 2 (4)
Electricity and Natural Gas cost to serve (254) (267) 13 (5)
Overall, Electricity and Natural Gas cost to serve reduced by $13 million primarily driven by further operating cost savings including reductions
in labour, IT and property costs. At 30 June 2020, we recognised an increase in our bad and doubtful debt provision of $38 million related
to the risks associated with COVID-19.3 This provision has been held for HY2021 with continued uncertainty relating to potential ongoing
impacts of COVID-19, particularly the further roll-off of government assistance from March 2021.
Bad debt expense as a percentage of total Electricity and Natural Gas revenue increased to 0.8 per cent in HY2021, up from 0.7 per cent
in HY2020.
We are on track to deliver targeted $100 million cost savings by FY2021 from a baseline in FY2018, having achieved $85 million savings to
date. The next wave of retail transformation is targeting a further reduction of $100–$150 million in operating and capital cost savings by
FY2024, following successful implementation of the Octopus Energy’s Kraken platform and operating model.
Customer accounts
Customer accounts ('000) as at 31 December 2020 30 June 2020 Change
Electricity 2,614 2,631 (17)
NSW1 1,181 1,191 (10)
Queensland 637 645 (8)
Victoria 555 556 (1)
South Australia2 242 239 3
Natural Gas 1,233 1,220 13
NSW1 343 335 8
Queensland 180 181 (0)
Victoria 482 479 3
South Australia2 227 225 2
Total electricity and natural gas3 3,847 3,851 (4)
Rolling average customer accounts (six months) 3,845 3,834 12
Broadband 26 20 6
LPG4 367 365 2
Total customer accounts 4,240 4,236 4
1 Australian Capital Territory customer accounts are included in New South Wales.
2 Northern Territory and Western Australia customer accounts are included in South Australia.
3 Includes 267,000 CES customer accounts (FY2020: 257,000).
4 June 2020 LPG customer accounts restated to include ~2,500 Asia Pacific customer accounts.
3
The total increase in bad and doubtful debt provision relating to COVID-19 risks was $40 million, of which $38 million impacted electricity and gas cost to serve and the
remainder impacted the Solar and Energy services division.20 Origin Energy Interim Report 2021
Although price dispersion and in situ churn have reduced following Customer Account Movement ('000)
the introduction of the DMO and VDO, the market remains highly 10
competitive and we continue to take a disciplined approach to share
and customer lifetime value.
Origin churn decreased to 12.9 per cent during the period, 5
compared to market churn of 17.3 per cent.
Period end customer accounts rose by 4,000 overall. Electricity
customer accounts fell by 17,000, reflecting a reduction in retail 0
of 14,000, and SMEs of 3,000 primarily relating to low margin
tenders. Natural Gas customer accounts increased by 13,000,
driven primarily by gains in New South Wales. Since December -5
2020, electricity and gas customer accounts improved by 9,000.
Broadband customer accounts increased by 6,000 during the
period to a total of 26,000 and LPG customer accounts increased -10
NSW QLD VIC SA
by 3,000 to 367,000 at 31 December 2020.
Electricity Gas
4.1.5 LPG
Change
HY21 HY20 Change (%)
Volumes (kT) 213 227 (14) (6)
Revenue ($m) 300 322 (22) (7)
Cost of goods sold ($m) (194) (214) 20 (10)
Gross Profit ($m) 106 108 (2) (1)
Operating costs ($m) (58) (54) (4) 7
Underlying EBITDA ($m) 48 53 (5) (10)
Origin is one of Australia’s largest LPG and propane suppliers, procuring and distributing LPG to residential and business locations across
Australia and the Pacific.
Gross Profit decreased by $2 million primarily driven by the impact of COVID-19 on demand, in particular in the Pacific, with both revenue
and cost of goods sold decreasing as a result. Operating costs marginally increased to $58 million driven by additional site remediation costs
and port fees.
4.1.6 Solar and Energy Services
HY21 HY20 Change Change
($m) ($m) ($m) (%)
Revenue 175 141 34 24
CES Gross Profit 42 39 3 8
Solar Gross Profit 19 13 6 46
Other Gross Profit 2 2 0 -
Gross Profit 63 54 9 17
Operating costs (38) (39) 1 (3)
Underlying EBITDA 25 15 10 67
Origin provides installation of solar photovoltaic (PV) systems and batteries to residential and business customers, and ongoing support and
maintenance services. Community Energy Services (CES) supplies both electricity and gas to apartment owners and occupiers, and body
corporates through embedded networks and serviced hot water.
Underlying EBITDA increased by $10 million. This was driven by growth in Solar Gross Profit (+$6 million), with overall growth in residential
solar installations, a $3 million increase in CES Gross Profit due to continued customer account growth in the embedded networks and
serviced hot water business, and a $1 million reduction in operating costs due to reduced labour costs.Operating and Financial Review
21
4.1.7 Future Energy
HY21 HY20 Change Change
($m) ($m) ($m) (%)
Operating costs (12) (10) (2) 20
Investments 2 6 (4) (67)
Future Energy is focused on developing and commercialising new products and technologies to engage customers in an increasingly
distributed and data driven energy landscape. We continue to expand the capabilities of our Virtual Power Plant (VPP), which orchestrates
an increasing variety of distributed energy assets and IoT devices. With more than 98 MW under orchestration from more than 14,000
customers, the VPP is expected to grow as more devices are able to be connected and the benefits become more evident to customers. We
have launched a tool to share the benefits of demand management with customers called Spike through which customers are rewarded for
reducing energy consumption. To date, Spike has around 28,000 customers, and has demonstrated a high level of customer engagement
with more than 260,000 Spikehour invitations converting to an average participation rate of 70 per cent of events, and a 50 per cent energy
reduction compared to a customer’s average energy use over the relevant previous 10-day period.
Operating costs increased during the period due to costs relating to the launch of Spike. The business continues to make small investments
in trialling new energy solutions.
4.1.8 Octopus Energy - Origin share (20 per cent)
HY21
($m)
Revenue - energy 303
Revenue - licensing 15
Cost of sales (304)
Gross profit 14
Operating costs (16)
EBITDA (2)
Depreciation and amortisation1 (18)
Interest expense (2)
Tax expense 2
NPAT (20)
1 Includes $7.9 million Origin adjustment to amortisation relating to the fair value attributed to intangible assets, including Kraken, on acquisition date.
Octopus customer accounts (100 per cent Octopus)
HY21
('000)
Energy customer accounts (closing) 3,379
Energy customer accounts (average) 3,069
Licensed Kraken platform customer accounts migrated to date (closing) 2,016
Licensed Kraken platform customer accounts migrated to date (average) 901
Origin’s share of Octopus Energy EBITDA for the period was -$2 million, reflecting increased investment in growth both in the UK as well as
launching in the United States and German markets. Customer account growth in the underlying UK retail business continues to track strongly,
growing on average by ~93,000 customer accounts per month since our investment in May 2020, to ~3.53 million customer accounts at the
end of January 2021.
Licensing deals with E.On and Origin are progressing well, with ~2 million customer accounts migrated at the end of HY2021. To date,
17 million customer accounts are contracted to be migrated to the Kraken platform with more than £300 million of licensing revenue expected
over the next three years. Octopus’ partnership with Tokyo Gas, announced in December 2020, will see an Octopus branded retailer launch
in the Japanese market as Octopus continues its growth trajectory to target 100 million accounts by 2027.You can also read