2021 IT Recruitment and Retention Report - 1300 CLICKS clicks.com.au

Page created by Tony Barker
 
CONTINUE READING
2021 IT Recruitment and Retention Report - 1300 CLICKS clicks.com.au
2021
IT Recruitment and
Retention Report

         1300 CLICKS
         clicks.com.au
2021 IT Recruitment and Retention Report - 1300 CLICKS clicks.com.au
Introduction
Clicks IT Recruitment is pleased to provide you with the latest analysis of the state of the
Australian IT staffing market – the 2021 IT Recruitment & Retention Report. The report provides
insights into hiring intentions, IT spending in both corporate and government sectors, and current
IT hiring trends. We have also included commentary to help you better understand how these
factors have changed over the past 12 months.

It hardly needs stating that 2020 has been a year like no other. So much so that Clicks conducted
an additional IT Recruitment & Retention survey of our clients in July to gain contemporary
business intelligence on the changes to market conditions. Having this additional data allows
us to provide you with valuable context on the year’s oscillating circumstances. Predictably,
many business indicators fell in July, at a time when expenditure control, business continuity and
managing remote workforces were key priorities. We were therefore delighted to see an equally
impressive recovery across all fronts in our December data.

There are other items of note in this report, specifically in our respondent base. Our Baby
Boomers dropped from 21% prior year to just 1% this year, whilst our Gen Zers (born 1998 – 2010)
increased from 1% prior year to 20% this year. We are getting younger! We welcome the views of
this cohort and look forward to the diversity they bring to this dialogue. On other diversity fronts,
Clicks continues to strengthen its position as a thought leader in gender and neurodiversity
recruitment. This year we were invited to be the inaugural members of the Recruitment Industry
Reference Group, a Government funded program to teach employers and labour hire companies
how to confidently hire people with autism.

With hopes for improved politics in the United States, COVID-19 vaccines being delivered and
an increase in anticipated hiring demands, we are optimistic about a busy year ahead. Many
organisations in both the private and public sectors are committed to a full project pipeline
in 2021, which Clicks looks forward to assisting with through the provision of excellent IT
professionals. We are ideally placed to support your organisational objectives and hiring strategy.
Please contact me on the details below to find out why Clicks is Australia’s favourite IT recruiter.

                Ben Wood
                Managing Director
                Level 35, 360 Collins Street, Melbourne VIC 3000
                03 9963 4884 | ben.wood@clicks.com.au
2021 IT Recruitment and Retention Report - 1300 CLICKS clicks.com.au
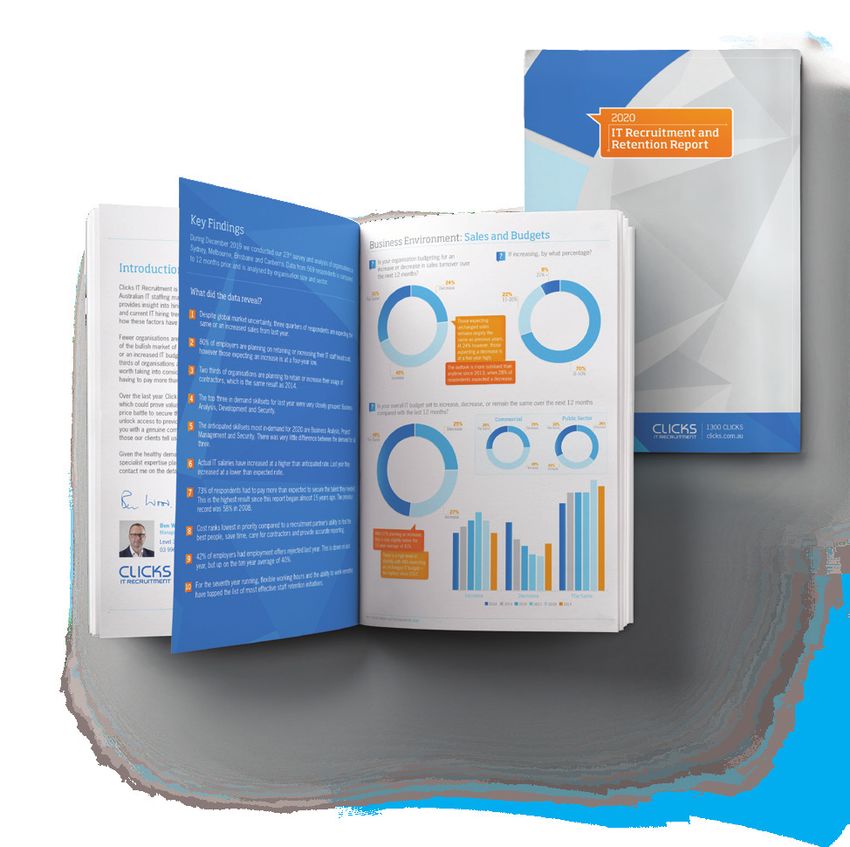
Contents

Key Findings....................................................................... 1

Business Environment: Sales and Budgets............................ 2

Staffing Levels: Hiring or Firing........................................... 3

Resourcing Strategies: Onsite IT Consulting.......................... 5

Hot Spots: Who’s in Demand.................................................7

Salaries: Show us the Money............................................... 9

Resourcing Strategies: Buy or Build.................................... 10

Resourcing Strategies: Graduates........................................11

Staff Turnover and Retention..............................................11

IT Health Check................................................................ 13

About You and Your Organisation........................................ 14
2021 IT Recruitment and Retention Report - 1300 CLICKS clicks.com.au
Key Findings
During December 2020 we conducted our 24th survey and analysis of organisations
in Sydney, Melbourne, Brisbane and Canberra. Data from hundreds of respondents is
compared to 12 months prior and is analysed by organisation size and sector.

 What did the data reveal?

  1    Following the impact of COVID-19, there has been a strong recovery across all key
       indicators: sales revenue, IT budgets, and headcount.

  2    Pre-COVID, 45% of employers were expecting an increase in sales turnover. This
       dipped to 10% during COVID, and has rebounded to 38%.

  3    IT budgets have also experienced a rapid recovery, going from 13% expecting an
       increase during COVID, to 31%.

  4    46% of employers expect their IT staff numbers to remain steady across 2021,
       slightly below the ten year average of 48.2%.

  5    Permanent hiring intention has strengthened slightly, and is at a three year high,
       with 35% of respondents expecting to increase headcount.

  6    Dipping to 11% in July 2020, those expecting to increase IT contractor usage has
       also rallied, with 23% of employers now anticipating growth in 2021.

  7    Security and Applications Development continue to be the most difficult skill sets
       to recruit. They are also expected to be in high demand in the year ahead.

  8    IT salaries experienced their lowest increase on record during 2020, with an
       average increase of less than 1%.

  9    56% of employers reported no change to their IT salaries, however 47% reported
       having to pay more than they anticipated.

  10   Flexible working hours and the ability to work remotely continue to be the most
       highly valued employer offerings to improve retention.

                                                                IT RECRUITMENT & RETENTION REPORT 2021 1
                                                                  IT RECRUITMENT & RETENTION REPORT 2021 1
Business Environment: Sales and Budgets
   ? Is your organisation budgeting for an                                                  ? If increasing, by what percentage?
        increase or decrease in sales turnover over
        the next 12 months?
                                                                                                                                                               17%
                                                                                                   24%                                                    21% +
                                                     34%
                                                  Decrease                                         11–20%
    28%
The Same

                                                           Pre-COVID, 45% of respondents
                                                           were expecting an increase, and
                                                           24% were expecting a decrease.
                                                           During the peak of COVID in July,
                                                           these figures altered dramatically:
                                                           just 10% anticipating an increase,
                                                           and 73% a decrease.

                                                     The December results talk to the rapid recovery
                                                     of our economy, with the figures returning to                                                   59%
                       38%                           pre-COVID levels. 38% are now expecting an                                                    0–10%­
                   Increase                          increase in sales turnover in 2021, and those
                                                     expecting a decrease has halved to 34%.

   ? Is your overall IT budget set to increase, decrease, or remain the same over the next 12 months
        compared with the last 12 months?
                                                                                       Commercial                                     Public Sector
                                                                                                               23%                                             24%
                                                                               47%                         Decrease             39%
           42%                                                            The Same                                        Decrease
                                                                                                                                                               Increase

     The Same                                       27%
                                                Decrease

                                                                                                              30%                                                  37%
                                                                                                           Increase                                            The Same

                                                   31%
                                               Increase

     Equally as encouraging as the turnover
     forecasts, those expecting an increase
     in their IT budget has bounced back to
     31%, the 10 year average, from a low of
     13% during COVID.

            31% is an even stronger result than
            our most recent pre-COVID survey in
            Dec 2019, when 27% were expecting
            an increase in overall IT budget.

                                                                   33%   37%   33%   27%    31%      21%     17%   16%   25%    27%          46%   46%   51%    48%   42%

                                                                         Increase                           Decrease                               The Same
                                                                                           2016   2017       2018        2019         2020

  2 IT RECRUITMENT & RETENTION REPORT 2021
Staffing Levels: Hiring or Firing

? What is your total number of IT Staff (including                           ? Will your total IT staff numbers increase or
   contractors) in Australia?                                                   decrease over the next 12 months?
                                                16%
                                               0–20                                  46%
                                                                              The Same                                                              28%
                                                                                                                                              Decrease

                                                                16%
                                                               21–50

55%
100+                                                                                                                                                 26%
                                                        13%                                                                                     Increase
                                                      51–100

                                                                                             Underpinning the strong recovery
                                                                                             theme, those expecting to increase
       This metric has remained largely
                                                                                             IT staff numbers at 26% has nearly
       unchanged pre and during COVID.
                                                                                             rebounded to the 28% pre-COVID figure.
       With 55% of respondents having 100+
       IT staff in December 2020, this is in                                               During COVID-19, those expecting to increase
       line with the 5 year average of 53.4%                                               IT staff numbers fell to an all-time low of 11%.
                                                                                           Those expecting to remain steady at 46% is
                                                                                           close to the ten year average of 48.1%.

       32%    37%     37%    28%    28%                 18%    17%     12%    20%     26%                   50%     46%     51%     52%       46%

               Increase                                         Decrease                                            The Same
                                               2016       2017         2018         2019        2020

                                                                                                           IT RECRUITMENT & RETENTION REPORT 2021 3
? Do you expect to increase the number of your permanent IT staff over the next 12 months?

           2020
                                                                                             During COVID, this figure dipped from
            35% Yes                                                  65% No                  33% pre-COVID to 28%. This is not a
                                                                                             material difference, and is the same
           2019                                                                              result as 2016, when there were no
                                                                                             major market-disrupting events.
            33% Yes                                                  67% No

           2018

            34% Yes                                                  66% No

           2017
            36% Yes                                                  64% No

           2016

            28% Yes                                                  72% No

    ? Over the next 12 months do you expect your usage of IT Contractors will be greater or less than
         over the last 12 months?

                   9%                                                Greater/The Same                                              Less/Don’t Use
            Don’t Use
                                                       23%
                                                    Greater          2020
                                                                      59%                                                                         41%

                                                                     2019
                                                                      68%                                                                         32%

                                                                     2018
                                                                      78%                                                                         22%

                                                                     2017
                                                                      69%                                                                         31%

                                                                     2016
                                                                      76%                                                                         24%
     36%                                                  32%
The Same                                                      Less

                                                                            Whilst this aggregate view of 2020 may appear less optimistic
Anticipated IT contractor usage has made a full recovery to pre-            in comparison to prior years, the ‘Greater’ result of 23% is within
COVID levels at the end of 2020. With 24% expecting greater                 striking distance of the 15 year average of 26.2%.
usage at the end of 2019, demand softened to 11% in July 2020.
                                                                                 Those not using contractors is also a factor, with a
               Rebounding to 23% in December 2020,                               result of 9% compared to a 15 year average of 5.4%.
               this sends a very encouraging message to
               the market, with organisations committing
               to the completion of their project pipeline.

 4 IT RECRUITMENT & RETENTION REPORT 2021
Resourcing Strategies: Onsite IT Consulting

? Do you currently use onsite IT consulting services as part of your overall IT staffing mix?

                                                        63%                                                                37%
                                                          Yes                                                              No

         There has been a softening in usage
         of onsite IT consulting services, at
         63% compared to 65% prior year,
         and a 5 year average of 67%.

        With these types of services typically
        attracting a higher cost than traditional
        labour hire IT contracting, tighter than
        usual financial constraints during
        COVID-19 may have contributed to
        the reduction in demand.

 ? If yes, over the next 12 months are you                                  ? If no, do you expect you will use onsite IT
      planning to increase or decrease your use                                consulting services as part of your IT staff
      of the onsite IT consulting services?                                    mix in the next 12 months?

                                                                                                                        12%
                                                                                                                        Yes
      56%                                                        23%
 The Same                                                   Decrease

                                                                     21%
                                                                Increase
                                                                                   88%
                                                                                   No

There isn’t significant movement in this metric, with 56% of respondents
intending no change to their onsite IT consulting services.

  This is only a slight softening against the five year average of 58.7%.

                                                                                                IT RECRUITMENT & RETENTION REPORT 2021 5
Introducing Clicks’ sister companies!
                                                                              Blue                               Temporary,
                                                                                                                 Contract &                Payrolling
                                                                              Collar &
                                                                                                                 Permanent                 & Managed
                                                                              White Collar
EXPERTS IN                                                                    Recruitment                        Recruitment               Services

STAFFING                                                                      Candidate
                                                                              Capability
                                                                                                                 Market
                                                                                                                 Reports
                                                                                                                 & Salary
                                                                                                                                           Recruitment
                                                                                                                                           Process

SOLUTIONS
                                                                              Testing &
                                                                              Benchmarking                       Surveys                   Outsourcing

 Business Support             Accounting & Finance                     Human Resources                        Contact Centre            Managers & Executives

ƒ Administrators                  ƒ Audit and Tax                     ƒ Human Resources                   ƒ Inbound / Outbound            ƒ Business Managers
                                    Specialists
ƒ Business Support                                                    ƒ Recruitment Officer               ƒ Web Based and Phone           ƒ Operations Managers
  Officers                        ƒ Financial Controllers
                                                                      ƒ Learning & Development            ƒ Multi-channel                 ƒ General Managers
ƒ Data Entry / Analyst            ƒ Finance Managers                                                        Customer Service
                                                                      ƒ Change Manager                                                    ƒ Project Managers
ƒ Executive Assistants            ƒ Accountants: Financial,                                               ƒ Lead Generation /
                                                                      ƒ WHS Manager                                                       ƒ Technical Specialists
                                    Systems, Cost, Project,                                                 Sales
ƒ Office Managers
                                    Public, Management                ƒ Industrial Relations                                              ƒ Professionals
                                                                                                          ƒ Helpdesk
ƒ Project Officers
                                  ƒ Business Analysts                 ƒ Workforce Planning                                                ƒ Business Leaders
                                                                                                          ƒ Team Leaders
ƒ Receptionists
                                  ƒ Credit Analysts &                 ƒ Organisational                                                    ƒ Executives
                                                                                                          ƒ Operations Managers
ƒ Project Administrators            Managers                            Development
                                                                                                                                          ƒ Directors
                                                                                                          ƒ Contact Centre
ƒ Marketing &                     ƒ Chief Financial Officers          ƒ Trainers
                                                                                                            Managers                      ƒ Assistant Directors
  Communications Officers
                                  ƒ Accounts Payable /                ƒ Compensation and
                                                                                                          ƒ Trainers                      ƒ Graduates
ƒ Payroll Officers and              Receivable                          Benefits Manager
  Managers                                                                                                ƒ Workforce Planners
                                  ƒ Procurement

              Sales                                 Government                                  Light Industrial                   Warehouse & Logistics

ƒ Business Development                     ƒ APS 1 - EL 2 and State                      ƒ Production & Process Workers           ƒ Pick / Pack
  Managers                                   Government Equivalents
                                                                                         ƒ Lab Technicians                        ƒ RF Scanners
ƒ Account Managers / Directors             ƒ Graduates
                                                                                         ƒ Quality Control                        ƒ Voice Pickers
ƒ Sales Representatives /                  ƒ Policy Officers
                                                                                         ƒ Outdoor Workers                        ƒ Scissor Lift (EWP) Operators
  Managers / Directors
                                           ƒ Procurement Officers
                                                                                         ƒ Labourers (with White Card)            ƒ Forklift Operators (LF Licence)
ƒ Sales Coordinators
                                           ƒ Project Officers
                                                                                         ƒ Machine Operators                      ƒ Order Pickers (LO Licence)
ƒ Channel / Partner Sales
                                           ƒ Program Managers
  Professionals                                                                          ƒ Trades                                 ƒ Inventory Personnel
                                           ƒ Scribes
ƒ Inbound / Outbound Sales                                                               ƒ Supervisors                            ƒ Receiving & Despatch
  Professionals                            ƒ Customer Service
                                                                                         ƒ Traffic Controllers                    ƒ Leading Hands
ƒ B2B / B2C Sales Professionals            ƒ Marketing & Communications
                                                                                         ƒ Parking Officers                       ƒ Purchasing Officers
                                             Officers
ƒ Relationship Managers
                                                                                         ƒ Facilities Management                  ƒ Stock and Quality Control
                                           ƒ Public Safety Officers
ƒ Bid / Proposal Managers
                                                                                         ƒ Leading Hands                          ƒ DC Managers
                                           ƒ Electoral / Vote Staff
ƒ Appointment Setters

                                                                                                 1300 560 272 HOBAN.COM.AU
Members of the Outsourcing Oceania Group

    Program & Project                                                                 Transformation
                                                  Cyber Security                                                                     Digital & Cloud
      Management                                                                         Services

                                                                         Technical                              Information
                               Strategy &
                                                                        & Business                              Management
                              Architecture
                                                                         Analysis                                & Analytics

                                                                                 1300 4 INDEX | index.com.au

Awesome IT Professional Services
                                                                                 Get in touch today
   Hot Spots: Who’s in Demand?
   ?     Which IT roles are most difficult to recruit?

                                                                        When bundled, Digital, Data, and Information
                                                                        Management were ranked top by one in five
Perhaps unsurprisingly, Application Development and Security
                                                                        respondents. The appetite for smarter and faster
were high on the list of IT roles most difficult to recruit for 2020.
                                                                        business insights shows no signs of slowing.
Given the rapid enforced digital transformations many
organisations had to undertake due to COVID, and the adherent                       Project Management and Business Analysis have also remained
security issues with most office-based Australians transitioning to                 difficult to recruit, with the combination of technical and
working full-time from home for most of the year, demand for both
20%                                                                                 stakeholder management skills being perennially in demand.
Cyber Security and Development staff was high.

                                                                                                                 2017             2018            2019           2020
15%

10%

 5%

   0                      N/A N/A
                                                            pp re
                                         aly ss

                                                            me n

                                                                                                                                                                al

                                                                                                                                                                ta
               me on

                                nc l

                                                                 nt

                                                                                                  eg ati &
                                                            me re

                                                                                                       me ct

                                                                                                                                       y

                                                                                                                                                   ta*
                             ige cia

                                                         ge tio

                                                               ort

                                                                                                                                                             git
                                                                                                                                    rit

                                                                                                                                                            Da
                                            sis

                                                               nt
                 nt

                                   e

                                                                                                    rat on
                                                               nt

                                                         Su uctu

                                                                                                         nt
                                                                                               Int plic ess
                                       An sine

                                                              me

                                                                                                    ge je
                                                        lop tu
            lop ati

                                                                                                                                                 Da
                                                                                                       ion

                                                                                                                                                           Di
                          ell tifi

                                                                                                                                  cu
                                                      na rma

                                                                                                 na Pro
                                                     ve truc
          ve lic

                                                          ge

                                                                                                Ap Proc

                                                                                                                                Se
                       Int Ar

                                        Bu

                                                           tr

                                                                                                                                                   /
        De App

                                                                                                                                                al
                                                  MaInfo

                                                       ras

                                                        na
                                                  De ras

                                                                                                                                             git
                                                    Ma
                                                    Inf
                                                   Inf

                                                                                                                                           Di
                                                                                              Ma

                                                                                                 *Data for Digital and Data was combined in pre-2019 versions of the report
?      Forecasting demand for your organisation over the next 12 months, which IT role type do
          you expect to be in greatest demand?

 Overall Demand

          The combined result of 25% for Digital, Data
          and Information Management tells a strong Artificial Intelligence gained a further 5% of
25%       story of the market’s appetite for real-time the vote. AI and Machine Learning will play     Business Analysis and Project Management each
                                                       an increasingly large role in the collection,   achieved 10%, a drop from their 15 year averages
          insights to gain a competitive advantage.
                                                       curation and interpretation of big data.        of 15% and 12% respectively. The increased
                                                                                                       demand for Digital and Data-driven skills is likely
                                                        Security and Applications Development
20%                                                                                                    responsible for this reduction in numbers.
                                                        had equal results of 13%.

15%

10%

5%

  0
                                                                         pp re
                                   aly ss

                                                      me n
         me on

                          nc l

                                                                              nt

                                                                                               eg ati &
                                                      me re

                                                                                                                 me ct

                                                                                                                                   y

                                                                                                                                                al

                                                                                                                                                          ta
                       ige cia

                                                                            ort
                                                    ge tio

                                                                                                                                rit
                                      sis

                                                        nt
           nt

                             e

                                                                                                 rat on
                                                                      Su uctu
                                                        nt

                                                                                                                    nt
                                 An sine

                                                                                            Int plic ess

                                                                                                                                             git
                                                                           me

                                                                                                               ge je
                                                   lop tu

                                                                                                                                                        Da
      lop ati

                                                                                                    ion
                    ell tifi

                                                                                                                              cu
                                                 na rma

                                                                                                             na Pro
                                                ve truc

                                                                                                                                           Di
    ve lic

                                                                       ge

                                                                                             Ap Proc

                                                                                                                            Se
                 Int Ar

                                                                        tr
                                  Bu
  De App

                                                                    ras
                                             MaInfo

                                                                     na
                                             De s a

                                                                 Ma
                                                 r

                                                                 Inf
                                              Inf

                                                                                                           Ma

 Demand by Sector

20%

15%

10%

5%

  0
                                                     pp re

                                                                                           eg ati &
                                   aly ss

                                                      me n
                          nc l
         me on

                                                                                                                                y

                                                                                                                                            al

                                                                                                                                                       ta
                                                     me re

                                                                                                             me ct
                       ige cia

                                                         nt
                                       sis

                                                         nt

                                                        ort

                                                                                                                             rit
                                                   ge tio

                                                                                             rat on
                             e

                                                        nt
           nt

                                                                                                                nt
                                                   Su uctu

                                                                                        Int plic ess

                                                                                                                                         git
                                 An sine

                                                                                                                                                     Da
                                                                                                           ge je
                                                  lop tu

                                                                                                 ion
      lop ati

                                                       me

                                                                                                                           cu
                    ell tifi

                                                na ma

                                                                                                         na Pro
                                               ve ruc

                                                                                                                                       Di
    ve lic

                                                                                         Ap Proc

                                                                                                                         Se
                                                    ge
                 Int Ar

                                                    tr
                                 Bu

                                            MaInfor
  De App

                                            De rast

                                                 ras

                                                 na
                                              Inf

                                             Ma
                                             Inf

                                                                                                       Ma

                                                         Commercial                   Public Sector

  8 IT RECRUITMENT & RETENTION REPORT 2021
Salaries: Show us the Money
    ?      On average, at what percentage rate have your salaries for IT staff increased over the last 12 months?

        2.06% 2.43%    1.94% 2.56%      1.54% 1.27%       1.76%   1.79%     1.90%    1.73%       1.85%   1.93%   1.89%    1.59%    1.75% 1.08%      0.74%

                                                                                    Coming in at less than 1%, the reported salary increase
                                                                                    of 0.74% during 2020 is the leanest on record.
                                                                                    The previous record low was 1.54% in 2015.

                                                       With cost management being a key priority across public and private
                                                       sector organisations due to COVID-19, this result is unsurprising.
                                                       Interestingly, the highest ever expected increase was 4.62% in
                                                       2008, immediately prior to the GFC. The actuals for 2008 were                                        Expected
                                                       lower, although not drastically so, at 3.78%.
                                                                                                                                                            Actual

        2013           2014            2015              2016               2017                2018             2019              2020          2021

    ? Compared to 12 months ago, how                                                 ? When recruiting IT staff in the last year, have
           have the rates that you pay for IT                                                you had to pay more than you initially wanted
           contractor staff changed?                                                         or expected to, in order to attract the right
                                                                                             candidate?
The ten year average for those expecting to decrease IT contractor
pay rates is 9.3%. The prior year results, pre-COVID, were just 3%.                          With 47% having had to pay more than expected for IT staff
This jumped to 22% during COVID, and has now eased to 16% in                                 this is slightly above the 15 year average of 45.4%.
December 2020. This metric should be tempered by those intending
no change, which, at 56%, is closely aligned to the ten year average                         In the history of this report, there are two anomalous years
of 57.6%.                                                                                    in this metric: 2019, where 73% had to pay more, and 2017,
                                                                                             where just 13% had to pay more.
We predict that the in-demand roles shown in this report will
experience no softening in pay rates due to market competitiveness.                          This indicates that good people will always be in demand,
                                                                                             and will expect to be paid competitively.

                                                 16%                                  2020
                                                 Decreased
                                                                                      47% Yes                                                           53% No
56%
The same                                                                              2019
                                                                                      73% Yes                                                           27% No

                                                                                      2018
                                                                          15%
                                                                  Increased           44% Yes                                                           56% No

                                                                                      2017
                                                                                      13% Yes                                                           87% No

                                                                                      2016
                                                                                      38% Yes                                                           62% No

                                                              13%
                                                       Don’t use IT
                                                       contractors

                                                                                                                         IT RECRUITMENT & RETENTION REPORT 2021 9
Resourcing Strategies: Buy or Build
      ? Which statement most closely reflects your approach to recruitment?
                                                           When recruiting IT people, I am happy if they don’t have all the skills
                                                                    required, so long as they have the right attitude

                                                         71%                                                                            19%

                         Permanent                                                                   Contract
29%

                                                                                81%

      When recruiting IT people, the most important consideration is that the person
                              has all the skills to do the job

 ? What is most important to you in the service you receive from your recruitment partner?

                                                                                                   Finding the best people remains
                                                                                                   unchanged from its five year average,
            They find me                                                                           taking out the top spot yet again.

                                              29%
            the best people                                                                        Saving time and looking after
                                                                                                   contractors have also maintained
                                                                                                   their five year average positions.

                                                                                                         It is interesting to consider the cost metric.
                                                                                                         This is consistently edged out by contractor
                                                                                                         care, for which Clicks is proud of its market-
 They save me
                              19%
                                                                                                         leading reputation.
 a lot of time                                                                                           Reporting also nips at the heels of cost,
                                                                                                         suggesting that organisations are seeking
                                                                   They look after their                 quality, timely recruitment services that
                                                                                                         support their business objectives in equal
                                                                           contractors                   proportion to managing costs.

                                              19%
                       They provide a
                                                              18% 15%
                                                                                                   They provide me with
                       low-cost service
                                                                                                   accurate reporting

 10 IT RECRUITMENT & RETENTION REPORT 2021
Resourcing Strategies: Graduates
 ? Do you have a graduate program for IT staff?                                     ? Have you hired IT graduates in the last 12 months?

       It is extremely pleasing to see an upward trajectory of IT          We are especially heartened by programs targeting gender diversity
       graduate programs. These are a critical means to ensuring           and neurodiversity.
       a continuous supply of IT talent over the longer term.
                                                                           Clicks has particular expertise in both of these areas. Contact us to learn
       Graduate programs are a lower-cost recruitment option, and          more about the commercial advantages of engaging more neurodiverse
       provide you with the mechanism to onboard and train talented        workers and achieving gender balance in your IT workforce.
       young people specifically to meet your organisation’s needs.

2020                                                                               2020
 40% Yes                                                         60% No              34% Yes                                                      66% No

2019                                                                               2019
 37% Yes                                                         63% No              32% Yes                                                      68% No

2018                                                                               2018
 38% Yes                                                         62% No              32% Yes                                                      68% No

2017                                                                               2017

 32% Yes                                                         68% No              27% Yes                                                       73% No

2016                                                                               2016

 36% Yes                                                         64% No              27% Yes                                                       73% No

 Staff Turnover and Retention
?       What has been the approximate % rate of your IT                                        ? Have you made any IT staff redundant
        staff turnover over the last 12 months?                                                      in the last 12 months?

                                                                      14%
                                        4%                0% - there has
                          4%                                                                  2020
                                      21%+               been no IT staff
                     16–20%                                                                    66% No                                              34% Yes
                                                          turnover in my
                  7%                                        organisation.
               11–15%                                                                         2019
                                                                                               72% No                                              28% Yes

                                                                                              2018
         17%
       6–10%                                                                                   79% No                                               21% Yes

                                                                                              2017
                                                                                               68% No                                              32% Yes

                                                                                              2016

                                                                   54%                         73% No                                              27% Yes
                                                                  0.1–5%

       The majority of turnover is less than 5%. With 54%
       of respondents falling into this bracket for 2020, this
       compares to a 15 year average of 48.2% for this metric.

                                                                                                                  IT RECRUITMENT & RETENTION REPORT 2021 11
? Do you expect you will make any IT staff                                                 ? In the last 12 months have you had
        redundant during the next 12 months?                                                        employment offers you have made to
                                                                                                    candidates rejected?
 2020
                                                                                                      29%
  71% No                                                             29% Yes                            Yes

 2019
  78% No                                                             22% Yes

 2018
  81% No                                                              19% Yes

 2017

  72% No                                                             28% Yes

 2016
                                                                                                                                                                            71%
  79% No                                                              21% Yes                                                                                                  No

                                                                                        In a year like no other, it could reasonably be anticipated
                                                                                        that fewer organisations experienced candidates
                                                                                        rejecting job offers. This was borne out in the results,
                                                                                        with a record low of 29% of employers receiving
                                                                                        rejections. This compares to a five year average of 40%.
                                                                                        Employment security was a top priority for many workers
                                                                                        during the uncertainty of COVID-19.

  ? Which of these special initiatives does your organisation provide to improve staff retention?

                                                                     These results are largely unchanged from prior year, with flexible working
                                                                     hours and the ability to work remotely being the clear winners.
                                                                     This year we are pleased to introduce two new metrics: having a corporate
100%                                                                 wellness program, and diversity and inclusion initiatives. Both of these rank
                                                                     highly, with around half of all respondents already having them in place.
                                                                                                                                                                                        2020
                                                                                                                                                                                        2019
80%                                                                                                                                                                                     2018
                                                                                                                                                                                        2017
                                                                                                                                                                                        2016

60%

40%

20%

                                                                                                                                                         N/A N/A N/A N/A    N/A N/A N/A N/A
 0%
          Performance       Salary      Training/      Flexible       Reward &       Opportunity      Ability to   Ability to work   Complimentary        Corporate        Diversity &
        related bonuses   packaging   professional   working hours   recognition    to contribute    purchase        remotely        fruit/soft drinks    Wellness          Inclusion
                                      development                      program     to community      additional                             etc.           Program         Initiatives
                                          plans                                       activities    annual leave

 12 IT RECRUITMENT & RETENTION REPORT 2021
? Which of these special initiatives, in your opinion, is most effective in improving staff retention?
                                                                                                    As per the previous graph, flexible working hours and the
                                                                                                    ability to work remotely are regarded as being the most
                                                                                                    effective initiatives to improve staff retention.

                                        18%                     Flexible working hours
                                                                                                    Indeed, these policies are now viewed as critical to any
                                                                                                    organisation’s ability to attract high-calibre staff in the future.

                                                                                                                    Training/professional development, bonuses and salary
                                                                                                                    packaging are also ranked as high-value offerings.

                              16% 13%                                Training / Professional development            This aligns with the data that Clicks contractors provide
Ability to work remotely                                                                                            in our annual IT Workforce Insights report.
                                                                                                                    Contact your Clicks Account Manager to receive a copy.

                                                                                  Salary packaging

Performance related bonuses
                                     11%                10%
                                                                         6%                  Ability to purchase additional annual leave

                                                9%                                            Diversity & Inclusion Initiatives

                                                          5% 5%
      Reward and Recognition programs
                                                                                              Opportunity to contribute to community activities
                                                                                4%
                         Corporate Wellness Programs                                                         Complimentary fruit, soft drinks etc.
                                                                                           3%

    IT Health Check
       ? In order to assess the health of the IT industry, we asked respondents to indicate how
            strongly they agree or disagree with the following five statements: *
            ƒ    We can see that for the next three years demand for                  ƒ   The supply of IT talent is aligned to the demand for it
                 IT services and products will remain strong
                                                                                      ƒ   The industry has a reputation for delivering value and
            ƒ    IT is meeting business demands and driving business                      results, on time and on budget
                 improvement
            ƒ    IT budgets are increasing as a % of company revenue

                   65%           61%         63%          61%         61%          62%           64%              67%             67%             65%

                                                                                                                                                                  59%

   60%

   50%

   40%

   30%

   20%

   10%

    0%
                2010          2011       2012          2013       2014         2015          2016            2017            2018             2019            2020

         * Converting  the responses to a percentage, where 100% would mean a totally healthy industry and 0% would be totally
           unhealthy, our health rating for the IT industry has continued to increase in comparison to previous years.

                                                                                                                        IT RECRUITMENT & RETENTION REPORT 2021 13
About You and Your Organisation

     ? What industry sector is your organisation in?                                 ? How many staff do you have responsibility for?

                                        5%
                                        Transport and Resources
                                                                       7%                            5%                  2%
               7%                                             Banking and                            101-500            500+
               Utilities                                 Financial Services                                                    9%
                                                                                            6%                                  0
                                                                                            51-100
  2%                                                                          12%
  Telco                                                               Education

3%
Retail /
Manufacturing

 8%
 Other

      12%                                                                              35%
      IT (vendor/                                                                      11-50
      software)
                                                                        35%                                                          43%
                           9%                                    Public Sector                                                        1-10
                           Health

      ? How long have you been working at your                                       ? Do you consider yourself:
           current employer?
                                                                                                     1%
                                                                                                     Baby Boomer
                                                       7%                                            (born 1946–1964)          36%
                                                       Less than 1
                                                                                                                               Gen X
                                                       year                      20%
                 25%                                                                                                           (born 1965–1976)
       More than 10                                                              Gen Z
              years                                                              (born 1998–2010)

     12%                                                                      35%
     7–10 years                                                        1–3 years

                                                                                                     43%
                                                 21%                                               Gen Y
                                         4–6 years
                                                                                        (born 1977–1997)

     14 IT RECRUITMENT & RETENTION REPORT 2021
Did you find this report useful?

The quality of our reports improve with every hiring
manager who contributes.

If you hire contract or permanent IT staff, your
contribution is very important to us and all readers of
this report.

If you would like to become a contributor, please
contact Sam Micich, General Manager, Operations
on 03 9963 4802 or sam.micich@clicks.com.au to
ensure you receive your invitation to our next survey.

Clicks’ Services

Contract Recruitment                                            Permanent Recruitment
Clicks places an IT professional into a new job every           Our team has an average of 12 years’ IT recruitment
hour of every day. We have 25 years’ experience in the          experience. For employers this means a deep
IT contracting market, and over 80 Preferred Supplier           understanding of your requirements and an established
Agreements with some of Australia’s most respected              network of high calibre talent. For job seekers, our market
employers. Whether you’re looking for work or looking for       knowledge, relationships and support will open the right
staff, we’re here to help you.                                  doors for you.

Campaign Recruitment                                            Master Vendor
We work with high growth organisations who need to grow         For clients with larger-scale recruitment requirements,
their team quickly in response to product development           Clicks has a proven Master Vendor model that offers a
demands or customer growth. Our campaign service                single point of release for all roles, and the management
mobilises a dedicated team to undertake deep market             of all downstream suppliers. Clicks is also responsible
penetrative search activity to deliver a volume of resources    for managing compliance, job allocation, performance
in rapid time.                                                  management, payroll, quality, and customer satisfaction.

Market Reports                                                  Candidate Capability Testing and
For over 15 years Clicks has been conducting critical           Benchmarking
research to assist employers in attracting the best talent.
Regularly surveying over 500 of Australia’s leading             Clicks has partnered with leading assessment organisations
employers of IT professionals, we produce a range of            to improve the quality of information you use to make
easy-to-read reports to enable better hiring decisions. Our     hiring decisions, establish clear capability benchmarks for
reports cover market conditions, business confidence, hiring    your team, reduce time spent interviewing inappropriate
intentions, emerging technologies, gender diversity, salary     candidates, and improve the quality of candidates you hire.
surveys and more.

IT Professional Services                                        Contingent Workforce Engagement
Clicks can provide the full spectrum of IT professional         Our systems guarantee that our contractors receive
services via our sister company, INDEX Consultants. INDEX       accurate pays on time every time. Clicks utilises robust
specialises in delivering transformational projects and         and scalable systems for online timesheeting, payroll
outcomes. They leverage a network of trusted consultants        management and reporting/analytics services. 95% of our
and technology partners to ensure that you work with            contractors give us the highest ‘trust’ rating possible for
subject matter experts on every engagement. INDEX               our payroll management capability. We can also seamlessly
Consultants’ credibility, knowledge, experience and service     interface with your systems to ensure hassle free data
focus make them the preferred partner for Australia’s largest   delivery and reporting.
government and commercial organisations.
Melbourne                            Sydney                            Brisbane                          Canberra
   Level 35, 360 Collins Street,      Level 14, 55 Clarence Street,       Level 8, 127 Creek Street,         Level 9, 224 Bunda Street,
      Melbourne VIC 3000                  Sydney NSW 2000                    Brisbane QLD 4000                  Canberra ACT 2601
03 9963 4888 | vic@clicks.com.au   02 9200 4444 | nsw@clicks.com.au   07 3027 2555 | qld@clicks.com.au   02 6202 7700 | act@clicks.com.au
You can also read