2021 Outlook January 27, 2021 - Pivoting to a Post-Pandemic Expansion
←
→
Page content transcription
If your browser does not render page correctly, please read the page content below

January 27, 2021
2021 Outlook
Pivoting to a Post-Pandemic Expansion

           Investment management services provided by City National Bank through its wholly-owned subsidiary City National Rochdale, LLC, a registered investment advisor.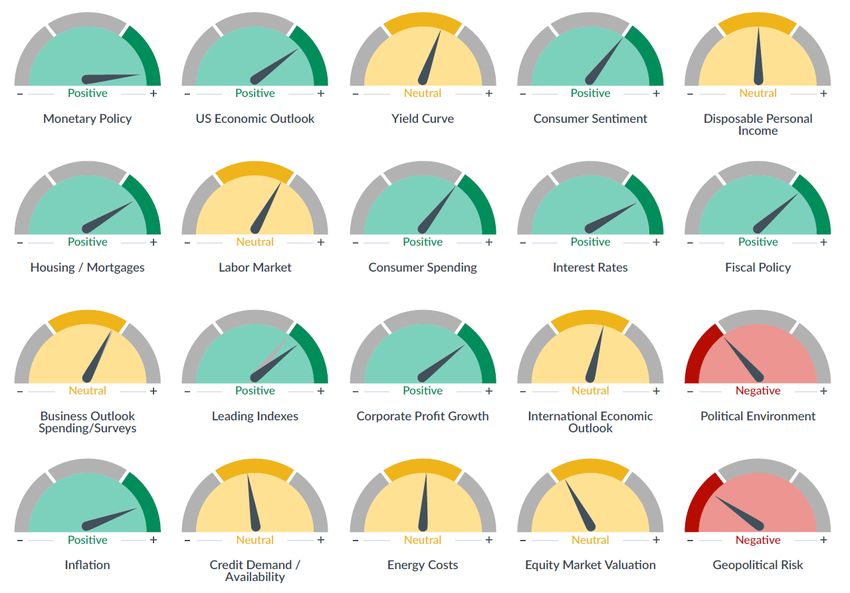
TABLE OF CONTENTS
                    Economic & Market Outlook

                    Large Cap Core Equities

                    High Dividend & Income Equities

                    Core Fixed Income

                    Opportunistic Fixed Income

                                                      2
ECONOMIC & MARKET OUTLOOK
Pivot to the Post-Pandemic Expansion
• Risk of significant or prolonged capital destruction was high in the first half of 2020
• Amid extreme uncertainty in Q1, we implemented our cash preservation strategy
• As confidence in a post pandemic recovery improved, we shifted strategy to capital
appreciation
• Fully invested, increased equity exposure, including mid/small cap
• Potential reversion in high dividend equities and opportunistic fixed income
• Expect long-term outperformance:
Differentiated asset allocation
Regional equity allocation
Opportunistic income focus
Bespoke alternatives
Source: CNR Research.
3ECONOMIC & MARKET OUTLOOK
We Know A Lot More Now
2020 High Uncertainty 2021 Improving Confidence
Will policymakers respond quicker and more powerfully Policy response has been massive, timely and well
than in the past? targeted
How soon can effective vaccines by developed and Projecting ~2/3 of U.S. to be vaccinated by mid-year,
distributed? allowing for a return to more normal activity
How significant will Covid economic restrictions be? Repeated widespread lockdowns have been avoided
Narrow Democrat congressional majorities mean
Which party will control Congress & the Presidency?
significant policy shifts unlikely
Source: CNR Research.
4ECONOMIC & MARKET OUTLOOK
Economic and Financial Indicators
Indicators Are Forward-Looking Six to Nine Months
Indicators signaling a
more durable recovery
from the COVID crisis
developing in the
second half of 2021 as
vaccine availability
becomes widespread.
Source: City National Rochdale. As of January 2021.
5ECONOMIC & MARKET OUTLOOK
Looking Ahead to the End of the Pandemic
Vaccine process expected to speed up significantly, inoculating most of the U.S. by mid-May
Infections expected to continue decline until near-zero levels reached in early summer
Sources of uncertainty: new virus strains, vaccine administration hurdles, manufacturing
Model: Projected New Infections vs. Immunity
300,000,000 700,000
250,000,000 70% of Population 600,000
500,000
200,000,000
Immunity through Vaccination
New Infections 400,000
150,000,000
300,000
100,000,000
200,000
Immunity through Infection
50,000,000 100,000
0 0
Source: Gu, Y. COVID-19 projections using machine learning. https://covid19-projections.com. Accessed 1/24/2021.
6ECONOMIC & MARKET OUTLOOK
Policy Response Has Been Massive, Timely & Well Targeted
Fiscal support has been orders of magnitude larger than during the GFC, and delivered far quicker
Fed official committed to remain accommodative until after economic and inflation growth sets in
The Fed’s balance sheet has increased +$3.2t over the past year, and it will increase almost another +$1.5t in 2021.
Fiscal Response (% GDP) Federal Reserve Balance Sheet Assets
20 8
$Trillions
18
7 +$3.2 Trillion
16
14 6
12 5
10
4
8
6 3
4 2
2
1
0
2020 2021e 2009 2010 2011 0
Covid Great Financial Crisis 2006 2008 2010 2012 2014 2016 2018 2020
Source: CBO, Bloomberg.
7ECONOMIC & MARKET OUTLOOK
Consumers in Strong Shape….
Rising financial markets and home prices have lifted consumer net worth to all-time highs
U.S. household debt burden is now lowest on record
Household Net Worth Household Debt (% Disposable Income)
(Billions) 14
$125,000
$5 Trillion Higher than 13
Pre-pandemic Level
$120,000
12
11
$115,000
10
$110,000
9 40 Year
Low
$105,000 8
2018 2019 2020 1980 1984 1988 1992 1996 2000 2004 2008 2012 2016 2020
Source: St. Louis Fed.
8ECONOMIC & MARKET OUTLOOK
Labor Market Set to Recover Quicker than Past Recessions
Two-thirds of the 25 million jobs initially lost have already returned
49% of the remaining unemployed are on temporary layoff
Total Unemployment (Thousands)
25,000
Permanent Job Losers
20,000
Temporary Job Losers
Other
15,000
10,000
5,000
0
Jan-20 Feb-20 Mar-20 Apr-20 May-20 Jun-20 Jul-20 Aug-20 Sep-20 Oct-20 Nov-20 Dec-20
Source: Bureau of Labor & Statistics.
9ECONOMIC & MARKET OUTLOOK
Conditions in Place for Multi-Year Expansion
U.S. GDP expected to recover to pre-pandemic level sometime late Q3
Economy likely won’t get back to potential until end of 2023 at the earliest
US GDP
$Billions, 2012 dollars, SAAR
23,000
Actual/Blue Chip Estimates Potential GDP Upper Case (4% avg. growth)
22,000 Base Case (3% avg. growth) Lower Case (2% avg. growth)
21,000
20,000
19,000
18,000
17,000
2015 2016 2017 2018 2019 2020 2021 2022 2023 2024 2025
Source: BEA, Blue Chip Economic Indicators.
10ECONOMIC & MARKET OUTLOOK
Strong Recovery Expected in 2021
Recent Covid resurgence likely to cause relatively weak start to year
Expect sharper recovery to take hold as vaccine distribution becomes widespread
Potential for more stimulus under Democrat controlled government is lifting growth prospects
Q2 Q3 Q4 Q1 2020 2021 2022
2020 2020 2020 2021
Potential GDP 4% 4% -3.6% 6.0% 4.5%
-31% 33%
Growth Range 2% 0% -3.7% 4.0% 2.5%
Percent Change From Preceding Period, Seasonally Adjusted at Annual Rates
City National Rochdale Forecasts 2019 2020e 2021e 2022e
GDP Growth 2.3% (3.6%) - (3.7%) 4.0%-6.0% 2.5%-4.5%
Corporate Profit Growth 1% (15%) - (20%) 20%-30% 10%-20%
Interest Fed Funds Rate 1.625% 0%-0.25% 0%-0.25% 0%-0.25%
Rates Treasury Note, 10-Yr. 1.90% 0.92% 0.80%-1.30% 0.90%-1.40%
Source: Bureau of Economic Analysis, Standard & Poor’s, Bloomberg. As of January 2021.
11ECONOMIC & MARKET OUTLOOK
Focused Regional Allocations May Enhance Returns
U.S. better positioned than Europe for short-term recovery and long-term economic growth
Emerging markets in Asia present a more positive growth outlook than other emerging markets
Regional Equity Market Performance: 5 Years as of 12/31/2020
Overweight
16% 15% Overweight
14%
14%
12%
Overweight
10% 9%
Underweight
Underweight
8% 7%
7%
6%
4%
2%
0%
U.S. Core Equities U.S. High Dividend Europe Emerging Markets Asia Emerging Markets
Equities excluding Asia
Source: Bloomberg. U.S.: S&P 500 Index. Europe: MSCI Europe Index. Emerging Markets Asia: MSCI Emerging
Markets Asia Index. Emerging Markets Excluding Asia: MSCI Emerging Markets Excluding Asia Index.
12ECONOMIC & MARKET OUTLOOK
Equities Still Look Attractive vs. Investment Grade Bonds
The level of interest rates is an increasingly important element to consider when valuing equities
Today’s lower-than-average interest rates justify higher-than-average price/earnings ratios
Equity Risk Premium
8%
Stocks Cheap
6%
4%
2%
0%
-2%
Stocks Expensive
-4%
-6%
1969 1972 1975 1978 1981 1984 1987 1990 1993 1996 1999 2002 2005 2008 2011 2014 2017 2020
Source: Bloomberg, FactSet.
13ECONOMIC & MARKET OUTLOOK
Investing in a Low Interest Rate Environment
Low interest rates and high stock valuations → lower returns in the future
Need to expand investment toolkit beyond traditional asset classes to meet long-term goals
Asset Class 1975-2019 2009-2019 Long-term Forecast
US Stocks 12% 14% 7%
Investment Grade Bonds 8% 6% 2%
60% Stocks/
10% 10% 5%
40% Bonds Portfolio
Source: CNR Research, Bloomberg. US Stocks: S&P 500 Index. Investment Grade Bonds: Bloomberg Barclays
US Corporate Bond Index.
Long-term forecasts reflect City National Rochdale’s capital market assumptions, derived by CNR to reflect
forecast returns across asset classes for use as inputs into CNR’s portfolio construction process. These model
expected returns do not show actual performance and are for illustrative purposes only. They do not reflect actual
trading, liquidity constraints, fees, expenses, taxes and other factors that could impact the future returns. Past
performance is not a guarantee of future results. The expected returns are net of any City National Rochdale
management fees; however, other fees may apply.
14ECONOMIC & MARKET OUTLOOK
2021 Market Outlook
Positive, but Moderate Portfolio Returns Expected
2021 Forecasted Expected Returns (%)
16
14 Emerging
MidSmall Cap Asia Alternatives
Dividend & 6%-12% 7%-12% 6%-12%*
12
U.S. Growth Income Balanced
6%-10% 6%-10% Portfolio
10
Developed Tax- (60/40)
Markets Taxable Exempt 6%-8%
8
5%-7% 5%-7%* 5%-7%*
6
4 Tax-
Taxable Exempt
1%-2% 1%-2%
2
0
Core Opportunistic Balanced
Equities Alternative
Fixed Income Fixed Income Portfolio
Source: City National Rochdale. As of January 2021. Forecasted expected returns represent City National
Rochdale’s opinion for these asset classes, are for illustrative purposes only, and do not represent client returns.
The expected returns presented for these asset classes do not reflect any deductions for City National Rochdale
fees or expenses. Actual client portfolio and investment returns will vary.
*Forecasted expected returns for HY Municipal and Municipal FI represent the taxable equivalent return at a
43.4% tax rate.
15LARGE CAP CORE EQUITIES
Pivot to a Post-Pandemic Expansion
Fully invested
Focus on undervalued quality franchises that will benefit from cyclical rebound
Theme Focus
Consumer Venturing back into the world – brick and mortar retail
Investing in the home
Theme
Return to normal spending patterns
Digital Revolution Semiconductor content for auto and industrial
Financial Services Unique consumer focused, Strong regions in US
Increased Economic Cyclicality Improving industrial production
Source: CNR Research.
16LARGE CAP CORE EQUITIES
Pivot to Post Pandemic Expansion
Focus on Key Themes
High Quality
21%
34%
Reasonable Valuations
10%
15%
45%
Sustainable Business
Models
Consumer Normalizing Digital Revolution* Healthcare Innovators
Industrial Leaders Domestic Growers* *Some companies appear in multiple categories
Source: CNR Research.
17HIGH DIVIDEND & INCOME EQUITIES
Targeting Consistent Income and Strong Total Return
Potential to benefit from a high current dividend yield, strong dividend growth, and price appreciation — now with
increased confidence in the result
Qualified income and long-term strong total returns — could end up higher back half of 2021
Equity Market 6%-10%
Appreciation Expected Total Return
2%-5%
Dividend Growth
3%-4%
Dividend Yield
Source: CNR Research.
18HIGH DIVIDEND & INCOME EQUITIES
High Dividend Stocks: Yields Currently at Attractive Levels
High Dividend Stocks Dividend Yield vs. 10 Year Treasury Yield
8%
7%
6%
5%
4%
+1.6%
3% +2.0%
+3.1%
2%
1%
0%
High Dividend Stocks: Dividend Yield 10 Year Treasury Yield
Source: Bloomberg. High dividend stocks: Dow Jones U.S. Select Dividend Index.
19HIGH DIVIDEND & INCOME EQUITIES
High Dividend Stocks Appear Relatively Attractive
Valuation discount between high dividend and growth stocks the largest since the tech bubble
High dividend stocks outperformed growth stocks by 9.6% annually 2002-2006
Valuations: High Dividend Stocks vs. Growth Stocks
Price/Earnings Ratio
40
35
30
25
20
15
10
5
0
2002 2003 2004 2005 2006 2007 2008 2009 2010 2011 2012 2013 2014 2015 2016 2017 2018 2019 2020
High Dividend Stocks Growth Stocks
Source: Bloomberg. High Dividend Stocks: Dow Jones U.S. Select Dividend Index. Growth Stocks: S&P 500
Growth Index.
20HIGH DIVIDEND & INCOME EQUITIES
Potential for Reversion of High Dividend Equities
Valuation difference similar to the tech bubble
Historically, underperformance of recent magnitude has been followed by outperformance
Rolling 5 Year Relative Returns
High Dividend Stocks vs. S&P 500
25%
20%
High Dividend Stocks
15% Outperform
10%
5%
0%
-5%
-10%
-15%
S&P 500
Outperforms
Source: Bloomberg. High dividend stocks: Dow Jones U.S. Select Dividend Index.
21HIGH DIVIDEND & INCOME EQUITIES
Targeting Consistent Income and Strong Total Return
High Dividend and Income Strategy performance has historically achieved long-term goals
Seeks to provide strong income in a low interest rate environment with potential for capital appreciation
CNR High Dividend and Income Composite
Annual Performance
40%
30%
20%
Average Calendar
10% Year Return: 9%
0%
-10%
-20%
-30%
2002 2003 2004 2005 2006 2007 2008 2009 2010 2011 2012 2013 2014 2015 2016 2017 2018 2019 2020
Please refer to the composite disclosure slide at the end of this presentation for further detail.
22CORE FIXED INCOME
Key Points
Fed policy will remain accommodative and support risk assets
Expect rates to rise modestly and the 10-yr to end the year between 80-130bps
Inflation will firm, and test investor’s resolve, but is unlikely to change the long-term trend
Corporate and municipal balance sheets will likely improve from prior dire predictions
Favor opportunistic asset class returns over low-yielding investment grade
Expect 1-2% in Investment Grade and 5-7% in High Yield Fixed Income asset classes this year
Source: CNR Research.
23CORE FIXED INCOME
Federal Reserve Set a High Bar for Rate Hikes
To raise rates, the FOMC is looking for sustained average core-PCE above 2% and “full employment”
The Fed is not even “thinking about thinking about raising rates” – Chairman Powell
Fear of a taper overdone, watch Fed leadership for signs of a policy shift (Powell, Clarida, Brainard, Williams)
FOMC Members Median Fed Funds Forecast
3.00%
2.50%
2.00%
1.50%
1.00%
0.50%
0.00%
2020 2021 2022 2023 Longer Term
Source: Bloomberg, Federal Reserve, CNR Research.
24CORE FIXED INCOME
Inflation to Stay Low
The rebound in prices is likely transitory and doesn’t mean L-T trend inflation is heating up
The negative output gap and labor gap are expected to remain in disinflationary territory
Monetary expansion is not making its way into circulation, but fiscal spending is a risk
US Real Output Gap as a % of GDP
US Employment to Population Ratio
6.00
66
4.00
64
2.00
Inflationary
62
0.00
-2.00 60
-4.00 58
-6.00
Deflationary 56
-8.00
54
-10.00
52
-12.00
-14.00 50
2010 2012 2014 2016 2018 2020 2022 2024 2026 2028 2030 2001 2003 2005 2007 2009 2011 2013 2015 2017 2019 2021 2023
Source: Bloomberg, CBO, BLS, CNR Research.
25CORE FIXED INCOME
Municipal Credit – Pandemic impact is uneven
Revenue volatility manageable for most states, much better than the GFC
States have monopolistic taxing power and high flexibility to adapt
Democrats are seeking further support from the next fiscal package
Change in tax revenue between March-October 2019 and March-October 2020
…but most
States reliant on States have
tourism and oil have adapted well
fared worse…
Source: State Tax and Economic Review Project, State and Local Finance Initiative at Urban Institute.
26CORE FIXED INCOME
High Yield Municipals Remain Favorable
HY Muni Yields Remain Favorable versus High Quality Bonds
18%
16%
14%
12%
10%
8%
6.5%
6%
4%
2%
0.9%
0%
2004 2005 2006 2007 2008 2009 2010 2011 2012 2013 2014 2015 2016 2017 2018 2019 2020
10-yr UST 3-mo Rolling Average Yield Barclays HY Muni Tax Equiv. Yield Rolling 3-mo Avg*
*Assumes a Federal Tax rate of 35%
Source: Bloomberg, CNR Research.
27CORE FIXED INCOME
Corporate Credit
Credit spreads have tightened sharply since last March, but remain above pre-GFC lows
The global search for yield likely to drive spreads to historical tights
While leverage is high, interest coverage is strong and balance sheet liquidity is strong
Bloomberg Barclays US Aggregate Index Corporate Option-Adjusted Spread
5.5
4.5
3.5
2.5
1.5
0.5
Source: Bloomberg, CNR Research.
28OPPORTUNISTIC FIXED INCOME
Key Points
High yield markets appear attractive vs. investment grade
Defaults are nowhere near pessimistic forecasts from earlier in 2020 and have stabilized
Riskier segments of High Yield are rallying despite absorbing most of the defaults
Structured credit is likely well insulated from principal loss
High Yield structured credit is relatively cheap vs. Traditional US High Yield
Source: CNR Research
29OPPORTUNISTIC FIXED INCOME
Opportunistic Income Appears Relatively Attractive
We have long favored opportunistic income over investment grade amid low interest rates
Interest rates declined further in 2020, driving investment grade bond returns and causing CNR underperformance
Opportunistic income relatively attractive vs. very low-yielding investment grade
Yields: Current vs. Pre-Crisis
10%
9% 8.7%
7.8%
8%
7%
6.1%
6% 5.2%
5.2%
5% 4.6% 4.7%
4.0% 4.2%
4%
2.8%
3% 2.5%
2% 1.7%
1%
0%
US Investment Grade US CLOs - US High Yield Emerging Market US Leveraged Loans US CLOs - High
Corporate Bonds Investment Grade Corporate Bonds High Yield Bonds* Yield
12/31/2019 12/31/2020
*Excluding yields above 15% using Bloomberg SRCH screen.
Source: Bloomberg. U.S. Investment Grade Corporate Bonds: Bloomberg Barclays U.S. Agg Corporate Bond Index. U.S. CLOs – Investment Grade: Palmer Square CLO
Indices (avg. of investment grade indices). U.S. High Yield Corporate Bonds: Bloomberg Barclays U.S. Corporate High Yield Index. Emerging Market High Yield Bonds:
Bloomberg Barclays Emerging Markets High Yield Index. U.S. Leveraged Loans: S&P LSTA Leveraged Loan Index. U.S. CLOs – High Yield: Palmer Square CLO Debt
BB Index.
30OPPORTUNISTIC FIXED INCOME
High Yield Defaults Reflect Improving Environment
High yield bond defaults appear to have peaked at lower levels than past crises
Positioned for strong returns as economy recovers
High Yield Default Rates vs. Forward 12-Month Return
80% 16%
14%
60%
12%
40%
10%
20% 8%
6%
0%
4%
-20%
2%
-40% 0%
2001 2002 2003 2004 2005 2006 2007 2008 2009 2010 2011 2012 2013 2014 2015 2016 2017 2018 2019 2020
Forward 12-month Return Default Rate
Source: CNR Research, Bloomberg. Investment Grade Bonds: Bloomberg Barclays Intermediate Corporate Bond
Index. High Yield Bonds: Bloomberg Barclays U.S. Corporate High Yield Index.
31OPPORTUNISTIC FIXED INCOME
Positioning for a New Credit Cycle
Volatility and reduced interest rates contributed to strong investment grade performance in 2020
Stimulus, continued strong growth, low rates support non-investment grade going forward
Peak to Trough Recovery
Full Year 2020
2/28 – 3/23 3/23 – 12/31
U.S. Investment Grade Corporate Bonds -13.2% 22.0% 9.9%
U.S. CLOs – Investment Grade -14.7% 21.9% 4.2%
U.S. High Yield Corporate Bonds -18.7% 33.5% 7.1%
Emerging Market High Yield Bonds -21.6% 34.5% 4.3%
U.S. Senior Secured Loans -19.4% 29.0% 3.1%
U.S. CLOs – High Yield -30.7% 58.9% 9.5%
Source: CNR Research, Bloomberg. Investment Grade Bonds: Bloomberg Barclays Intermediate Corporate Bond
Index. U.S. CLOs – Investment Grade: average of Palmer Square CLO Debit AAA, AA, A and BBB indices. U.S.
Corporate High Yield Bonds: Bloomberg Barclays U.S. Corporate High Yield Index. Emerging Market High Yield
Bonds: Bloomberg Barclays Emerging Markets High Yield Bond Index. U.S. Senior Secured Loans: S&P/LSTA
Leveraged Loan Index. U.S. CLOs – High Yield: Palmer Square CLO Debt BB Index.
32OPPORTUNISTIC FIXED INCOME
Riskier Parts of the Market Are Rallying
The high yield energy sector and CCC-Rated debt have seen returns above non-energy sectors and higher rated debt
This behavior is indicative of investor comfort with the fundamental credit backdrop and early credit cycle returns
Trailing 12-Month Defaults vs. Returns Since Sep. 30th, 2020
25%
21.81%
21.19%
20%
16.53%
15%
11.98%
10%
5.82% 6.19%
4.99%
5% 3.94%
0%
Energy Only Without Energy CCC-Rated Without CCC
Default Returns Since 9/30
Source: Bloomberg, ICE Data Services
August 31, 2000 – December 31, 2020.
33OPPORTUNISTIC FIXED INCOME
Structural protections of collateralized loan obligations
Structured credit utilizes diversification and structuring to mitigate default risk
Potential to generate higher yields with similar or reduced credit risk
Default Rates: High Yield vs. Leveraged Loans vs. CLOs
7%
6.17%
6%
5%
3.95%
4%
3%
2%
1.35%
1%
0%
U.S. High Yield Default Rate U.S. Leveraged Loan Default Rate CLO Average Default Rate
Source: JP Morgan.
34Q&A
Questions?
35INDEX DEFINITIONS
Index Definitions
The Standard & Poor’s 500 Index (S&P 500) is a market capitalization-weighted index of 500 common stocks chosen for market size, liquidity, and industry group
representation to represent U.S. equity performance.
The MSCI Europe Index is a free float-adjusted market capitalization index that is designed to measure developed market equity performance in Europe. As of September
2002, the MSCI Europe Index consisted of the following 16 developed market country indices: Austria, Belgium, Denmark, Finland, France, Germany, Greece, Ireland,
Italy, the Netherlands, Norway, Portugal, Spain, Sweden, Switzerland, and the United Kingdom.
MSCI Emerging Markets Asia Index is a free float-adjusted market capitalization index that is designed to measure equity market performance in the Asian emerging
markets.
The MSCI Emerging Markets ex Asia Index captures large and mid cap representation across 17 Emerging Markets (EM) countries*. With 268 constituents, the index
covers approximately 85% of the free float-adjusted market capitalization in each country excluding Asia.
The Bloomberg Barclays U.S. Corporate Bond Index is an unmanaged market-value-weighted index of investment-grade corporate fixed-rate debt issues with maturities
of one year or more.
The Bloomberg Barclays U.S. Corporate High Yield Index is an unmanaged, U.S.-dollar-denominated, nonconvertible, non-investment-grade debt index. The index
consists of domestic and corporate bonds rated Ba and below with a minimum outstanding amount of $150 million.
Bloomberg Barclays Intermediate Corporate Bond Index.
The Dow Jones Select Dividend Index seeks to represent the top 100 U.S. stocks by dividend yield. The index is derived from the Dow Jones U.S. Index and generally
consists of 100 dividend-paying stocks that have five-year non-negative Dividend Growth, five-year Dividend Payout Ratio of 60% or less, and three-month average daily
trading volume of at least 200,000 shares.
The Bloomberg Barclays Emerging Markets USD Aggregate Index tracks total returns for external-currency-denominated debt instruments of the emerging markets.
Countries covered are Argentina, Brazil, Bulgaria, Ecuador, Mexico, Morocco, Nigeria, Panama, Peru, the Philippines, Poland, Russia, and Venezuela.
The S&P/LSTA U.S. Leveraged Loan 100 Index is designed to reflect the performance of the largest facilities in the leveraged loan market.
The Palmer Square CLO Debt Index is a rules-based observable pricing and total return index for CLO debt for sale in the United States, rated at the time of issuance as
A, BBB or BB (or equivalent rating). Such debt is often referred to as the mezzanine tranches of a CLO.
The PCE Price Index Excluding Food and Energy, also known as the core PCE price index, is released as part of the monthly Personal Income and Outlays report. The
core index makes it easier to see the underlying inflation trend by excluding two categories – food and energy – where prices tend to swing up and down more
dramatically and more often than other prices. The core PCE price index is closely watched by the Federal Reserve as it conducts monetary policy.
36IMPORTANT DISCLOSURES
Important Information
The information presented does not involve the rendering of personalized investment, financial, legal, or tax advice. This presentation
is not an offer to buy or sell, or a solicitation of any offer to buy or sell any of the securities mentioned herein.
The material contains forward-looking statements regarding intent, beliefs, or current expectations which are used for informational
purposes only. Readers are cautioned that such forward-looking statements are not a guarantee of future performance, involve risks
and uncertainties, and actual results may differ materially from those statements as a result of various factors. The views expressed are
also subject to change based on market and other conditions. Furthermore, the opinions and information presented do not involve the
rendering of personalized investment, financial, legal, or tax advice.
Investments in below-investment-grade debt securities which are usually called “high-yield” or “junk bonds,” are typically in weaker
financial health and such securities can be harder to value and sell and their prices can be more volatile than more highly rated
securities. While these securities generally have higher rates of interest, they also involve greater risk of default than do securities of a
higher-quality rating.
Investing in international markets carries risks such as currency fluctuation, regulatory risks, economic and political instability. Emerging
markets involve heightened risks related to the same factors as well as increased volatility, lower trading volume, and less liquidity.
Emerging markets can have greater custodial and operational risks, and less developed legal and accounting systems than developed
markets.
Certain information has been provided by third-party sources and, although believed to be reliable, it has not been independently
verified and its accuracy or completeness cannot be guaranteed
Adjustments to portfolio strategies are based on guidelines set forth by City National Rochdale’s Asset Allocation Committee. Individual
client allocations among strategies, asset classes, portfolio weightings may be higher or lower given differences in portfolio holdings,
client imposed restrictions, and/or the customized strategy implemented by each client’s portfolio manager. These differences may
have a material impact on individual client’s performance returns.
Any opinions, projections, forecasts, and forward-looking statements presented herein are valid as on the date of this document and
are subject to change.
This material is available to advisory and sub-advised clients, as well as financial professionals working with City National Rochdale, a
registered investment advisor and a wholly-owned subsidiary of City National Bank.
Indices are unmanaged and one cannot invest directly in an index. Index returns do not reflect a deduction for fees or expenses.
This material represents an assessment of the market environment at a specific point in time and is not intended to be a forecast of
future events or a guarantee of future results.
37IMPORTANT DISCLOSURES
Important Information
This presentation is for general information and education only. City National makes no representations or warranties in respect of this
presentation and is not responsible for the accuracy, completeness or content of information contained in this presentation. City
National is not responsible for, and expressly disclaims all liability for, damages of any kind arising out of use, reference to, or reliance
on any information contained in or from the site. The information in this presentation should not be used to obtain credit or for any other
commercial purpose nor should it be construed as tax, accounting, regulatory or legal advice. Rules in the areas of law, tax and
accounting are subject to change and open to varying interpretations and you should seek professional advice from your advisor.
Nothing in this presentation should be construed as an offer, or solicitation of an offer, to buy or sell any financial instrument. It should
not be relied upon as specific investment advice directed to the viewer's specific investment objectives. Any financial instrument
discussed in this presentation may not be suitable for the viewer. Each viewer must make his or her own investment decision, using an
independent advisor if prudent, based on his or her own investment objective and financial situation. Prices and availability of financial
instruments are subject to change without notice. Financial instruments denominated in a foreign currency are subject to exchange rate
risk in addition to the risk of the investment. City National Bank (and its clients or associated persons) may, at times, engage in
transactions in a manner inconsistent with this presentation and, with respect to particular securities and financial instruments
discussed, may buy from or sell to clients or others on a principal basis. Past performance is not necessarily an indication of future
results.
Alternative investments are speculative, entail substantial risks, offer limited or no liquidity and are not suitable for all investors. These
investments have limited transparency to the funds’ investments and may involve leverage which magnifies both losses and gains,
including the risk of loss of the entire investment. Alternative investments have varying, and lengthy lockup provisions.
The expected returns shown do not include fees for trading costs (e.g., commissions) or any fees charged by your financial advisor.
Please speak to your financial advisor for a complete understanding of all fees.
Non-Deposit Investment Products:
Are not insured by the FDIC.
Are not deposits or other obligations of or guaranteed by City National Bank.
Are subject to investment risks, including possible loss of the principal amount invested.
Deposit products and services are provided by City National Bank Member FDIC. City National Bank is a subsidiary of Royal Bank of
Canada.
Redistributed with the permission of City National Rochdale.
38IMPORTANT DISCLOSURES
High Dividend & Income Equities – Annual Composite Disclosures
2019 2018 2017 2016 2015
Composite Gross Return (%) 25.3 -6.0 7.2 16.0 -1.8
Composite Net Return (%) 23.8 -6.9 6.1 14.9 -2.7
Benchmark One Return (%) 20.4 -5.5 10.5 14.2 -1.9
Benchmark Two Return (%) 26.4 -6.6 16.4 14.3 -3.0
Composite 3-Yr St Dev (%) 8.5 9.5 8.7 9.8 10.2
Benchmark One 3-Yr St Dev (%) 8.4 7.8 7.1 8.2 8.3
Benchmark Two 3-Yr St Dev (%) 10.6 9.8 9.4 10.1 10.2
Number of Portfolios 124 116 159 138 138
Non-Fee Accounts (%) 0 0 0 0 0
Internal Dispersion (%) 2.3 1.3 1.4 1.7 2.7
Composite Assets ($ M) 129 80 139 128 114
Firm Assets ($ M) 42,824 34, 339 32,862 26,272 22,584
2014 2013 2012 2011 2010
Composite Gross Return (%) 18.4 16.8 8.0 14.3 23.0
Composite Net Return (%) 16.9 15.3 6.6 12.8 21.5
Benchmark One Return (%) 17.2 15.7 12.0 10.0 20.6
Benchmark Two Return (%) 10.7 16.5 13.7 2.7 14.0
Composite 3-Yr St Dev (%) 9.2 9.4 9.2 10.7
Benchmark One 3-Yr St Dev (%) 7.3 9.4 11.5 19.9
Benchmark Two 3-Yr St Dev (%) 8.4 8.5 14.1 36.9
Number of Portfolios 100 75 81 54 62
Non-Fee Accounts (%) 0 0 0 0 0
Internal Dispersion (%) 2.3 2.6 1.5 2.1 2.9
Composite Assets ($ M) 89 63 51 34 44
Firm Assets ($ M) 20,073 15,261 4,874 4,210 3,577
City National Rochdale, LLC claims compliance with the Global Investment Performance Standards (GIPS®) and has prepared and presented this report in compliance with the GIPS standards. City National Rochdale, LLC has been independently verified for
the periods January 1, 2000 through December 31, 2018. Verification assesses whether (1) the firm has complied with all the composite construction requirements of the GIPS standards on a firm-wide basis and (2) the firm’s policies and procedures are
designed to calculate and present performance in compliance with the GIPS standards. The High Dividend and Income Equities Composite has been examined for the periods January 1, 2014 through December 31, 2018. The verification and performance
examination reports are available upon request.
1 City National Rochdale, LLC is a global multi-asset manager that invests in U.S.-based, International Developed, International Emerging and Alternative securities. City National Rochdale, LLC is a registered investment advisor and is an affiliate of City National Bank, its
parent company. City National Bank is an affiliate of Royal Bank of Canada, its parent company. On July 2, 2012, Rochdale Investment Management was acquired by City National Bank and combined with City National Asset Management, a division of the bank. For GIPS
compliance purposes, Rochdale Investment Management and City National Asset Management continued to operate separate firms through September 10, 2013.
2 The High Dividend and Income Equities Composite contains fully discretionary equity accounts primarily invested in common and preferred stocks, MLPs, REITs, and other income securities, with the objective to generate income and long-term capital appreciation. The
focus is on high-quality companies with a stable dividend history, potential for dividend growth, and attractive valuation. The portfolio’s income stream is a significant component of total return and may result in lower volatility Cand increased downside protection versus a
broad-market portfolio. The minimum account size for composite inclusion is $100,000. The composite was created on June 30, 2002. Prior to January 1, 2015, performance history represents only Rochdale Investment Management portfolios and starting January 1, 2015,
performance represents the combined City National Rochdale portfolios. A complete list of composite descriptions is available upon request.
3 Benchmark One as of 12/31/2013 is 50% DJ US Select Dividend / 15% MSCI US REIT Index / 25% ICE BAML Core Fixed Rate Preferred Securities Index / 10% Alerian MLP. Prior to 12/31/13 Benchmark One was the Dow Jones Select Dividend Index. The change was
made due to tactical and strategic allocation changes at the firm level and in order to maintain appropriate composite-to-benchmark comparisons. . Benchmark Two is the Lipper Equity Income Funds Index. The benchmarks are rebalanced monthly.
4 Gross of fee returns include the cost of brokerage commissions, but excludes the impact of management, custodial and other fees. The impact of any income taxes an investor might have incurred as a result of taxable ordinary income and capital gains realized by the
accounts. Net of fee performance was calculated using actual management fees for periods through 12/31/14. Starting 1/1/15, fees are modeled at 1.00%, the highest tier. (Fee schedule: 1.00% first $2 million; 0.80% next $3 million; 0.60% next $5 million and 0.50% in excess
of $10 million.) Starting 1/1/19, fees are modeled at 1.25%, the highest tier. (Fee schedule: 1.25% first $1 million, 1.00% next $4 million, 0.75% next $5 million and 0.50% in excess of $10 million.) Returns include the reinvestment of income.
5 Internal dispersion is calculated using the asset-weighted standard deviation of the monthly gross returns of those portfolios that were included in the composite for the entire year.
6 The 3-Year Annualized Ex-post Standard Deviation measures the variability of composite and the benchmark returns over the preceding 36-month period. For periods through 12/31/14, this was derived from the STDEVP function and starting 1/1/2015, STDEV is used.
The Standard Deviation is not represented prior to 2011 as this was not a requirement before January 1, 2011.
7 Policies for valuing portfolios, calculating performance and preparing compliance presentations are available upon request.
8 Valuations are computed and performance is reported in U.S. dollars.
9 Any composite account that has a cash flow of 10% or greater in a single transaction is eliminated from the composite for the current valuation period. The excluded account is eligible for the composite again at the next valuation period. This policy is effective as of the
composite inception date to present.
39
10 Past performance is not an indication of future results.For More Information
New York Headquarters
400 Park Avenue
New York, NY 10022
212-702-3500
Beverly Hills Headquarters
400 North Roxbury Drive
Beverly Hills, CA 90210
310-888-6000
info@cnr.com
www.cnr.com
40You can also read