2021 Presentation of results 3M2021 - Grupo Catalana Occidente - Grupo Catalana ...
←
→
Page content transcription
If your browser does not render page correctly, please read the page content below

2021   Presentation of results 3M2021
       Grupo Catalana Occidente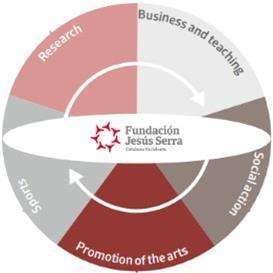
Table of contents
01 Keys of the period

02 Information 3M2021
          • Income statement
          • Capital, investments and solvency

03 Calendar and annexes

                                  @gco_news

     Download our App   Presentation based on data from the 3M2021 report published on 29/04/2021
                                                                                                    2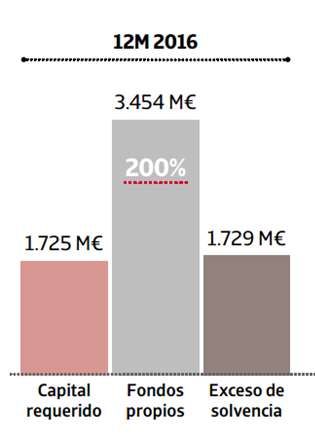
01   Keys of the period

                          3
01
Key financial figures
Economic and sectoral
environment
Sound solvency position
+29.9% Shareholder remuneration
+3.7% long-term capital at market
of dividends charged against 2020 results
value
401
Global economic environment
COVID-19: strong impact on growth in the economy
Global
GDP +2.8% 19 -3.3% 20 +6.0% 21e
Eurozone
GDP +1.2% 19 -6.6% 20 +4.4% 21e
U.S.
GDP +2.2% 19 -3.5% 20 +6.4% 21e
Spain
GDP +2.0% 19 -11.0% 20 +6.4% 21e
Emerging and developing
Latam economies in Asia
GDP +0.0% 19 -7.0% 20 +4.6% 21e GDP +5.5% 19 -1.0% 20 +8.6% 21e
Source: International Monetary Fund. April report 2021
501
Financial markets
Accommodative policy that keeps interest rates at minimums
4
2,5 2,5
2 2 3
1,5 1,5
2
1 1
0,5 1
0,5 0.9
0.1
0 0 0
0.1
2014 2015 2016 2017 2018 2019 2020 2014 2015 2016 2017 2018 2019 2020
-0,5 -0.6 2014 2015 2016 2017 2018 2019 2020
-0.6 -0,5
-0.7 -1
-1 -1
Spain 10 year bond Spain 1 year bond Germany 10 year bond Germany 1 year bond US 10 year bond US 1 year bond
Stock Markets
Revaluation 2019 - 3M2021
+ 23.0% S&P
+13.9% MSCI World
+4.6% Euro Stoxx 50
-10.1% Ibex 35
2007 2008 2009 2010 2011 2012 2013 2014 2015 2016 2017 2018 2019 2020
Source: Bloomberg. Updated to April 2021
601
The insurance industry in Spain
Turnover in the Spanish insurance sector decreases, with a notable fall in life premiums
Premiums (
Insurance sector premiums 3M2021: -0.3%
64,155
55,486 58,889
-1.9% -3.7%
+1.3% -0.4% -8.2%
-0.7% 2.1% 12.2% -0.7%
2014 2015 2016 2017 2018 2019 2020 Risk Savings
-3.2% Life
Technical account result
3.9% 3.9%
5,578 1.2%
5,098 -1.8%
Motor Health Multi-risk Other
2013 2014 2015 2016 2017 2018 2019
+1.5% Non-Life
Source: ICEA April 2021
701
Key financial figures
Economic and sectoral
environment
Sound solvency position
+29.9% Shareholder remuneration
+3.7% long-term capital at market
of dividends charged against 2020 results
value
801
Grupo Catalana Occidente in 3M2021
(figures in
% Chg.
Income 3M2020 3M2021
20-21
Traditional business 875.6 884.5 1.0%
Recurring premiums 789.5 802.2 1.6%
Single premiums life 86.1 82.3 -4.4%
Credit insurance business 610.5 619.1 1.4%
Turnover 1,486.1 1,503.6 1.2%
(figures in
% Chg.
Results 3M2020 3M2021
20-21
Recurring result traditional business 55.4 57.1 3.1%
Recurring result from credit insurance business 48.3 67.6 40.0%
Non-recurring result -6.0 -2.1
Consolidated result 97.7 122.6 25.4%
Attributed result 90.2 110.5 22.5%
901
GCO: actions during the COVID-19 crisis
• Employee protection and operational support.
• Ensure employee protection and continuity of work. Teleworking of all our employees.
• We are still operational under extreme conditions.
• Maintenance of customer service.
• Continuity in the relationship with the customer through telematic means.
• Continuity in customer service for expert opinions, repairs, agency offices, etc...
• Measures aimed at the traditional business.
• Flexibility in payment of receipts, instalments and deferment.
• Adaptation of prices according to the circumstances of the risk and the customer,
• 24-hour medical guidance by telephone for any insured party, video consultation of medical staff and
cyber-risk protection in teleworking.
• Measures aimed at the credit insurance business.
• Flexibility in payment of receipts, instalments and deferment.
• Flexibility in the period of declaration of non-payment, extending it by 30 days.
• Discussions with the various governments to support commercial activity through credit insurance.
• Measures to support society.
• Participation with UNESPA in a fund to protect health workers facing COVID-19.
• The Jesús Serra Foundation collaborates with Save the Children and supports the CSIC for research in
a future vaccine.
• Support from the innovation programme to overcome the health challenges caused: Beat the Vid.
• The Group supports more than 20,000 suppliers affected by COVID-19 through interest-free advances.
1001
Diversification Grupo Catalana Occidente 12M2020
Balanced portfolio, complete offer
Life 23.4%
Diversified 6.8%
Credit insurance
31.7%
Motor 14.3%
Income from information
Multi-risk 15.1%
2.4%
59.7% Surety insurance 3.3%
Traditional business Accepted reinsurance 2.9% 40.3%
Credit insurance
30.2% retained business business
_____________________
1101
Global Presence
4th Largest insurance
group in Spain Diversification
by countries
2nd Largest credit insurance 66.8% Spain
group in the world
9.2% Central and Northern Europe
15.8% Western Europe
3.2% Southern Europe
50 countries 2.8% Asia and rest of the world
1,600 offices 2.2% The Americas
1201
Sustainability
Grupo Catalana Occidente subscribes to the principles of the United Nations Global Compact
and the Principles for Sustainability in Insurance (PSI) and has adhered to the Principles for
Responsible Investment (PRI). Furthermore, through current activity and social action, it
contributes to the Sustainable Development Goals (SDG) defined by the UN by promoting
aspects such as economic growth and progress, equal opportunities, quality learning, energy
efficiency and health and welfare care.
Employees and diversity Sustainability policy
- More than 96% permanent contracts In January 2021, the Board of Directors
- Work-life balance and diversity approved the Group's new Sustainability Policy,
programmes focusing its strategy on the creation of long-term
- Flexible working sustainable social value, as well as the
- We are committed to guaranteeing: equal management of social, environmental and good
opportunities, fair pay, lifelong learning governance risks.
and facilitating work-life balance.
On 25 February 2021, the Board of Directors approved the 2020 Sustainability Report, verified by an independent
external auditor and available on the Group's website.
1301
Key financial figures
Economic and sectoral
environment
Sound solvency position
+29.9% Shareholder remuneration
+3.7% long-term capital at market
of dividends charged against 2020 results
value
1401
Share price evolution
Shares in Grupo Catalana Occidente end the first quarter of 2021 at
36.9
32.6 34.0
32.0
30.2
27.5 31.2
26.0
24.0
29.2
22.9
14.7
14.5
15.7
12.9 13.8
8.8
12.3
4.3
3.2
2002 2003 2004 2005 2006 2007 2008 2009 2010 2011 2012 2013 2014 2015 2016 2017 2018 2019 2020
CAGR
Profitability (YTD) 3M2020 3M2021
2002 -3M21
GCO -40.87% 16.64% 12.97%
Ibex 35 -28.94% 6.27% 1.94%
EuroStoxx Insurance -35.81% 13.01% 3.51%
* Compound annual growth rate
1501
29.9% increase in dividends from 2020 results
The historical pattern of dividend distribution demonstrates the clear commitment of the Group to
remunerate its shareholders.
3.22
2.73 2.93
2.46
2.23 2.19
1.84 2.02
1.75 1.67
1.51
0.87 0.84
60% 34% 33% 34% 32% 31% 30% 28% 28% 21% 40%
25% 29%
0,51 0,51 0,52 0,57 0,57 0,72 0,78 0,82 0,88
0,59 0,63 0,67 0,68
2008 2009 2010 2011 2012 2013 2014 2015 2016 2017 2018 2019 2020
July 2019 Oct 2019 Feb 2020 May 2020 Dividends financial year 2019
81.5M total
Oct 2020 Dividends financial year 2020
July 2020 Feb 2021 May 2021
105.85M total
1602 Information 3M2021
1702 Information 3M2021
Income statement
Traditional business
Credit insurance business
Capital, investments and solvency
1802
Traditional business
Single and
complementary 11.0% Multi-risk
+1.6% 802.2 million 25.5%
Recurring premiums
Periodic 17.6%
Distribution
model
88.9% -0.3 p.p. Death 5.3%
Motor 23.8%
Combined ratio Health 5.3%
Diversified
11.6%
+3.9% 802.2M
Technical result
COVID-19 Impact:
+3.1% The impact of the health crisis has resulted in a
Recurring result lower ratio combined with a lower claims
frequency, most notably in the health and motor
branches.
1902
Traditional business Multi-risk
Premiums Combined
earned ratio
+4.8% 95.4%
(figures in
% Chg.
Multi-risk 3M2020 3M2021 12M2020
20-21
Written premiums 191.1 200.2 4.8% 686.9
% Technical cost 57.1% 61.9% 4.8 55.0%
% Commissions 21.1% 21.0% -0.1 20.9%
% Expenses 12.4% 12.5% 0.1 13.1%
% Combined ratio 90.6% 95.4% 4.8 89.0%
Technical result after expenses 15.6 7.9 -49.4% 74.5
% on earned premiums 9.5% 4.6% 11.1%
Earned premiums 166.1 171.3 3.1% 676.1
2002
Traditional business Motor
Premiums Combined
earned ratio
-2.2% 83.9%
(figures in
% Chg.
Motor 3M2020 3M2021 12M2020
20-21
Written premiums 194.0 189.7 -2.2% 653.8
% Technical cost 68.0% 60.4% -7.6 66.5%
% Commissions 11.1% 11.3% 0.2 11.2%
% Expenses 12.2% 12.3% 0.1 12.7%
% Combined ratio 91.2% 83.9% -7.3 90.3%
Technical result after expenses 14.4 25.8 79.2% 63.4
% on earned premiums 8.9% 16.1% 9.7%
Earned premiums 163.6 160.6 -1.8% 655.5
2102
Traditional business Other
Premiums Combined
earned ratio
+4.1% 84.7%
(figures in
% Chg.
Other 3M2020 3M2021 12M2020
20-21
Written premiums 95.3 99.2 4.1% 312.2
% Technical cost 49.0% 53.1% 4.1 51.0%
% Commissions 19.3% 19.7% 0.4 19.0%
% Expenses 13.9% 11.8% -2.1 14.3%
% Combined ratio 82.3% 84.7% 2.4 84.4%
Technical result after expenses 13.9 11.8 -15.1% 48.9
% on earned premiums 17.5% 15.4% 15.4%
Earned premiums 78.2 76.7 -1.9% 312.4
2202
Traditional business Life
Premiums Combined Combined
premiums Ratio for funeral Ratio for health
+1.3% 84.3% 93.1%
(figures in
% Chg.
Life 3M2020 3M2021 12M2020
20-21
Life insurance turnover 395.2 395.4 0.1% 1,067.5
Health 120.4 121.5 0.9% 142.8
Funeral 38.7 39.1 1.0% 143.3
Periodic premiums 150.0 152.5 1.7% 476.5
Single premiums 86.1 82.3 -4.4% 304.9
Pension plan contributions 16.4 14.5 -11.6% 71.8
Net contributions to investment funds 0.2 0.2 0.0% 1.3
Technical result after expenses 17.6 18.3 4.0% 74.2
% on earned premiums 5.6% 6.7% 7.0%
Technical-financial result 22.7 25.7 13.2% 95.3
% on earned premiums 8.3% 9.3% 8.9%
Earned premiums 275.1 275.1 0.0% 1,066.1
Combined ratio Health 95.2% 93.1% -2.1 84.1%
Combined ratio Funeral 85.7% 84.3% -1.4 84.0%
2302
Traditional business
(figures in
% chg.
Traditional business 3M2020 3M2021 12M2020
20-21
Written premiums 875.6 884.5 1.0% 2,720.4
Life insurance premiums, ex. single 789.5 802.2 1.6% 2,415.5
Technical result after expenses 61.4 63.8 3.9% 265.4
% on earned premiums 9.0% 9.3% 9.8%
Financial result 12.9 13.0 0.8% 51.8
% on earned premiums 1.9% 1.9% 2.1%
Non technical result -4.3 -4.0 -16.3
Complementary act. Funeral B. 1.1 1.6 45.5% 4.6
Company income tax 15.8 17.4 -66.8
Recurring result 55.4 57.1 3.1% 238.6
Non-recurring result -1.3 -4.4 -10.3
Total result 54.1 52.7 -2.6% 228.3
Earned premiums 683.0 683.7 0.1% 2,710.1
Combined ratio (-0,1 p.p.)
commissions
Traditional
29,2% Sector
+ expenses Business
(-0,1 p.p.)
Technical cost 59,7%
(-0,2 p.p.)
88.9% 92,0
(-0,3 p.p.)
2402 Information 3M2021
Income statement
Traditional business
Credit insurance business
Capital, investments and solvency
2502
Credit insurance business
Surety insurance 5.5%
-0.1% 453.5M
Earned premiums Accepted reinsurance 6.8%
Distribution
model
Income from
62.3% -25.1 p.p. information 10.3%
Credit
Gross combined ratio
insurance
Income from Complementary
71.8%
Activities 5.5%
+198.4% 191.9M
Technical result
COVID-19 Impact:
+40.0% Re-pricing of risks and adaptation of risk appetite.
Recurring result Extension of most reinsurance agreements with
European governments (Annexes).
2602
Credit insurance business
-0.1%
Earned premiums
Spain and Portugal Central and Northern Europe
20.1% Earned premiums: 30.2% Earned premiums:
Change: -2.9% Change +7.6%
The Americas Western Europe
6.6% Earned premiums: 27.6% Earned premiums:
Change -14.8% Change -1.6%
8.1% Asia and rest of the world
Earned premiums:
7.4% Southern Europe
Earned premiums:
Change +2.9% Change -3.1%
0.2%
Purchased premiums and information services
2702
Credit insurance business
Performance of the gross combined ratio
78,2% 87,3%
61,5%
33,4%
33,7% Combined gross ratio
34,1%
44,5% 54,0%
28,2%
62.3%
(-25.1 p.p.)
3M 6M 9M 12M 3M 6M 9M 12M 3M
2019 2020 2021
Technical cost commissions + expenses
Performance of risk exposure (TPE)
587.1 622.8 653.4 672.5 614.5 633.0 +3.0%
15,9% 12,7%
Spain
56,2% 60,4%
Other Europe
27,9% 26,9% Rest of the
world
2016 2017 2018 2019 2020 3M2021
(figures in
Further information in annexes: combined ratio credit insurance
2802
Credit insurance business
(figures in
% chg. 20-
Credit insurance business 3M2020 3M2021 12M2020
21
Earned premiums 453.9 453.5 -0.1% 1,727.4
Income from information 54.5 55.7 2.2% 133.1
Total income 508.4 509.3 0.2% 1,860.5
Technical result after expenses 64.3 191.9 198.4% 109.3
% on income 12.6% 37.7% 5.9%
Reinsurance result -7.2 -103.4 -28.1
Reinsurance transfer ratio 38.0% 37.0% 37.0%
Net technical result 57.1 88.5 55.0% 81.2
% on income 11.2% 17.4% 4.4%
Financial result 10.3 -0.5 -104.9% 5.1
% on income 2.0% -0.1% 0.3%
Result from complementary activities 2.0 3.4 70.0% 1.8
Company income tax -19.6 -22.7 -34.8
Adjustments -1.4 -1.1 -2.9
Recurring result 48.3 67.6 40.0% 50.4
Non-recurring result -4.7 2.3 -8.6
Total business result 43.6 69.9 60.3% 41.8
2902 Information 3M2021
Income statement
Traditional business
Credit insurance business
Capital, investments and solvency
3002
Financial strength
At the close of the first quarter, the Group's capital has increased by 3.7% supported by the results
1999 332
(figures in 2000 374
Permanent resources at 31/12/2020 4,138.3 2001 412
2002 420
Long-term capital at market value on 31/12/2020 4,663.4 2003 486
2004 779
Net equity on 01/01/2021 3,937.6 2005 1.296
(+) Consolidated results 122.6 2006 1.775
(+) Dividends paid -19.1 2007 2.027
(+) Change in valuation adjustments 65.3 2008 2.171
(+) Other changes 0.0 2009 2.009
Total movements 168.9 2010 2.135
2011 2.231
Total net equity on 31/03/2021 4,106.5
2012 2.343
Subordinated debt 200.7 2013 2.607
Permanent resources on 31/03/2021 4,307.2 2014 3.168
Capital gains not included in balance sheet 2015 3.263
(properties) 528.7 2016 3.509
2017 3.756
Permanent resources at market value on 31/03/2021 4,835.9
2018 3.909
2019 4.585
2020 4.663
3M2021 4.836
+3.7%
3102
Sound solvency position 216% at the close of 2020e
Catalana Occidente Group has a sound solvency and financial position to withstand adverse situations
12M 2019 12M 2020e*
The Solvency II ratio is maintained
around 160%, even in adverse
scenarios.
213% 216%
Own funds are of high quality (95%
of tier1).
* Data with transitional technical provisions and partial internal model.
Presentation of the report on the financial and solvency situation
April: Group companies
May: Grupo Catalana Occidente
3202
Credit rating
"The "a+" rating reflects the soundness of the balance sheet, the good business model, excellent operating
results and the appropriate capitalisation of the Group thanks to the internal generation of capital of the
Best highlights the prudence in underwriting, which is reflected
in a positive record of operating results with an excellent
A.M. Best operating entities of the Group combined ratio and a high return on equity (ROE).
They highlight the strong competitive position, strong
capitalization, low financial leverage and conservative
Moody's operating entities of the credit investment portfolio.
insurance business
3302
Investments
The Group invests in traditional assets through prudent, diversified management
(+2.5% compared to the funds managed at the end of 2020)
54.5% Fixed income 12.7% Properties
-1,6%)
Cash and monetary assets Other investments
16.9% 2,320.4M
1.7% 240.0M
13.5% Variable income 0.6% Investment in investee companies
3403 Calendar and annexes
3503
Schedule Analyst and investor relations
January February March April May June July August September October November December
25 29 29 28
Results Results Results Results
12M2020 3M2021 6M2021 9M2021
25 30 29 28
Presentation Presentation Presentation Presentation
of results of results of results of results
12M2020 3M2021 6M2021 9M2021
16.30 11.30 16.30 16.30
29
General
Meeting
2020
Interim Complement Interim Interim
dividend ary dividend dividend
2020 dividend 2021 2021
2020
Contact
Email: analistas@catalanaoccidente.com
Phone: +34915661302
https://www.grupocatalanaoccidente.com/accionistas-e-inversores
@gco_news
3603
Income statement
(figures in
% Chg.
Income statement 3M2020 3M2021 12M2020
20-21
Premiums 1,431.6 1,447.9 1.1% 4,426.4
Income from information 54.5 55.7 2.2% 133.1
Turnover 1,486.1 1,503.6 1.2% 4,559.5
Technical cost 744.1 706.1 -5.1% 2,917.8
% on net income 62.5% 59.2% 63.9%
Commissions 142.7 144.0 0.9% 560.6
% on net income 12.0% 12.1% 12.3%
Expenses 185.5 188.3 1.5% 749.5
% on net income 15.6% 15.8% 16.4%
Technical result after expenses 119.0 152.7 28.3% 339.8
% on net income 10.0% 12.8% 7.4%
Financial result 0.7 12.3 28.2
% on net income 0.1% 1.0% 0.7%
Result of non-technical non-financial account 5.0 -5.6 -14.1
% on total net income 0.4% -0.5% -0.3%
Result from compl. activities Credit insurance and
3.1 5.0 6.4
funeral business
% on total net income 0.3% 0.4% 0.1%
Profit before tax 127.8 164.4 28.6% 364.6
% on net income 10.7% 13.8% 8.0%
Taxes 30.1 41.8 94.5
% taxes 23.5% 25.4% 25.9%
Consolidated result 97.7 122.6 25.4% 270.1
Result attributable to minorities 7.6 12.1 7.8
Attributed result 90.2 110.5 22.5% 262.3
% on net income 7.6% 9.3% 5.7%
3703
Credit insurance business
Performance of the gross combined ratio
% Chg.
Combined ratio breakdown 3M2020 3M2021 12M2020
20-21
% Gross technical cost 54.0% 28.2% -25.8 58.6%
% Gross commissions + expenses 33.4% 34.1% 0.7 35.5%
% Gross combined ratio 87.4% 62.3% -25.1 94.1%
% Net technical cost 52.4% 32.9% -19.5 55.9%
% Net commissions + expenses 30.7% 31.4% 0.7 35.6%
% Net combined ratio 83.1% 64.3% -18.8 91.5%
87,3%
83,1%
78,2%
76,1%
71,3% 73,0%
62,7%
61,5%
3M 6M 9M 12M 3M 6M 9M 12M 3M 6M 9M 12M 3M
2018 2019 2020 2021
Gross combined ratio Net combined ratio
3803
Credit insurance business
Agreements adopted in the credit insurance business
Agreement Main features Conditions 2020 Renewal conditions H1 2021 Premiums Premiums
signed * granted 20 granted 21
Germany Guarantee contracts similar to proportional reinsurance. 65% of the premiums. 90% of the premiums.
Cover for risks underwritten between 1 January and 31 December 90% of the claims. 90% of the claims.
2020 (excluding claims reported before 1 March 2020). No commissions With commissions.
Belgium Instalment contract by tranches according to the claim ratio. Depending on the claims ratio, Depending on the claims ratio,
Cover for risks underwritten between 1 January and 31 December between 50% and 90% of premiums between 50% and 90% of premiums
2020 (excluding claims reported before 27 March 2020). and claims are ceded. and claims are ceded.
With commissions. With commissions.
The Netherlands Proportional reinsurance agreement. 90% of premiums and claims from new 90% of premiums and claims from
Cover for insured risks underwritten between 1 January and 31 policyholders. new policyholders.
December 2020 (excluding claims reported before 29 February 100% of premiums and 90% of claims 90% of premiums and 90% of claims
2020). of the insured in the portfolio. of the insured in the portfolio.
The government assumes all costs. The government assumes all costs.
Denmark Guarantee contracts similar to proportional reinsurance. 65% of the premiums. 58.5% of the premiums.
Cover for risks underwritten between 1 January and 31 December 90% of the claims. 90% of the claims.
2020 (excluding claims reported before 01 March 2020). No commissions No commissions
Luxembourg Instalment contract by tranches according to the claim ratio. Depending on the claims ratio, Depending on the claims ratio,
Cover for risks underwritten between 1 January and 31 December between 50% and 90% of premiums between 50% and 90% of premiums
2020 (excluding claims reported before 01 March 2020). and claims are ceded. and claims are ceded.
With commissions. With commissions.
France Reinsurance contract with a performance similar to that of the 75% of the premiums. 75% of the premiums.
quota share with certain particularities depending on the quality 75% of the claims. 75% of the claims.
of the risks assumed. Coverage of risks underwritten between 16 With commissions. With commissions.
March and 31 December 2020.
United Kingdom Guarantee contracts similar to proportional reinsurance. 100% of the premiums. 90% of the premiums.
Coverage of risks underwritten between 1 April and 31 December 90% of the claims. 90% of the claims.
2020. No commissions With commissions.
Norway Instalment contract part. 65% of the premiums. 58.5% of the premiums.
Cover for risks underwritten between 1 January and 31 December 90% of the claims. 90% of the claims.
2020 (excluding claims reported before 12 March 2020). No commissions No commissions
Spain Reinsurance contract in addition to that underwritten in the 31% of the premiums. 42% of the premiums.
private market. 31% of the claims. 42% of the claims.
Premiums and Claims from 1 October 2020 to 30 June 2021. With commissions. With commissions.
Italy Proportional reinsurance agreement. 90% of the premiums. 90% of the premiums.
Coverage of risks underwritten between 19 May to 31 December 90% of the claims. 90% of the claims.
2020. With commissions. With commissions.
*The measure is for trade credit originated by insured persons operating in the country with a signed agreement and
covers debtors from inside and outside that country.
The average commission is 30%
3903
Credit insurance business - TPE
(figures in
% Chg.
2016 2017 2018 2019 2020 3M 2021 % total
20-21
Spain and Portugal 93,437 98,714 99,453 98,739 79,231 80,269 1.3% 12.7%
Germany 82,783 86,430 90,599 93,024 93,568 97,234 3.9% 15.4%
Australia and Asia 79,013 84,233 92,222 95,595 84,153 86,182 2.4% 13.6%
The Americas 71,970 73,188 75,773 81,269 71,765 73,804 2.8% 11.7%
Eastern Europe 55,098 59,253 63,935 68,595 64,630 67,239 4.0% 10.6%
United Kingdom 43,794 43,537 44,989 51,019 46,339 48,314 4.3% 7.6%
France 43,323 49,326 51,866 48,407 45,239 47,068 4.0% 7.4%
Italy 37,208 42,242 44,263 43,661 42,001 42,994 2.4% 6.8%
Nordic and Baltic
26,964 28,738 30,525 31,748 30,779 31,786 3.3% 5.0%
countries
The Netherlands 25,268 27,636 29,650 30,392 29,875 30,602 2.4% 4.8%
Belgium and
15,708 16,701 17,285 17,444 16,959 17,374 2.4% 2.7%
Luxembourg
Rest of the world 12,538 12,830 12,842 12,627 10,011 10,147 1.4% 1.6%
Total 587,104 622,829 653,404 672,520 614,549 633,013 3.0% 100%
4003
Credit insurance business - TPE
(figures in
% Chg. % on
2016 2017 2018 2019 2020 3M2021
20-21 total
Electronics 70,510 74,476 77,433 82,858 73,189 74,752 2.1% 11.8%
Chemicals 78,593 82,783 86,479 87,466 82,804 85,628 3.4% 13.5%
Durable consumer goods 65,324 68,442 69,881 73,145 69,071 70,568 2.2% 11.1%
Metals 58,855 63,419 68,424 72,285 61,597 64,643 4.9% 10.2%
Food 55,640 58,608 63,001 64,587 63,860 65,962 3.3% 10.4%
Transport 53,434 56,930 60,461 61,128 53,098 54,523 2.7% 8.6%
Construction 43,133 46,896 49,773 51,495 47,072 48,372 2.8% 7.6%
Machinery 34,734 37,137 39,972 41,225 39,635 41,009 3.5% 6.5%
Agriculture 30,907 33,318 33,876 33,954 29,845 30,886 3.5% 4.9%
Construction Materials 25,387 27,058 28,359 29,389 29,345 30,408 3.6% 4.8%
Services 25,276 26,994 27,837 27,109 23,346 23,387 0.2% 3.7%
Textiles 19,855 20,562 20,324 19,660 15,404 15,418 0.1% 2.4%
Paper 13,590 13,929 14,525 15,065 13,151 13,762 4.6% 2.2%
Finance 11,867 12,277 13,058 13,156 13,131 13,695 4.3% 2.2%
Total 587,104 622,829 653,404 672,520 614,549 633,013 3.0% 100%
4103
General expenses and commissions
(figures in
% Chg.
Expenses and commissions 3M2020 3M2021 12M2020
20-21
Traditional business 75.4 73.6 -2.4% 312.6
Credit insurance business 110.2 114.8 4.2% 433.7
Non-recurring expenses 0.0 0.0 3.8
Total expenses 185.5 188.3 1.5% 750.1
Commissions 142.7 144.0 0.9% 558.6
Total expenses and commissions 328.2 332.3 1.2% 1,308.6
% expenses and commissions without recurring
24.4% 24.3% 28.5%
premiums
340,0 328,2 332,3
37,0%
320,0
35,0%
300,0 33,0%
280,0 31,0%
260,0 29,0%
240,0 24,3% 27,0%
24,4%
220,0 25,0%
200,0 23,0%
3M 2020 3M2021
Total expenses and commissions
% expenses and commissions without recurring premiums
4203
Financial result
(figures in
% Chg.
Financial result 3M2020 3M2021 12M2020
20-21
Financial income net of expenses 46.4 44.2 -4.7% 182.7
Exchange Differences -0.1 -0.4 0.0
Subsidiary companies 0.2 0.4 1.8
Interests applied to life -33.6 -31.2 -7.1% -132.7
Recurring financial results traditional business 12.9 13.0 0.8% 51.8
% on earned premiums 1.9% 1.9% 1.9%
Financial income net of expenses 3.8 1.2 -68.4% 13.5
Exchange Differences 9.5 0.0 5.5
Subsidiary companies 1.2 2.5 2.9
Interests subordinated debt -4.2 -4.2 -16.9
Recurring financial results from credit insurance 10.3 -0.5 5.1
% on net income from insurance 2.0% -0.1% 0.3%
Intra-group interest adjustment -0.4 -0.1 -0.9
Adjusted recurring financial results from credit
9.8 -0.6 4.2
insurance
Recurring financial results 22.8 12.4 60.3
% on total Group Income 1.9 1.0 1.3%
Non-recurring financial results -22.1 -0.1 -27.8
Financial result 0.7 12.3 28.2
4303
Non-recurring result
(figures in
Non-recurring result (net of taxes) 3M2020 3M2021 12M2020
Financial -16.5 -3.2 -22.1
Expenses and other non-recurring 11.1 0.0 6.1
Taxes 4.1 -1.2 5.7
Non-recurring from traditional business -1.3 -4.4 -10.3
Financial -5.6 3.1 -5.7
Expenses and other non-recurring 0.0 0.0 -3.8
Taxes 0.8 -0.8 0.9
Non-recurring from credit insurance business -4.7 2.3 -8.6
Non-recurring result net of taxes -6.0 -2.1 -18.9
4403
Investments
High fixed-income portfolio quality
Private AAA 4.3%
corporate
AA 6.3%
Fixed Income
58.4%
BBB and rest
46.3%
Fixed income Fixed income
by type by Rating
A 43.1%
Public fixed
income 41.6%
Duration 4.37
IRR 1.95%
United Rest of the world Public
States 7.3% services 7.4%
Rest of Non-cyclical
Financial
Europe 6.0% Consumer
39.7%
goods 13.7%
Germany
5.4%
United
Fixed income Fixed income Communication
Kingdom
by countries by sectors 11.3%
6.4%
France 11.1%
Spain 53.8% Industrial
Netherlands 10.4%
7.4% Energy 2.0%
Cyclical
Consumer
goods 15.5% 4503
Investments in liquid assets
High liquidity 13.5% variable income
Germany
Energy 1.4%
9.6% Europe 27.5%
United
Kingdom Financial
0.9% Non-cyclical 26.7%
Consumer
France 11.9% goods 17.8%
Netherlands Variable income Variable income
Cyclical
3.8% by countries by sectors
Consumer
goods 8.6%
Industrial
11.3%
United States Communication
18.3% 9.2%
Commodities 1.4% Technology
Rest of the 12.4%
Spain 27.0% world1.0%
Other 0.2%
Public Services 11.0%
4603
Balance sheet
(figures in
% Chg.
Assets 12M2020 3M2021
20-21
Intangible assets and property, plant and machinery 1,440.1 1,437.7 -0.2%
Investments 13,066.4 13,412.0 2.6%
Property investment 692.9 700.8 1.1%
Financial investments 10,895.6 11,038.4 1.3%
Cash and short-term assets 1,478.0 1,672.8 13.2%
Reinsurer share in technical provisions 1,108.1 1,213.8 9.5%
Other assets 1,753.2 2,118.9 20.9%
Deferred tax assets 271.9 246.9 -9.2%
Credits 971.0 1,253.8 29.1%
Other assets 510.3 618.2 21.1%
Total assets 17,367.7 18,182.4 4.7%
% Chg.
Net liabilities and equity 12M2020 3M2021
20-21
Permanent resources 4,138.3 4,307.2 4.1%
Net equity 3,937.6 4,106.5 4.3%
Parent company 3,578.9 3,731.1 4.3%
Minority interests 358.7 375.4 4.7%
Subordinated liabilities 200.7 200.7 0.0%
Technical provisions 10,982.5 11,389.3 3.7%
Other liabilities 2,247.0 2,485.9 10.6%
Other provisions 234.6 221.4 -5.6%
Deposits received on buying reinsurance 58.3 64.3 10.3%
Deferred tax liabilities 488.8 468.4 -4.2%
Debts 969.8 1,271.1 31.1%
Other liabilities 495.5 460.6 -7.0%
Total net liabilities and equity 17,367.7 18,182.4 4.7%
4703
Grupo Catalana Occidente
The business model of the Group is based on leadership in protection and long-term welfare for
families and companies in Spain and on the coverage of commercial credit risks at the international
level, seeking growth, profitability and solvency.
Insurance specialist Closeness global presence
Over 150 years of Distribution of intermediaries
experience Over 17,400 intermediaries
Complete offer Over 7,350 employees
Sustainable and socially Over 1,600 offices
responsible model Over 50 countries
Solid financial structure Technical rigour
Listed on the Stock exchange Excellent combined ratio
Strict cost control
Stable, committed 1999- 2020: profits multiplied by
shareholders 10
Diversified and prudent
investment portfolio
4803
Challenges for 2021
Milestone 2020 2021 Guidelines
Growth
- Turnover: To promote the development of distribution networks that
- Increased positioning in the health sector thanks to improve the participation of intermediaries and promote strategic
the incorporation of the Antares business. products.
- Increase of the insured offer and reinforcement in Continuous improvement of products and processes.
different business lines. Adaptation of supply to new market trends
New customer interaction capabilities
Advances in digitalization.
Profitability
- The consolidated result amounted to Improved underwriting.
- Excellent combined ratio of the traditional business Increase the technical and financial result.
88.6% Unification of Group systems
Group service concentration.
Evolution of the Contact Centre and Claims Centres.
Connectivity and individualization of the offer for brokers
Solvency
- The estimated solvency ratio at the end of 2020 is HR Management: people, talent and productivity.
216%. Analysis of flexible work models and teleworking.
- AM Best : A Excellent with a stable outlook on the Boost in the field of Sustainability.
main entities in the traditional and credit insurance Adaptation to IFRS 17.
main credit insurers.
4903
Creation of value
The vocation of Grupo Catalana Occidente is to consolidate a solid business and
generate sustainable social value. In 2020, the Group contributed
to society.
Evolution of contribution to society
(figures in
2018 2019 2020
Direct economic value generated 3,803.8 4,145.5 4330.8
Distributed economic value 3,725.6 4,035.1 3,933.5
Provisions provided to customers 2,252.1 2,461.5 2,385.9
Public Administrations 406.5 465.3 452.5
Intermediaries 488.6 505.6 512.2
Employees 481.2 499.7 496.6
Shareholders 94.7 100.5 81.5
Contributions to non-profit entities
2.4 2.5 4.8
and foundations
Retained economic value 78.2 110.4 397.3
For more information, see non-financial information in the 2020 annual report
5003
Fundación Jesús Serra
Fundación Jesús Serra is the
institution through which the
social action of Grupo Catalana
Occidente is channelled.
Its actions follow the humanist
values of its founder, Jesus
Serra Santamans
More than insurance....
... it participates in more than 60 projects helping those who need it most in the
fields of research, business and teaching, social action, sport and promotion of the
arts
5103
Global Presence
SaudiArabia Dubai(**) Asia
Europe China Shanghai(***)
Austria Vienna HongKong HongKong
Belgium Namur,Antwerp India Mumbai(***)
CzechRepublic Prague Indonesia Jakarta(**)
Denmark Copenhagen, Århus Japan Tokyo
Finland Helsinki Malaysia KualaLumpur(**)
France Paris,Bordeaux,Compiègne,Lille,Lyon,Marseille,Nancy,Orléans,Rennes,Strasbourg,Toulouse Philippines Manila(**)
Germany Cologne,Berlin,Bielefeld,Bremen,Dortmund, Singapore Singapore
Frankfurt,Freiburg,Hamburg,Hanover,Kassel, Taiwan Taipei(**)
Munich,Nuremberg, Stuttgart Thailand Bangkok(**)
Greece Athens Vietnam Hanoi(**)
Hungary Budapest Africa
Ireland Dublin Kenya Nairobi(*)
Italy Rome,Milan SouthAfrica Johannesburg
(**)
Luxembourg Luxembourg Tunisia Tunis(*)
The Netherlands Amsterdam, Ommen The Americas
Norway Oslo Argentina BuenosAires(*)
Poland Warsaw,Krakow,Poznan,JelenaGora Brazil SãoPaulo
Portugal Lisbon,Porto Canada Almonte(Ontario),Mississauga(Ontario),Duncan
Russia Moscow(***) (BritishColumbia)
Slovakia Bratislava Chile SantiagodeChile(*)
Spain Basque Country, Catalonia, Galicia, Andalusia, Asturias, Cantabria, La Rioja, Murcia, Mexico Mexico City, Guadalajara,Monterrey,
Valencia, Aragon, Castilla la Mancha, Navarra, Extremadura, Madrid, Castilla-Leon, Peru Lime(*)
Balearic Islands, Canary Islands, Ceuta and Melilla. USA HuntValley(Maryland),Chicago(Illinois),The
Sweden Stockholm Angeles(California),NewYork(NewYork)
Switzerland Zurich,Lausanne,Lugano Oceania
Turkey Istanbul Australia Sydney,Brisbane,Melbourne,Perth
UnitedKingdom Cardiff,Belfast,Birmingham, London,Manchester NewZealand Wellington
Middle East
Israel Tel Aviv(*)
Lebanon ( (*) Partnership and collaboration agreements
Beirut(*)
UnitedArab Emirates
Dubai **) (***) Services established with local partners
Saudi Arabia Dubai (**)
5203
Corporate structure
GRUPO CATALANA OCCIDENTE
Main entities
Seguros Catalana Occidente Tecniseguros GCO Gestión de Activos
Seguros Bilbao Bilbao Vida GCO Gestora de Pensiones
NorteHispana Seguros S. Órbita Catoc SICAV
Plus Ultra Seguros Previsora Bilbaina Agencia de Seguros Bilbao Hipotecaria
GCO Re Bilbao Telemark Sogesco
Inversions Catalana Occident Hercasol SICAV
CO Capital Ag. Valores GCO Activos Inmobiliarios
Cosalud Servicios
GCO Tecnología y Servicios
Prepersa
GCO Contact Center
Grupo Asistea
Grupo Compañía Española Crédito y
Atradius Crédito y Caución Atradius Collections
Caución
Atradius Re Atradius Dutch State Business Atradius NV
Atradius ATCI Atradius Information Services Atradius Participations Holding
Atradius Seguros de Crédito México Iberinform International Atradius Finance
Atradius Rus Credit Insurance Graydon
Crédito y Caución Seguradora de
Crédito e Grantias Brazil
COMPLEMENTARY INSURANCE
INSURANCE COMPANIES INVESTMENT COMPANIES
COMPANIES
Traditional business
Credit insurance business
5303
Risk strategy
Grupo Catalana Occidente defines its risk strategy based on risk appetite and tolerance, and
ensures that its integration with the business plan allows it to comply with the risk appetite
approved by the board.
The risk strategy is materialised through:
ᐅ Risk profile
Risk assumed in terms of solvency.
ᐅ Risk appetite
Risk in terms of solvency that the entity plans to accept in order to achieve its objectives.
ᐅ Risk tolerance
Maximum deviation from the Appetite that the company is willing to assume (tolerate)
ᐅ Risk limits
Operative limits established to comply with the Risk Strategy.
ᐅ Alert indicators
In addition, the Group avails of a series of early alert indicators that are the basis both for
monitoring the risks and for compliance with the risk appetite approved by the Board of
Directors.
5403
Risk map
RISKS INCLUDED IN PILLAR 1
Risk Description Regulation Mitigation
Risk of loss or of adverse change in the value of commitments - Underwriting policy and rate setting regulation - Reinsurance
contracted due to possible inadequate pricing and provisioning - Underwriting guidelines - DEM
Credit
assumptions. In the case of credit insurance, the risk arises from the - Authorisation matrices - Strict underwriting control
Underwriting
non-payment by our buyers (customers) of our customers, and in - Buyer rating monitoring and credit limit concessions - Control and monitoring of buyers' default risks
Risk
the case of surety, from the non-fulfilment of the contractual, legal or - IFRS and Local Regulations
fiscal obligations of our customers.
Risk of loss or of adverse change in the value of commitments - Underwriting and reserve policies - Strict control and monitoring of the combined ratio
contracted due to possible inadequate pricing and provisioning - Reinsurance policy - Catastrophic non-life risks are also mitigated through CCS
Non-life assumptions. - Underwriting manual and technical standards - Business value
Underwriting - Data quality policy - Reinsurance policy
Risk - National and international insurance regulations - Maintenance of business diversification
- Good practice guides
- Consortium
Risk of loss or of adverse change in the value of commitments - Underwriting and reserve policies - Strict control and monitoring of the combined ratio
contracted due to possible inadequate pricing and provisioning - Reinsurance policy - Business value
Health
assumptions. - Underwriting manual and technical standards - Reinsurance policy
Underwriting
- Data quality policy - Maintenance of business diversification
Risk
- National and international insurance regulations
- Good practice guides
Risk of loss or of adverse change in the value of commitments - Underwriting and reserve policies - Strict control and monitoring of the combined ratio
Life contracted due to possible inadequate pricing and provisioning - Reinsurance policy - Business value and profit test
and Funeral assumptions. This is broken down into biometric risks (which - Underwriting manual and technical standards - Reinsurance policy
Underwriting include the risks of mortality, longevity, morbidity/disability) and - Data quality policy - Maintenance of business diversification
Risk non biometric risks (fall in the portfolio, expenses, review and - National and international insurance regulations
catastrophe). - Good practice guides
Risk of loss or of adverse change in the financial situation resulting, - Investment policy - Asset management based on the principle of prudence
directly or indirectly, from fluctuations in the level and in the - Management based on the principle of prudence - Control of the different types of portfolio according to objectives
volatility of market prices of assets, liabilities and financial - Asset and liability valuation policy - Liability commitments to be hedged. Detailed asset-liability matching
Market
instruments. - Insurance regulations (LOSSP) analysis (ALM) and sensitivity analysis to future scenarios
Risk
- CNMV regulations - Types of investments suitable for hedging
- Distribution regulations - Dispersion and diversification limits
- Credit rating to be maintained
Counterparty risk arises from losses resulting from unexpected - Investment policy - Reinsurance with counterparties with a high credit rating
default or impairment in the credit quality of counterparties. - Reinsurance policy - Diversified investment portfolio with a high rating
Counterparty - Management based on the principle of prudence - Monitoring of the credit rating of the main financial counterparties
Risk - Insurance regulations and the reinsurer table
- CNMV regulations - Monitoring of trade credit risk exposures
- Distribution regulations
Risk of loss arising from inadequate or dysfunctional internal - SolvPRC / Risk Register tool - Internal control system
processes, personnel or systems or external processes. It also - Contingency plans
includes regulatory non-compliance - Data security and quality policy - SolvPRC
Operational
- Code of Ethics
Risk
- Procedure for action in cases of fraud (whistleblower channel) - Control of inherent risk and residual risk through the implementation
- Insurance regulations of preventive and mitigating controls upon the occurrence of an event.
- Principles of three lines of defence (COSO regulations)
5503
Risk map
RISKS NOT INCLUDED IN PILLAR 1
Risk Description Internal regulations Mitigation
Risk of non-compliance of obligations due to an inability to obtain the - Investment policy - Prudent-based asset management
necessary liquidity even if sufficient assets are in place
- Prudent management - Control of the different types of portfolio
- Reinsurance policy - Liability commitments to be hedged. Detailed asset-liability matching
Liquidity (ALM) analysis as well as sensitivity analysis to future scenarios
Risk - Insurance regulations
- Typology of investments suitable for hedging
- CNMV regulations
- Dispersion and diversification limits
- Distribution regulations
- Low level of indebtedness
Risks arising from the national and international economic and political - Underwriting regulations - Occupational risk prevention regulations to protect our employees and
environment, which have an impact on the volatility of financial - Written Policies (in particular investment policy) our customer
Political and variables and on the real economy. In particular, the risk of a global - Occupational risk prevention regulations - Risk underwriting
pandemic associated with Covid, the global economic crisis and the lax - Internal Code of Conduct - Strategic planning process and its follow-up
Economic monetary policy with interest rates at minimum levels should be - European regulations - Sectorial analysis
Environment highlighted - Sector analysis - Internal audit, internal control, complaints and whistleblowing channel
Risks - Global regulation associated with the economic recession and - Geographical and sectoral diversification in the Credit business
pandemic - Contingency plans (Brexit)
- -
Risk that constitutes the possibility of losses driven by environmental,
- - Internal Audit
social and governance factors (associated with the lack of business - Regulations of the Board of Directors - Internal Control
development under criteria of value for society, ethics, transparency - Prevention of money laundering - Complaints channel
and commitment to legality) - Code of Conduct - Occupational health and safety regulations
- Written policies (sustainability policy, climate change and - Corporate social responsibility report
Social,
environment policy, tax policy, outsourcing policy) - Monitoring and adaptation of strategic planning
Environmental
- Sustainability Master Plan - Code of conduct
and Governance
- Non-financial reporting regulations - Written policies (e.g. sustainability policy, climate change and
Risk
- European Sustainability Regulations (ESMA, EIOPA...) environment policy,...)
- Draft legislation on climate change - Sustainability Master Plan
- United Nations Sustainable Development Goals and Agenda 2030
- Recommendations of the Task Force on Climate-Related Financial
Disclosures (TCFD)
Risks not included in the previous groups, such as the risk of loss - Written policies - Exhaustive monitoring of the medium-term plan
arising from inadequate strategic decisions, their defective - Reputational risk management protocol - Code of ethics
implementation or inadequate adaptation to changes in the economic or - Social media usage manual - Procedure in case of irregularities and frauds
Other social environment (strategic risk), the risk associated with the - Advertising regulations - Requirements of aptitude and reputation
Risks occurrence of an event that has a negative impact on the Group's - Monitoring of information published in the media and social networks
reputation (reputational risk) or the risk arising from the - Control of the manual for the use of social networks
interdependence of the risks existing between Group entities (contagion - Action protocols for the management of reputational risk events
risk) - Continuous monitoring of business units
5603
Glossary
Item Definition Formulation
Technical Result of the insurance activity Technical result = (premiums accrued from direct insurance + premiums accrued from reinsurance
result accepted + information services and commissions) Technical cost Participation in benefits and
return premiums - Net operating expenses - Other technical expenses
Reinsurance Result due to transferring business to the Reinsurance result = Result of Inward Re + Result of ceded reinsurance
result reinsurer or accepting business from
other entities.
Financial Result of the financial investments. Financial result = income from financial assets (coupons, dividends, actions) - financial expenses
result (commissions and other expenses) + result of subsidiary companies - interest accrued on the debt -
interest paid to the insured parties of the life insurance business
Technical/fina Result of the insurance activity, including Technical/financial result = Technical result + Financial result
ncial the financial result.
result This result is particularly relevant for Life
insurance.
Result of non- Income and expenses that cannot be Result of non-technical non-financial account = Income - expenses that cannot be assigned to the
technical non- assigned to the technical or financial technical or financial results.
financial results.
account
Result of Result of activities that cannot be Result of credit insurance complementary activities = income - expenses
credit assigned to the purely insurance
insurance business.
complementar Mainly distinguishes the activities of:
y activities · Information services
· Recoveries
· Management of the export account of
the Dutch state.
Recurring Result of the entity's regular activity Recurring result = technical/financial result + non-technical account result - taxes, all resulting from
result normal activity
Non-recurring Extraordinary or atypical movements Non-recurring result = technical/financial result + non-technical account result - taxes, all resulting
result that may undermine the analysis of the from extraordinary or atypical activity
income statement.
These are classified depending on their
nature (technical, expenses and financial)
and by business type (traditional and
credit insurance)
5703
Turnover Turnover is the Group's business volume. Turnover = Premiums invoiced + Income from information
It includes premiums that the Group Premiums invoiced = premiums issued from direct insurance + premiums from accepted reinsurance
generates in each of the business lines
and the income from services pertaining
to the credit insurance.
Managed Amount of the financial and property Managed funds = Financial and property assets entity risk + Financial and property assets policyholder
funds assets managed by the Group risk + Managed pension funds
Managed funds = fixed income + variable income + properties + deposits in credit entities + treasury +
investee companies
Financial This shows the debt and solvency Debt Ratio = Debt / Equity + Debt
strength situation.
This is principally measured through the
debt ratio, the interest coverage ratio and Interest coverage ratio = result before taxes / Interest
the credit rating.
Technical cost Direct costs of accident coverage. Technical cost = claims in the year, net of reinsurance + variation of other technical provisions, net of
See claims. reinsurance
Dividend yield The profitability per dividend or dividend Dividend yield = dividend paid in the year per share / value of the price of the average share.
yield shows the relationship existing
between the dividends distributed in the
previous year with the value of the
average share.
Indicator used to value the shares of an
entity.
Modified Sensitivity of the value of the assets to Modified duration= Represents an approximation of the value of the percentage variation in the value
duration movements in interest rates of the financial assets for each percentage point (100 basic points) of
variation in the interest rates.
Expenses The general expenses include the costs Expenses = personnel expenses + commercial expenses + various expenses and services (allowance,
incurred for management of the business, training, management rewards, material and other office expenses, leases, external services, etc.)
excluding those that can be assigned to
claims.
Permanence This measures the customer's Permanence index= how long do you think that you will remain a customer?
index expectations of continuing with the
entity
Scale from less than 1 year to over 5 years
5803
Company This measures the general satisfaction of Overall satisfaction index = (Satisfied dissatisfied) / respondents
satisfaction the customer with the entity Satisfied responses with result from 7 to 10
index Scale from 1 to 10 Dissatisfied responses with result from 1 to 4
Service This measures the evaluation of the Service satisfaction index = (Satisfied dissatisfied) / respondents
satisfaction service received Satisfied responses with result from 7 to 10
index Scale from 1 to 10 Dissatisfied responses with result from 1 to 4
Income from Measures the income directly derived Income from insurance = premiums accrued from direct insurance + premiums accrued fro accepted
insurance from the activities of insurance and reinsurance + information services and commissions
information services
Investments Non-dependant entities where the Group Investments in associated / subsidiary entities = accounting value of the economic investment
in associated / has significant influence
subsidiary
entities
Net Promoter This measures the degree of customer Net Promoter score = Would you recommend the company to family and friends? = (promoters-critics)/
Score loyalty with the entity respondents
NPS Promoters: responses with result equal to 9 or 10
Critics: responses with result from 1 to 6
Pay out Ratio that indicates the part of the result Pay out = (Total dividend/ Result of the year attributable to the parent company) x 100
distributed among investors through
dividends
Price Earnings The price-earnings ratio or PER measures PER = Price of the share at market close / Result of the year attributable to the parent company per
Ratio PER the relationship between the price or share
value of the entity and the results.
Its value expresses what the market pays
for each monetary unit of results.
It is representative of the entity's
capacity to generate results.
Ex. single Total premiums without considering Ex. single premiums = Invoiced premiums - single premiums in the life business
premiums non-periodic premiums in the Life
business
Technical Amount of the obligations assumed that
provisions are derived from insurance and
reinsurance contracts.
Combined Indicator that measures the technical Combined ratio = Ratio of claims + ratio of expenses
ratio profitability of the Non Life insurances.
5903
Net combined Indicator that measures the technical Net combined ratio = Net ratio of claims + net ratio of expenses
ratio profitability of the non life insurances net
of the reinsurance effect
Expenses Ratio that reflects the part of the income Expenses ratio = Expenses from operation / Income from insurance
ratio from premiums dedicated to expenses.
Net expenses Ratio that reflects the part of the income Net expenses ratio= (Net expenses from reinsurance operation) / (premiums attributed to direct
ratio from premiums dedicated to expenses, business and accepted reinsurance + information services and commissions)
net of the reinsurance effect
Claims ratio Business indicator, consisting of the Claims ratio = Claims / Income from insurance
proportion between claims and earned
premiums.
Net claims Business indicator, consisting of the Net claims ratio= Claims in the year, net of reinsurance / (premiums attributed to direct business and
ratio proportion between claims and earned accepted reinsurance + information services and commissions)
premiums, net of the reinsurance effect.
Permanent Resources that can be included in own Permanent resources = Total net equity + subordinated liabilities
resources funds.
Permanent Resources that can be included in own Permanent resources at market value = Total net equity + subordinated liabilities + capital gains
resources at funds at market value associated to properties for own use + capital gains associated to property investments
market value
Resources Amount that the Group returns to the Resources transferred to the company = claims paid + taxes + commissions + personnel expenses +
transferred to main stakeholders. dividends
the company
Return On Financial profitability or rate of return ROE = (Result of the year. Attributable to the parent company) / (Simple average of the Equity
Equity Measures the performance of the capital attributed to shareholders of the parent company at the start and end of the period (twelve months)) x
ROE 100
Claims See technical cost. Economic evaluation Claims = Payments made from direct insurance + Variation of the provision for services of direct
of claims. insurance + expenses attributable to services
Total This is the potential exposure to risk, also TPE = the sum of the credit risks underwritten by the Group for each buyer
Potential "cumulative risk".
Exposure Credit insurance business term
TPE
6003
Disclaimer
This document has been prepared by Grupo Catalana Occidente exclusively for use in the presentation of results.
The forward-looking statements or predictions that may be contained in this document do not constitute, by their
very nature, guarantees of future compliance, as they are subject to risks, uncertainties and other relevant factors,
which may result in the developments and final results differing materially from those stated on these pages.
Among these factors, we can highlight the following: performance of the insurance sector and of the overall
economic situation in the countries where the entity operates; modifications to the legal framework; changes in
monetary policy; pressure from the competition; changes in trends upon which the mortality and morbidity tables
are based which affect the insurance activity in the areas of life and health; frequency and severity of the claims
subject to coverage, both in the scope of the insurance activity and of general insurance such as life; fluctuation of
the interest rates and the exchange rates; risks associated to the use of derived products; effect of future
acquisitions.
Grupo Catalana Occidente is not obliged to periodically revise the content of this document in order to adapt it to
events or circumstances posterior to this presentation.
The statements of this declaration must be taken into account by all people or entities that may have to adopt
decisions or make or publish opinions relative to securities issued by the Company and, in particular, by the
analysts and investors that use this document.
61Thank you www.grupocatalanaoccidente.com
You can also read