2021 Quantitative estimates of post-release survival rates of sharks captured in Pacific tuna longline fisheries reveal handling
←
→
Page content transcription
If your browser does not render page correctly, please read the page content below
2021

 Quantitative estimates of post-release survival rates of sharks
 captured in Pacific tuna longline fisheries reveal handling and
 discard practices that improve survivorship

 Melanie Hutchinson1,2,3, Zach Siders4, Jennifer Stahl1,3 and Keith Bigelow3
 1
 Joint Institute for Marine and Atmospheric Research, University of Hawaii, Honolulu, Hawaii
 USA
 2
 Hawaii Institute of Marine Biology, University of Hawaii, Kaneohe, Hawaii USA
 3
 National Oceanic and Atmospheric Administration, Pacific Islands Fisheries Science Center,
 Fisheries Research and Monitoring Division, Honolulu, Hawaii USA
 4
 Fisheries and Aquatic Sciences, School of Forest Resources and Conservation, University of
 Florida, Gainesville, Florida USA

PIFSC Data Report DR-21-001.
Issued 10 March 2021.
https://doi.org/10.25923/0m3c-2577
Contents
Abstract........................................................................................................................................................................ iv
 Key words: ............................................................................................................................................................. iv
List of Acronyms ....................................................................................................................................................... v
Introduction ................................................................................................................................................................ 1
Methods ........................................................................................................................................................................ 3
 Fishing and Tagging............................................................................................................................................ 3
 Survival Analysis .................................................................................................................................................. 6
 Covariates .......................................................................................................................................................... 6
 Proportional hazard model ........................................................................................................................ 6
 Survival Curves ................................................................................................................................................ 8
 Survival Rate Projections to the Observer Data Set ............................................................................. 9
 Focus on Oceanic Whitetip Mortality Mitigation ................................................................................ 10
 Individual Post-interaction Survival ................................................................................................... 10
 Hindcast Survival of Observed Interactions .................................................................................... 11
Results ........................................................................................................................................................................ 11
 Fishery Characteristics, Observer Data Collections, and Tagging ............................................... 11
 Survival Analysis ............................................................................................................................................... 14
 Proportional hazard model fit................................................................................................................ 14
 Survival Curves ............................................................................................................................................. 14
 Expected Survival Projections .................................................................................................................... 15
 ESA Listed Oceanic Whitetip Shark Mortality Mitigation ............................................................... 16
 Individual Post-interaction Survival ................................................................................................... 16
 Hindcast Survival of All Observed Interactions.............................................................................. 16
Discussion ................................................................................................................................................................. 17
 Species specific survival rates..................................................................................................................... 18
 Silky shark....................................................................................................................................................... 18
 Blue shark ....................................................................................................................................................... 19
 Bigeye thresher shark ................................................................................................................................ 20
 Shortfin mako shark...................................................................................................................................... 21
 Oceanic whitetip shark .............................................................................................................................. 22
 Fishery and handling method effects on survival .............................................................................. 22
 Delayed Mortality ............................................................................................................................................. 25
Conclusions, Recommendations, and Next Steps .................................................................................... 28

 ii
Acknowledgements .............................................................................................................................................. 29
References ................................................................................................................................................................ 30
Tables and Figures ................................................................................................................................................ 35
Appendix ................................................................................................................................................................... 47
Supplementary Material ..................................................................................................................................... 55

 iii
Quantitative estimates of post-release survival rates of sharks captured in
Pacific tuna longline fisheries reveal handling and discard practices that
improve survivorship

Abstract

Shark catch rates are higher in pelagic longline fisheries than in any other fishery, and sharks are
typically discarded (bycatch) at sea. The post-release fate of discarded sharks is largely
unobserved and could pose a significant source of unquantified mortality that may change stock
assessment outcomes and prevent sound conservation and management advice. This study
assessed post-release mortality rates of blue (Prionace glauca), bigeye thresher (Alopias
superciliosus), oceanic whitetip (Carcharhinus longimanus), silky (C. falciformis) and shortfin
mako (Isurus oxyrhincus) sharks discarded in the Hawaii deep-set and American Samoa longline
fisheries targeting tuna in the central Pacific Ocean. The impacts on survival rates were
examined considering species, fishery, fishing gear configuration, handling method, animal
condition at capture and at release, and the amount of trailing fishing gear remaining on
discarded sharks. Bayesian survival analysis showed that the condition at release (good vs.
injured), branchline leader material, and the amount of trailing fishing gear left on the animals
were among the factors that had the largest effect on post-release fate—animals captured on
monofilament branchline leaders and released in good condition without trailing fishing gear had
the highest rates of survival. This study shows that fisher behavior can have a significant impact
on pelagic shark post-release mortality. Ensuring that sharks are handled carefully and released
with minimal amounts of trailing fishing gear may reduce fishing mortality on shark populations.

Key words:
Bycatch, mortality, shortfin mako, bigeye thresher, silky, blue, oceanic whitetip, best
handling practice

 iv
List of Acronyms

ASLL – American Samoa
ASOP – American Samoa Observer Program
BSH – Blue shark
BTH – Bigeye thresher shark
CITES – Convention on International Trade in Endangered Species
CMM – Conservation and management measures
CPUE – Catch per unit effort
FAL – Silky shark
HIDS – Hawaii deep-set fishery
HISS – Hawaii shallow-set fishery
MSA – Magnuson-Stevens Fishery Conservation and Management Act
NMFS – National Marine Fisheries Service
OCS – Oceanic whitetip shark
PAT – Pop-off archival tag
PIROP – Pacific Islands Region Observer Program
RFMO – Regional Fisheries Management Organization
SMA – Shortfin mako shark
SPAT – Survivorship pop-off archival tag
WCPFC – Western and Central Pacific Fisheries Commission
WCPO – Western Central Pacific Ocean
WPFMC – Western Pacific Fisheries Management Council

 v
Introduction

 It is estimated that two-thirds of global elasmobranch species are threatened with
extinction, with overfishing identified as a major contributor (Worm et al. 2013). Shark catch
rates are higher in pelagic longline fisheries than in any other fishery, and sharks are typically
unwanted and discarded at sea (Oliver et al. 2015). Identifying strategies that reduce commercial
fishing impacts on discarded (bycatch) shark populations is a critical fisheries science and
conservation need. Our research focuses on identifying best practices to reduce mortality using
data collected from the Hawaii deep-set (HIDS) and American Samoa (ASLL) longline fisheries
that target bigeye tuna (Thunnus obesus) and albacore (Thunnus alalunga), respectively. Both the
HIDS and ASLL fisheries interact with several shark species, most of which are of low
commercial value and are discarded at sea. In these fisheries, the highest shark catch rates consist
of the following (in descending order): blue sharks (Prionace glauca), thresher (Alopias spp.),
mako (Isurus spp.), oceanic whitetip (Carcharhinus longimanus), and silky sharks (C.
falciformis) (Walsh et al. 2009). A study of catch per unit effort (CPUE) trends in the Hawaii
based longline fishery found significant declines in the relative abundance of oceanic whitetips
and silky sharks since 1995 (Walsh and Clarke 2011, Brodziak and Walsh 2013). In the Pacific
Ocean, stock assessments have been formally conducted for the western and central Pacific
Ocean populations of oceanic whitetip and silky sharks, the North Pacific population of blue
shark and shortfin mako sharks, and a sustainability risk assessment for the bigeye thresher (A.
superciliosus). All of these assessments have called for research on post-release survival rates to
improve mortality estimates.
 Based on concerns about population declines from overfishing, several regional fisheries
management organizations (RFMOs) have responded with a series of conservation and
management measures (CMMs) for sharks. Within the Western and Central Pacific Fisheries
Commission (WCPFC) convention area, measures have been adopted to enhance bycatch
mitigation including Safe Release Guidelines to maximize the survival of sharks that are caught
and are not to be retained (CMM 2019-04). Additionally, CMM 2019-04 requires all vessels
flying the flags of cooperating members and non-members to the WCPFC ‘to release any oceanic
whitetip shark or silky shark that is caught as soon as possible after the shark is brought
alongside the vessel, and to do so in a manner that results in as little harm to the shark as

 1
possible’, following any applicable safe release guidelines for these species. Additional
international protections for oceanic whitetip, silky and the thresher shark species complex
include listing in Appendix II of the Convention on International Trade in Endangered Species
(CITES) which provides the legal framework to regulate trade and or introduction from the sea.
In the United States, the oceanic whitetip shark was listed as threatened globally under the
Endangered Species Act in 2018, requiring the US National Marine Fisheries Service (NMFS) to
elucidate the steps necessary to restore the species to ecological health.
 Measures banning retention are a step in the right direction but may not have the intended
consequence of reducing mortality (Tolotti et al. 2015). According to a general consensus among
shark and fishery scientists, three main factors have the largest impact on shark bycatch mortality
rates in longline fisheries: 1) the underlying physiological sensitivity to stress, where impacts are
species specific; 2) the amount of time an animal spends on the fishing line; and 3) the handling
methods used to release/remove sharks from fishing gear. Many studies have identified which
species are most sensitive to capture stress through physiological investigations and by
quantifying at-vessel mortality rates (e.g., Beerkircher et al. 2002; Marshall et al. 2012). Yet the
physiological and/or physical damage resulting from an interaction with fishing gear or handling
procedures used to release sharks often results in undocumented and or delayed mortality
(Campana et al. 2009). Effective fisheries management requires knowledge of the direct effects
of fishing mortality on species that are retained and discarded. There is an urgent need to
estimate levels of delayed mortality, account for these levels in stock assessments, and adopt
measures to mitigate sources of mortality, such as identifying best handling and release practices
(Gilman et al. 2013).
 In the last few years, several studies have begun to focus on elucidating post-release
mortality rates through satellite linked electronic tag technologies to ascertain total fishing
mortality rates for shark bycatch species. Total mortality is the combination of mortality that is
observed at the vessel and the more cryptic mortality that may occur post-release for species that
are discarded at sea (Musyl and Gilman 2018; Campana et al. 2016). Until very recently the
magnitude of post-release fishing mortality in shark bycatch species has been largely unknown
where post-release mortalities of blue sharks released “alive” from longline fishing gear were
found to range from 17% to 19% (Campana et al. 2016; Musyl and Gilman 2018). Similar
studies have been conducted for mako and silky sharks around the Pacific Ocean (Francis et al.

 2
2019; Musyl and Gilman 2018; Schaeffer et al. 2019, Schaefer et al. 2021) in various longline
fisheries with results that show survival rates differ across fishing fleets, target species, fishing
gear configurations and handling methods. Highlighting the need for post-release survival studies
across ocean basins and fisheries.
 In this study, post-release survival rates are quantified through the use of pop-off archival
tags (PATs) for five of the WCPFC “key species” and the Western Central Pacific Fisheries
Management Council’s (WPFMC) pelagic management unit shark species. These include blue
(BSH), bigeye thresher (BTH), oceanic whitetip (OCS), shortfin mako (SMA) and silky (FAL)
sharks that are incidentally captured in the HIDS and ASLL tuna target longline fisheries. We
also investigate the effects that standard handling and discard practices may have on post-release
fate with the goal of identifying best handling practices for fishers to improve survivorship of
discarded species. We also expand survival estimates from tagged sharks across all observed
shark interactions using data collected by fishery observers to generate a suite of survival rates
across different scenarios that encompass catch condition, release method and the effect of gear
configuration for integration into stock assessments.

Methods

Fishing and Tagging

 Pacific Islands Regional Observer Program (PIROP) and American Samoa Observer
Program (ASOP) fisheries observers were trained to collect additional details on shark condition,
fisher handling and release methods, and in tagging during commercial longline fishing trips on
Hawaii deep-set (HIDS, bigeye tuna target) and American Samoa (ASLL, albacore target)
permitted vessels. Shark condition and handling data were collected during Hawaii shallow-set
(HISS, swordfish target) permitted trips, to a lesser extent, and no sharks were tagged during
these trips. Gear configurations (e.g., hook sizes, hooks set, branchline lengths and materials)
and fishing method details (e.g., set and haul timing) vary across these fishing sectors and these
details are also collected by both observer programs. All trips departed from the ports of San
Diego, California; Honolulu, Hawaii; and Pago Pago, American Samoa.

 3
Data collected by fisheries observers during shark interactions were used to assess factors
that influence post-release survival rates of sharks discarded in HIDS and ASLL longline
fisheries and to identify the handling and release methods that enhance survivorship. While there
is a spectrum of vitality for sharks at haul back of the gear, PIROP and ASOP observers are only
required to record whether an animal is alive or dead at haul back and a release disposition of
alive, dead, or kept. Additional condition indices were created for observers that participated in
this study to more accurately reflect how capture condition may impact post-release fate.
Handling and injury codes were also developed and tested to ascertain how sharks were removed
from the fishing gear and to provide details on any injuries that the animal may have incurred
during the process. This was an iterative process. The data codes were created with definitions,
and observers were deployed with video cameras to assess whether or not they interpreted the
definitions accurately. This process began during the summer of 2015, and final definitions
(Table 1) were adopted and implemented in December 2016 prior to the onset of tagging
activities.
 To quantify post-release survival rates of blue (BSH), bigeye thresher (BTH), oceanic
whitetip (OCS), shortfin mako (SMA) and silky (FAL) sharks captured in the HIDS and ASLL,
PIROP and ASOP observers were trained to tag sharks captured and released during normal
fishing operations. Tags were placed on sharks over the rail of the vessel while the shark was still
in the water, using extendable tagging poles. Vessel crew then removed the shark from the
fishing gear via whichever release methods they typically employed. Observers recorded
additional metrics about the tagging event (date, time, latitude and longitude, and sea surface
temperature), the captured shark (species, condition at capture and release, sex, and approximate
length) and the handling methods employed to release the sharks (composition and quantity of
trailing gear attached to the shark at release, any damage to the shark from gear removal, if and
how the shark was landed, and time out of the water). Observers also recorded video of the
tagging events using a GoPro mounted to a head strap worn while tagging for scientific review
and validation of data recorded for each shark interaction by project staff. The videos were also
used to determine whether or not the tagging event (tag placement location, number of attempts
to tag, and total time to tag and release) may have had an impact on survival.
 This study used two different satellite linked pop-off archival tags (PAT), survivorship
PATs (SPAT) and miniPATs (Wildlife Computers, Inc., Redmond, WA). The first model of the

 4
SPAT was programmed for 30-day deployment periods while later models (from 2017 onwards)
were programmed to 60 days. SPATs archived and then transmitted binned light, temperature,
and depth data to the tag manufacturer. The tag manufacturer analyzed these data to interpret
whether the animal died (“Sinker”—tag sank to a depth beyond 1400 m or it sank and sat at a
constant depth (shallower than 1400 m for > 3 days); the animal survived (“Completed
Deployment”—tag remained on the animal to the end of the programmed deployment period of
30 or 60 days); or if the tag came off prematurely due to an attachment failure (“Floater”—tag
floated to the water’s surface after detaching from shark). The fate of the tag (“Sinker,”
“Completed Deployment,” or “Floater”), the daily minimum and maximum depth and
temperature, and the tag’s release (“pop-off”) location were then communicated from the
manufacturer to us, as the tag owner.
 The project was expanded to assess the long-term effects of trailing gear on survivorship
after the initial phases of data collection revealed that most sharks were released by cutting the
branchline with varying amounts of trailing gear attached to the animal (Table 2). Long-term
survivorship was assessed with miniPAT tags placed on blue sharks incidentally captured in the
HIDS fishery (n=25) and oceanic whitetip sharks captured in both the HIDS (n=6) and the ASLL
fisheries (n=8). Of the 25 long-term miniPATs placed on BSH, 13 tags were deployed on trips
where the vessel was using branchlines with monofilament leaders, while the remaining BSH
(n=12) were tagged and released with trailing gear composed of branchlines with wire leaders.
All 6 of the long-term miniPATs placed on OCS in the HIDS were on trips where the vessel was
using branchlines with wire leaders, whereas all 8 miniPATs placed on OCS in the ASLL fishery
were on trips with branchlines completely composed of monofilament. The long-term miniPATs
used in this study archived light, temperature, and depth time series data, with sampling intervals
of 10 minutes and deployment periods programmed for 180 days (n=2) or 360 days (n=37). Only
sharks that were alive and in good condition (AG) at haul back were tagged with miniPATs and
were released by cutting the line. Fishery participation in this study was voluntary. Observers
were only asked to tag a small number of sharks (2–3) per trip to ensure that vessels did not bear
a large burden for participating in the project and to avoid observer or trip-specific data biases.
This research was conducted in accordance with the institutional animal care and use guidelines
at the University of Hawaii.

 5
Survival Analysis

Covariates

 Factors associated with the fishery interaction were used to generate covariates for the
survival analysis. A dummy variable (0, 1) was included for whether the fishery interaction
occurred in the HIDS or ASLL fishery and for each tagged shark’s post-release fate of dead or
alive. The approximate length of the individual and the amount of trailing gear in meters were
included as continuous variables and the mean per species was assumed when data were missing.
Covariates were also included in the analysis for the shark condition at capture and release and
the handling and discard practices. The data recorded by the scientific reviewer superseded that
recorded by the fishery observer when discrepancies occurred, and if the reviewer was unable to
ascertain a particular condition from the video or notes, the data recorded by the observer was
used in the analyses. Additional covariates were used for the type of branchline leader material
(wire or monofilament) and for the location the animal was hooked in the body. Hooking
location only applied to BTH, which are often hooked in the tail or in the mouth because of their
feeding strategies.

Proportional hazard model
 A proportional hazard model was implemented in a Bayesian framework in order to
explicitly model the baseline hazard, ℎ0 , and not rely on a pseudo-likelihood as in the frequentist
framework. We assumed that the survival function was equal to the probability of the survival
time, , being greater than a given time, (Equation 1):

 ( > ) = ( ) = − ( ) Equation 1
where ( ) is the survival function and ( ) is the cumulative hazard (Equation 2) equal to
integrating the hazard rate, ℎ( ), from time zero to time .

 Equation 2

 Equation 3
where ℎ0 ( ) is assumed to be equivalent to the baseline hazard, ℎ0 , is a vector of hazard
covariates describing the individual’s fishery interaction and is a vector of hazard covariate

 6
effects. Equation 3 can be reparameterized to follow a more traditional linear model formulation
(Equation 4):
 Equation 4
where is equivalent to the baseline hazard. The baseline hazard (i.e. the comparison to which
all hazard covariate effects, , are compared) was assumed to vary by shark species and tag
deployment period. The survival time, , can be explicitly written as being distributed following
an exponential model with rate, ℎ( ), conditioned on the observed survival (right-censorship in
survival analysis parlance), , where = 1 if the individual survived (Table 4) (Equation 5):

 Equation 5

 Covariate effects, , were assumed to have normal priors with mean zero and a standard
deviation of 2. The baseline hazard rate was assumed to have a normal prior with a standard
deviation of 2 and varying means equal to – log( ), where equals the mean survival time by
species and tag deployment period. All priors were specified using weakly informative priors,
such that minor structural information is provided and the inference is weakly regularized
(Gelman et al. 2017). The Bayesian hierarchical proportional hazard model was implemented in
rstan (STAN Development Team 2020) using 5,000 iterations for burn-in (discarded), and 2,500
iterations from 4 chains using the No U-Turn variant of the Hamiltonian sampling algorithm with
default parameters. Convergence was assessed visually and using the Gelman-Rubin
convergence statistic, R̂ (less than 1.1 when chains converged) (Gelman et al. 2013).
 We also completed a posterior predictive check by estimating predicted survival times of
the dead (uncensored) individuals, T̂, and comparing these predicted survival times to observed
survival times (Rubin 1984). As the uncensored survival times are bounded by tag deployment
period (30, 60, 180 or 360 days in this study), we utilized an exponential draw with an upper
bound limit for these individuals (Equations 6–8) and an unbounded draw for censored
individuals (Equation 5):

 Equation 6

 ~Uniform(0, ) Equation 7

 7
Equation 8

where is equal to cumulative distribution function of the exponential distribution evaluated at
the upper bound, , and is a draw from a uniform distribution between 0 and . Two versions
of the model goodness of fit, 2 , was assessed using Equations 9–11.

 Equation 9

 Equation 10

 Equation 11

where is the predicted sum of squares, is the total sum of squares, is the median
predicted survival time, and is the mean of the observed survival times, . The first version of
the model goodness of fit, 02 only used values for uncensored individuals. The second version
used all the values but assumed that the model adequately predicted the individual to survive
past the tag deployment period if > . To do such, values satisfying the condition >
were set equal to . The significance of each fishery interaction covariate was assessed by taking
the average of posterior parameter samples less than zero (Equation 12) and evaluating if this

value was less than or greater than 1 − , where = 0.1.
 2 2

 ∑( < 0) Equation 12
 ( ) =

where is the number of posterior samples.

Survival Curves

 Survival curves were estimated from the posterior samples of the hazard model effects
over a sequence of potential survival times from 1 day to the maximum observed survival time
(360 days) with a daily step. For each survival curve, the median and the 90% credible interval
were calculated from the posterior samples. Species-specific survival curves were estimated at
the mean conditions across all tagged individuals by species and by fishery (only relevant for
OCS) and the mean baseline hazard rate for the species (e.g., the mean of ℎ0 varying by tag
deployment period). Survival curves were also estimated to explore the marginal effects of
specific conditions and, for these estimates, all other effects were multiplied by the proportion of
conditions observed in the tagged individuals. A comparison was made of the survival curves

 8
between each of the following: 1) caught conditions (Alive, Alive Good, Alive Lethargic, and
Alive Injured); 2) between hooking location (BTH only) and between using wire leader or mono
leaders, 3) between each of the handling methods involving direct contact with the shark or the
hook in its mouth (Gear Removed, Jaw Damaged, Dehooking, and Part Removal), and 4)
between each of the handling methods involving only the line attached to the shark (Line Cut,
Drag Line, and Escaped. See Table 1 for descriptions). For the tail hooking comparison, the
mean interaction conditions across BTH were used rather than the mean across all species.
Lastly, the effect of increasing length of trailing gear was explored by determining the 25th
percentiles of the observed length of trailing gear and estimating survival curves for each length.
These comparisons were also summarized by extracting the survival rate at the unique
programmed tag deployment periods.

Survival Rate Projections to the Observer Data Set

 Using the hazard model’s parameter estimates, we projected the expected survival of
BSH, OCS, SMA, FAL, and BTH in the HIDS and ASLL fisheries across the observer data set.
We used the PIROP and ASOP data sets for the HIDS and the ASLL fisheries collated between
January 3, 2005 and December 4, 2019. For all of the observed fishing sets, a shark’s individual
length was assigned from the approximate length (estimated) and the total length (measured)
values recorded by the observers. A small subset of the total observed longline sets recorded the
same covariates used in the hazard model and were used directly in the projection estimation.
Only the handling codes used in the hazard model were used in the projection estimation. For the
rest of the observed fishing sets without the survival covariates or missing part of the necessary
covariate set, the mean condition(s) for each species by each caught condition was used. Survival
estimates were projected to 1, 30, 60, 180, and 360 days post-release. The proportion of
individuals that were caught and assessed as dead at the vessel was tallied by species, and results
were reported both with and without these dead individuals. The mean intercept by species was
used in lieu of using the tag-specific intercepts. In addition, for the HIDS fishery a wire leader
effect was included.

 9
Focus on Oceanic Whitetip Mortality Mitigation

 OCS are federally listed as threatened under the US ESA, and as such, steps are required
by action agencies to reduce mortality for this species in the fisheries they manage. This analysis
details the expected survival of OCS following interactions with the HIDS fishery based on the
survival of tagged animals and tabulated to reflect management options that include changes to
gear configurations. One option under consideration by the fishing industry is converting from
wire leader materials (currently in use) to monofilament leader materials, as well as reducing the
trailing gear left on each animal. In this analysis we explored how potential changes in gear and
handling may impact mortality rates through two examinations: 1) the change in the individual
post-release survival under a range of interaction conditions, and 2) the proportion of historic
OCS interactions with the HIDS fishery observed by the PIROP that would have survived given
a set of interaction conditions.

Individual Post-interaction Survival

 The individual post-interaction survival analysis was conducted using a Bayesian hazard
model. Other than the branchline leader material and trailing gear effects in the model, all other
interaction conditions were held at the mean across tagged sharks. All species were included in
this analysis with species-specific effects included in the baseline hazard rate, the expected
survival at the baseline, and for each tag deployment duration. The species-specific survival was
estimated, as the average over the tag deployment duration. For OCS, three effects for each tag
deployment duration were included in the whole model. The baseline for OCS for each particular
tag deployment duration was capture in the HIDS on monofilament leaders. While this leader
material was not in regular use in the HIDS during the study period, a subset of BSH were
tagged in this fishery on a vessel using monofilament leaders, thus using this as a baseline
allowed the model to achieve some separation between the fishery and leader material effects.
All other effects in the model: caught condition (Alive, Good, Injured, Lethargic), handling
condition (Line Cut, Gear Removed, Drag Line, Jaw Damaged, Escaped, Dehooking, Part
Removed), hooked condition (tail hooked, leader material), amount of trailing gear left on the
animal, fishery (HIDS or ASLL), and the individual animal’s length were informed by all species
due to the data constraints.

 10
Hindcast Survival of Observed Interactions

 Two sets of prospective hindcast configurations were considered for observed OCS
interactions in the HIDS fishery. The interaction conditions examined in this hindcast were 1)
using monofilament branchline leader material instead of a wire leader, and 2) the effects of the
remaining trailing gear of either the observed trailing gear length or no trailing gear remaining on
the animal at release. For this analysis, the observed interaction conditions were used unless the
specific condition was missing, in these cases, the mean condition across all species was used.
The observed conditions were missing 62% of the shark length data 99% of the trailing gear data
from all shark interactions recorded in the observer data set. The proportion of observed oceanic
whitetip shark interactions that would have survived post-interaction given the prospective
interactions were tabulated.

Results
Fishery Characteristics, Observer Data Collections, and Tagging

 Observers collected shark condition and handling data on 19,572 elasmobranchs
incidentally captured during 128 fishing trips on 76 different vessels that occurred between
January 2016 and June 2019. During 84 of these trips (ASLL, n = 14; HIDS, n = 70), 224 sharks
were tagged by observers and fishers. Tagging was not conducted on Hawaii shallow-set (HISS)
trips targeting swordfish. The handling and damage data recorded by trained observers indicated
that most of the five species of sharks considered in this study (BSH, BTH, FAL, OCS, SMA n =
16,527 animals) were released by cutting the line (LC =81.1%). Followed by gear removal with
jaw damage (JD = 11.5%), gear removal with no damage to the shark (GR = 3%), gear removal
with removal of part of the shark (e.g., lobe of tail on tail-hooked BTH, PR = 0.3%). A small
proportion of these sharks escaped the gear on their own (ES = 3%). Other handling methods that
were observed included the use of a dehooker (DH =
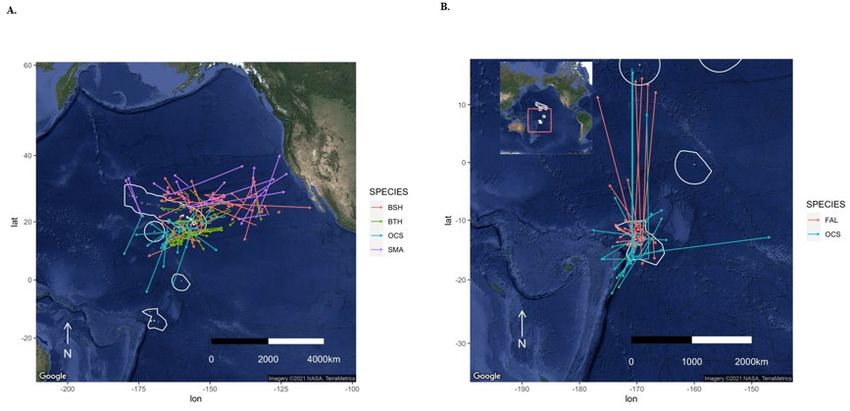
sizes are also a bit smaller than those used in the HIDS and HISS fisheries. The HIDS has a
seabird bycatch mitigation measure requiring a weight of at least 45 g be within 1.0 m
of the hook. Many fishers choose to use wire leaders between the hook and the weight to
increase crew safety and reduce the risk of weights flying back at the vessel if the leader breaks
while under tension. The HISS sector does not have a line-weighting requirement but there is a
requirement to set at night to reduce seabird interactions. Many vessels still use weights but the
leader and branchlines are composed of all monofilament. The length and composition of the
trailing gear recorded by observers varied by fishery (Figure 1A) and by species (Figure 1B,
Table 2). The HIDS fishery left the greatest amount of trailing gear on sharks, where sharks were
released with an average of 8.75 m of trailing gear (Figure 1B). This typically includes a
stainless-steel circle hook, 0.5 m of braided stainless steel wire leader, a 45-g weighted swivel,
and monofilament branchline ranging in length from 0 to 30.0 m. Whereas sharks released by
cutting the line in the ASLL had an average of 2.98 m of trailing gear which is composed of a
stainless-steel circle hook to an all monofilament line ranging in length from 0 to 10.0 m. In the
HISS fishery sharks were released with an average of 7.74 m of trailing gear, composed of an
18/0 stainless steel circle hook, with a range of 1–18.0 m of all monofilament line and weighted
swivels (Figure 1A). Some species were released with more trailing gear than others (Figure 1B,
Table 2). This was primarily due to how quickly the fishers were able to ascertain that the catch
was a shark and not a target species. The behavior of some species often predicts where the line
will be cut; for example, blue sharks tend to surface far away from the vessel and are easy to
identify so the line was often cut farther away from the vessel than for some other species.
Observers were also asked to record hooking location for thresher sharks. Thresher sharks use
their elongated tail to stun prey and are often hooked in the tail. When a thresher shark is tail
hooked, it is brought to the vessel backwards and more often (67%) than not (33%), the tip of the
tail is removed so that the fishers can get their hooks back (Part Removal; Supplementary
Material Table S1).
 A total of 224 sharks captured incidentally in the ASLL and HIDS were tagged by
fisheries observers (Table 4). ASLL observers tagged a total of 57 sharks: 30 FAL and 19 OCS
with SPATs and 8 OCS with miniPATs programmed for a 360-day deployment period. In the
HIDS fishery, observers tagged a total of 167 sharks: 44 BSH, 43 BTH, 29 OCS, and 20 SMA
with SPATs and 25 BSH with miniPATs (two programmed for 180-day and 23 with 360-day

 12
deployment periods); and 6 OCS with miniPATs programmed for 360-day deployment periods.
Six sharks tagged with SPATs were removed from the survival analyses because the effect of the
tagging event on post-release fate could not be ruled out after video review (Table 4; Removed).
In addition, several tags failed to report any data (Table 4; Non-reporters, n=14) and were also
discarded from further analysis.
 BSH had the lowest post-release survival rates (62%) of the 5 species tagged in this
study. BSH tags also revealed delayed mortalities recorded out to 307 days post-release. Several
of the BSH tags were ingested post-release (n = 6, on days 6, 9, 26, 30, 148 and 307 post-
release). The ingestions were also considered mortalities and contributed to the overall mortality
estimate. Of the BSH mortalities that were not ingestions, 53% occurred within 1 day of release
and 76.5% were within 13 days of release. OCS was the only other species tagged with long-
term tags programmed out to 360 days yet most (90%) of the mortalities occurred within 4 days
of release. Only one delayed mortality occurred for OCS at 22 days post-release. Interestingly,
none of the OCS tags were ingested. One of the OCS tagged with a miniPAT was recaptured by
a Tongan longline vessel 197 days after tagging. This animal was recorded as dead at capture by
the longliner and the tag was recovered and returned to us. BTH were only tagged with SPATs
programmed for 30- and 60-day deployment periods and had the second lowest post-release
survival rate of 82%. All of the BTH mortalities occurred between 0 to 3 days post-release with
the exception of one tag that was ingested on day 24. FAL were only tagged with 30 day SPATs
and had the highest post-release survival rate out to this period of 97%. The only mortality for
this species occurred within 6 days post-release. SMA were tagged with SPATs programmed for
both 30- and 60-day deployment periods revealing a relatively high post- release survival rate
(94%). This species had the lowest sample size in this study because tagging of SMA
commenced only recently and tagging is ongoing. To date, only 1 mortality occurred
immediately after release as the animal had swallowed the hook and was injured. Tag
deployment and release (pop-off) locations are illustrated in Figures 2A (HIDS) and 2B (ASLL).

 13
Survival Analysis

Proportional hazard model fit

 The proportional hazard model converged with all chains visually mixing (Figure S1) and
the Gelman-Rubin statistic was less than 1.1 for all parameters. The posterior predictive check
indicated that the model predicted higher survival times than observed for individuals dying
within a few days of the fishing interaction and lower than observed for individuals surviving
longer than 50 days (Figure 3). For a few BSH individuals in the former group, was between
84 and 122 days and far higher than the observed . The model goodness of fit for the
uncensored individuals, 02 , was 0.23, while the model goodness of fit overall was 0.86. The
latter resulted from 96% of the censored individuals having the condition > .
 The median log-transformed baseline hazard rates, , varied from -7.1 to -2.0, resulting in
baseline survival times of 10 days to 1,318 days (Figure 4A). In general, 30-day tags had lower
values than the 60-day tags (resulting in higher hazard rates in 60-day tags) but higher values
than 180- or 360-day tags. Among the 5 species, BSH had the highest hazard rate (0.076),
followed by OCS (0.033), BTH (0.020), SMA (0.017), and FAL (0.012). The fishery interaction
covariates, , had wide credible intervals generally and only the individual’s length and tail
hooking (BTH only) were significantly different from zero (Figure 4B). The covariates with
median hazard ratios that increased the hazard were the Injured caught condition, Jaw Damaged
handling condition, Part Removal handling condition, trailing gear length, tail hooking, wire
leader material, and ASLL fishery interaction. All other covariates reduced the hazard (Figure
4C).

Survival Curves

 Between the species caught in the HIDS fishery, BSH had the lowest survival rate,
followed by BTH, OCS, and SMA at their mean interaction conditions (Figure 5A). For the
species caught in the ASLL fishery, OCS had a lower survival rate than FAL at their mean
interaction conditions (Figure 5A). The only species tagged in both fisheries, OCS, had lower
survival in the ASLL fishery than the HIDS fishery (Figure 5A); this result is not unexpected
given the positive effect size (hazard ratio > 1) of the ASLL fishery (Figure 4B). Between caught
conditions, sharks caught in Good condition had the highest survival rates, followed by the Alive

 14
condition, Lethargic, and then the Injured condition (Figure 5B). Using wire leader material
lowered the survival rate (Figure 5C), as well as, tail hooking (BTH; Figure 5C) lowered the
species-specific survival rate relative to mean conditions (Figure 5A). For handling methods
involving direct contact with the shark or the hook, damaging the jaw (Jaw Damaged) had the
lowest survival rate, then removing parts (Part Removal), then removing the gear (Gear
Removed), then dehooking (Figure 5D). Between handling methods involving the line, sharks
escaping the gear (Escaped) had the highest survival rate, followed by cutting the line (Line Cut),
and then dragging behind the boat (Drag Line) (Figure 5E). Although the median survival rates
for Line Cut and Drag Line are similar, the 90% credible interval of the Drag Line condition
encompasses far lower survival rates than those within the 90% credible interval for the Line
Cut. Increasing the amount of gear on the shark negatively affected the survival rate with the best
survival occurring with no gear or only up to a meter of gear left on the shark at release (Figure
5F). These results are also summarized at 1, 30, 60, 180, and 360 days post-interaction in the
Appendix, for all species (Table A1) and for each individual species; BSH (Table A2), BTH
(Table A3), SMA (Table A4), FAL (Table A5) and OCS (Table A6).

Expected Survival Projections

 Of the 5 shark species considered here, BSH were most frequently caught, followed by
BTH, SMA, FAL, and OCS in the observed sets of the HIDS and the ASLL fisheries between
January 3, 2005 and December 4, 2019 (Table 5). It should be noted that both fisheries have, on
average, approximately 20% observer coverage, and thus, the shark interactions used in this
analysis do not account for the total fishery interactions. Between 2017 and 2019, observer
coverage on ASLL trips ranged from 15.7% to 20% and was consistently around 20.4% in HIDS
over the same period. The majority of individuals were alive when captured in both fisheries, and
close to 20% across species were assigned a Dead caught condition in the HIDS with the
exception of BSH where at vessel mortality is much lower. It is noteworthy that the proportion of
sharks that were caught Dead in the ASLL fishery was much higher for SMA (44.4%), FAL
(35.8%) and OCS (35.8%) (Table 5). Of the 5 species, BSH had the lowest proportion of dead
animals at capture in both fisheries (Table 5). The observer data set was missing data for several
of the influential survival covariates; only one third of all shark interactions contained animal
length data, about 1% had data on trailing gear lengths, and between 2% to 5% had fisher

 15
handling methods with the vast majority recorded as No Damage (the default designation for the
observer program outside of this study focusing on shark interactions) (Table 6).
 Projections of expected survival to the observed data set revealed BTH to have the lowest
initial survival for sharks that were assigned as 1 of the 3 Alive caught conditions (Table 7). Not
surprisingly, this species also had the lowest estimated survival 360 days later followed by OCS
caught in the American Samoa fishery. SMA, had the highest survival across all projected time
points. When including the sharks that also were assigned a Dead caught condition, FAL had the
lowest initial survival but BTH had the lowest long-term survival (Table 7). The most numerous
species caught, BSH, had extremely high initial survival for those caught alive and only a 5%
reduction in the median when factoring in those that were dead at capture (Table 7).

ESA Listed Oceanic Whitetip Shark Mortality Mitigation

Individual Post-interaction Survival

 Two prospective gear configurations considered for individual OCS interactions with the
HIDS fishery were 1) wire or monofilament leaders on branchlines, and 2) different trailing gear
lengths (0, 1.8, 3, 5.15, 10, 14 m) for sharks at release. The latter represents the 20th percentiles
of trailing gear lengths observed remaining on sharks at release during tag deployments on OCS
in this study. These two prospective post-interaction conditions were crossed so that trailing gear
at various lengths with wire or monofilament leaders was evaluated (Table 8). The model
revealed that over a 360-day time duration, switching from wire leader material to monofilament
has a small improvement in survival rates while trailing gear length has a much larger impact on
survivorship.

Hindcast Survival of All Observed Interactions

 A total of 4,322 OCS interactions with the HIDS fishery were observed by the PIROP
between 2005 and 2019 (3,392 alive and 930 dead at haul back). In this comparison of leader
material and trailing gear effects on survival for OCS that were alive at the vessel and for all
sharks captured (Alive and Dead) the tabulations also show that leader material has a small effect
on survival where sharks captured and released with monofilament gear have a higher survival

 16
rate over time (Table 9). The effect of trailing gear on survival is greater than leader material,
where OCS survival rates are higher when it is minimized for both leader materials.

Discussion

 Longline fisheries have the largest impact on pelagic shark populations due to the scale
and magnitude of global fishing effort, such that finding strategies that can increase post-release
survival is paramount. This study used satellite linked PATs to generate quantitative estimates of
post-release survival rates for 5 of the most frequently captured and discarded shark species,
BSH, BTH, OCS, SMA and FAL sharks, in 2 tuna target longline fisheries in the Pacific Ocean.
By working directly with observer programs and fishers to record detailed information about
each interaction, our modeling approach was able to estimate realistic, scenario-based survival
rates to predict post-release survivorship for inclusion in stock assessments and population
projections. This study also elucidates the handling and discard methods that improve survival
probabilities post release.

 For fisheries where no-retention measures have been implemented to reduce mortality, it
is important that post-release fate is well understood to assess the efficacy of the measures. In the
WCPFC, no-retention measures have been adopted for both OCS and FAL. In the eastern half of
the Pacific Ocean the Inter-American Tropical Tuna Commission has also adopted a no retention
resolution for OCS [C-11-10] and has enacted longline fishing restrictions for FAL in nursery
areas and established FAL catch limits for some fleets [Resolution C-19-05]. In the Atlantic
Ocean the International Convention for the Conservation of Atlantic Tuna adopted no-retention
measures for; BTH [BYC-09-07], FAL [BYC-11-8], OCS [BYC-10-07] and SMA [BYC-19-06
(with caveats)]. In the Indian Ocean, the Indian Ocean Tuna Commission enacted no retention
measures for Alopias spp. [Resolution 12/09] and for OCS [Resolution 13/06]. All of the
measures outlined above call for fishers to release sharks in manner that minimizes harm but do
not outline exactly how to minimize harm during the fishing interaction. The data generated in
this study will help RFMOs address issues surrounding conservation and management measures
by providing quantitative estimates of post-release survival for 5 of their key shark bycatch
species, as well as data derived recommendations for improving handling and discard practices
and details on the effects of leader material on survival.

 17
Species specific survival rates

 Some species are physiologically more sensitive to capture related stress, and at-vessel
mortality rates tend to reflect which species are more resilient than others (e.g., Marshall et al
2012; Mandelman and Skomal 2009). In this study we assessed survival in pelagic species that
occupy a range of ecological niches, vertical depth distributions, aerobic capacities and span the
spectrum of differential sensitivities for highly mobile obligate ram ventilators. Here at-vessel
mortality ranged from 4% in BSH to 29.2% for FAL when data from both fisheries was
combined. FAL, BTH, OCS and SMA all had very similar at-vessel mortality rates of 20.6%–
23.2% in the HIDS fishery but these rates increased dramatically in the ASLL.

Silky shark

 Silky sharks had the highest at-vessel mortality rate (29.2%) and also the highest post-
release survival rate (97%) compared to all other species examined in this study. FAL were only
tagged in the ASLL fishery and only if they were in good condition at the vessel. In addition,
these sharks were consistently released with short lengths of trailing gear. Capture condition has
been shown to be the most influential factor on post-release survival probabilities in this and in
other studies (e.g., Musyl and Gilman, 2018, Hutchinson et al. 2015, Francis et al. 2019). Thus,
the post-release survival rates generated in our study are likely an optimistic estimate and should
be taken in consideration with similar studies that have been conducted on this species. Other
studies on post-release fate of FAL also found high post-release survivorship for sharks captured
in longline fisheries. In the equatorial western Pacific Ocean, FAL had 91% post-release survival
out to 60 days if uninjured, this estimate dropped to 44% if injured (Francis et al. 2019). In a
Palauan fishery post-release survival rates were 80% for sharks tagged in all conditions with all
mortalities occurring within 1 day of release (Musyl and Gilman 2018). On the eastern side of
the Pacific Ocean in Central America and Mexico, FAL tagged in panga style longline fisheries
using long-term tags also had high post-release survival rates of 94% to 20 days and 91% to 132
days, respectively (Schaeffer et al. 2019; Schaeffer et al. 2021). They also found that injured
individuals were likely to die within 1 to 3 days of release and the delayed mortalities that did
occur in some individuals after 133 and 168 days were not attributed to the fishing interaction
(Schaeffer et al. 2019; Schaeffer et al. 2021).

 18
Blue shark

 BSHs represent the highest proportion of total shark bycatch in longline fisheries
worldwide. In 2019, the Hawaii longline fleets caught 114,317 BSH, with only 2 sharks retained
and the rest of these individuals discarded at sea (PIFSC 2020). Observer data shows that this
species has the lowest at-vessel mortality rate of all the shark species assessed in this study
(4.9%) where most sharks are released alive. Other studies have shown that hook type, leader
material and shark size are important predictors of at-vessel condition for BSH across longline
fisheries. At-vessel mortality rates of BSH across these studies are as follows: 11.9% for
Canadian Northwest Atlantic Ocean (AO) swordfish (Campana et al. 2009); 13.3% for Portugese
AO swordfish (Coelho et al. 2012); 31% for US Southwest AO swordfish and tuna (Diaz and
Serafy 2005); and 31% for AO swordfish and tuna (Afonso et al. 2012). The fishery
characteristics likely not only affect at-vessel condition for BSH but also their post-release
survival rates. Our tagging data revealed that this species is highly susceptible to mortality post-
release and had the lowest post-release survival rate (62%) of the 5 species tagged. Projections of
survival rates, out to 360 days under the average interaction conditions, using the observed data
set estimated only 18% of sharks survive (see Appendix for species-specific scenario based
survival rates). These estimates are alarming and may have broad impacts for population
projections and should be integrated into future stock assessments. Other studies that have
investigated PRS rates of blue sharks found relatively high post-release survival rates after
longline fishery interactions; 83% to 30 days (Musyl and Gilman 2018). In a swordfish target
longline fishery in the Northwest Atlantic BSH survival was dependent on at-vessel conditions
where all healthy individuals survived, while only 77% survived if injured (Campana et al. 2009,
2016). In both of these studies a proportion of animals were brought on board for tagging and
trailing gear was removed. Trailing gear at a shark’s release appears to be one of those important
interaction conditions that has a large impact on survival for this and other species. In our study
BSH were released with a wide range of trailing gear and sharks released with more gear had
lower post-release survival. Our study also highlights the susceptibility of BSH to predation with
the highest proportion of tags that were ingested (9.7%) by other animals. Of the mortalities that
were not due to ingestions, most (53%) occurred within one day of release and 76.5% were
within 13 days of release. It is possible that differences in mortality rates across studies are due
to fishery characteristics, handling (no trailing gear in the other studies), and the temporal period

 19
of monitoring fate where the 30-day tags capture most mortality events but miss delayed events
that could be due trailing gear.

Bigeye thresher shark

 This study has demonstrated relatively high post-release survival rates (82%) for BTH
captured in the HIDS fishery. Yet, this species is still susceptible to overexploitation because it is
one of the least productive of all epipelagic shark species (e.g., ICCAT 2012; Fu et al. 2016) and
it is one of the most frequently captured shark bycatch species in longline fisheries targeting tuna
and swordfish worldwide (e.g., Walsh et al. 2009; Coelho et al. 2012; Afonso et al. 2012; Fu et
al. 2016). In the US Pacific longline fisheries, BTH represent the second most frequently
captured shark species behind BSH (Walsh et al. 2009). In 2019, 8,748 BTH were caught in the
HIDS with only 58 sharks retained and the rest discarded (PIFSC 2020). The at-vessel mortality
rate (21.5%) in the PIROP data set was much lower than those reported rates in other fisheries:
US longline fisheries targeting swordfish and tuna in the Western AO, 53.7% (Beerkircher et al.
2004); in the Gulf of Mexico, 55.1% (Gallagher et al. 2014); and in the Portugese longline
fisheries, 50.6% (Coelho et al. 2012). Most of the data from the AO fisheries include periods
before J-style hooks were phased out and may account for some of the differences in at-vessel
mortality rates with the PIROP data. Further regulatory changes in the Pacific Islands region,
including finning prohibitions and fishery closures, have also been shown to reduce BTH
mortality (Walsh et al. 2009). In this study, BTH post-release survival rates of tagged animals
was 82% where hooking location (mouth vs. tail) and discard methods were very influential on
post-release survival. Tail-hooked BTH are in poorer shape at the vessel than if they are mouth-
hooked. Additionally tail-hooked animals are often subject to the “Part Removal” handling
method where fishers cut the tip of the tail off to retain their hooks (see Supplementary Materials
Table S1 for details on handling methods by species and impacts to release condition). These
effects were shown to significantly increase the risk of mortality for BTH in this study. Only a
few other studies have published BTH post-release survival data after fisheries interactions.
Musyl et al. (2011) tagged 8 sharks during scientific longline surveys in the central Pacific
Ocean with only 3 tags reporting data with no mortalities. A post-release survival study is
currently underway in the Indian Ocean and preliminary data suggests that survival rates are 41%
(IOTC 2020). Other tagging experiments for this species reported post release survival rates of

 20
You can also read