2021 Texas Section of the American Society of Civil Engineers 2021 Texas Infrastructure Report Card - ASCE Texas Section
←
→
Page content transcription
If your browser does not render page correctly, please read the page content below
2021
PHOTO: DART & TEX RAIL DFW INTERNATIONAL AIRPORT STATION;
DALLAS AREA RAPID TRANSIT.

                                                            Texas Section of the American Society of Civil Engineers
                                                            2021 Texas Infrastructure Report Card
                                                            INFRASTRUCTUREREPORTCARD.ORG/TEXAS

                                                                                                  TexASCE.org/irc
NFRASTRUCTURE ROADS GRID WATERWAYS HIGHWAYS
AVIATION DAMS DRINKING WATER WASTEWATER TRANSI
 TREETS NETWORK AQUEDUCTS AIR ENERGY SUSTAINAB
 NFRASTRUCTURE ROADS HIGHWAYS BRIDGES AVIATION
WATER WASTEWATER TRANSIT RAIL MITIGATION STREETS
 NERGY SUSTAINABILITY RESILIENT INFRASTRUCTURE R
 RIDGES AVIATION DAMS DRINKING WATER WASTEWATE
MITIGATION STREETS AQUADUCTS AIR ENERGY SUSTAINA
 NFRASTRUCTURE ROADS HIGHWAYS BRIDGES AVIATION
WATER WASTEWATER TRANSIT RAIL MITIGATION STREETS
 NERGY SUSTAINABILITY RESILIENT INFRASTRUCTURE R
 RIDGES AVIATION DAMS DRINKING WATER WASTEWATE
RAIL MITIGATION STREETS AQUEDUCTS AIR ENERGY SUS
RESILIENT INFRASTRUCTURE ROADS HIGHWAYS BRIDGE
DAMS DRINKING WATER WASTEWATER TRANSIT RAIL MIT
AQUEDUCTS AIR MITIGATION ENERGY SUSTAINABILITY R
 NFRASTRUCTURE ROADS HIGHWAYS BRIDGES AVIATION
WATER WASTEWATER TRANSIT RAIL MITIGATION STREETS
 NERGY SUSTAINABILITY RESILIENT INFRASTRUCTURE R
 RIDGES AVIATION DAMS DRINKING WATER WASTEWATE
MITIGATION STREETS AQUADUCTS AIR ENERGY SUSTAINA
 NFRASTRUCTURE ROADS HIGHWAYS BRIDGES AVIATION
WATER WASTEWATER TRANSIT RAIL MITIGATION STREETS
 NERGY SUSTAINABILITY RESILIENT INFRASTRUCTURE R
 RIDGES AVIATION DAMS DRINKING WATER WASTEWATE
MITIGATION STREETS AQUADUCTS AIR ENERGY SUSTAINA
 NFRASTRUCTURE ROADS HIGHWAYS BRIDGES AVIATION
WATER WASTEWATER TRANSIT RAIL MITIGATION STREETS
AIR ENERGY SUSTAINABILITY TRANSIT SUSTAINABILITY R
INFRASTRUCTURE

                                    2021
                                                 TEXAS
TABLE OF CONTENTS
           REPORT CARD

  DEDICATION..................................................................................................................................................4

  PREAMBLE.......................................................................................................................................................5

  A MESSAGE FROM ASCE TEXAS SECTION PRESIDENTS........................................................... 7

  EXECUTIVE SUMMARY...............................................................................................................................8

  OVERALL GPA AND GRADES BY INFRASTRUCTURE CATEGORY.........................................9

  METHODOLOGY.........................................................................................................................................10

  INFRASTRUCTURE CATEGORIES................................................................................................14-80

         AVIATION................................................................................................................................................ 14

         BRIDGES................................................................................................................................................. 19

         DAMS....................................................................................................................................................... 23

         DRINKING WATER............................................................................................................................. 29

         ENERGY.................................................................................................................................................. 35

         FLOOD RISK MITIGATION............................................................................................................... 41

         HIGHWAYS AND ROADS................................................................................................................48

         LEVEES.................................................................................................................................................... 54

         PUBLIC PARKS AND RECREATION........................................................................................... 59

         SOLID WASTE....................................................................................................................................... 66

         TRANSIT....................................................................................................................................................71

         WASTEWATER.......................................................................................................................................76

  ACKNOWLEDGMENTS............................................................................................................................. 81

  COMPARISON OF TEXAS’ PREVIOUS GRADES.......................................................................... 85

  SOLUTIONS TO RAISE THE GRADES................................................................................................ 86

  ABOUT THE TEXAS SECTION OF ASCE............................................................................................ 89

                                    2021 TEXAS INFRASTRUCTURE REPORT CARD — PAGE 3
INFRASTRUCTURE

                         2021
                                TEXAS
                                REPORT CARD

DEDICATION
In Memory of Russell ‘Rusty’ Gibson
1974-2020

Russell “Rusty” Gibson PE passed away November
24, 2020 in Tyler. He was born March 26, 1974, in
Greenville, Texas. Rusty was a member of both the
ASCE Texas Section Board of Direction and ASCE
Texas Section Infrastructure Report Card Committee
at the time of his passing. He was a dedicated engineer
and tireless contributor to ASCE, as well as the Texas
Council of Engineering Laboratories (TCEL) and Texas
Geoprofessionals.
Rusty served as the 2020-2021 ASCE Texas Section Vice President Elect for Educational Affairs
and was the Dams Subcommittee Chair and a Levees Subcommittee member for the 2021 Texas
Infrastructure Report Card. He previously served as ASCE Texas Section Director for the ASCE
Northeast Texas Branch from 2014 to 2020. In addition, he was the 2020 Past President of TCEL
and continuously active in the ASCE Northeast Texas Branch, serving in multiple officer roles over
the past decade.
Rusty received his Bachelor of Science in Civil Engineering from Texas A&M University in 1997.
He had been with ETTL Engineers & Consultants, Inc. since 2009 and maintained his Professional
Engineer (PE) license in the states of Texas, Arkansas, Oklahoma, and Louisiana.
The ASCE Texas Section family and civil engineering community will forever feel this loss, as his
family remain in our thoughts.

                         2021 TEXAS INFRASTRUCTURE REPORT CARD — PAGE 4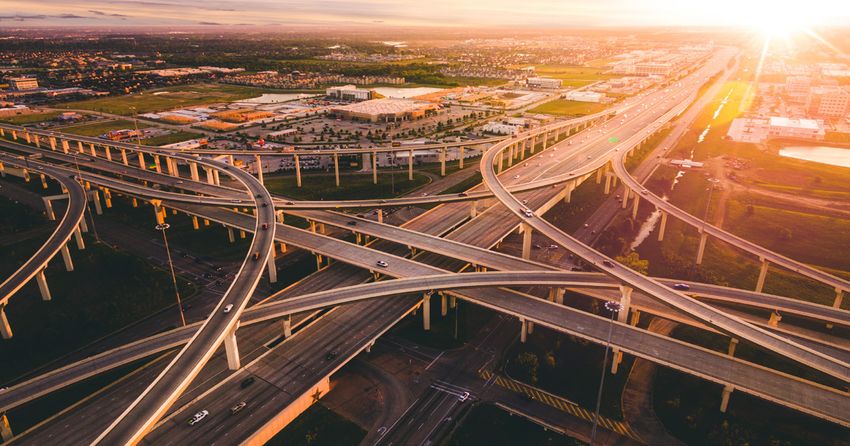
INFRASTRUCTURE

                                  2021
                                           TEXAS
                                           REPORT CARD

PREAMBLE
A few years ago, I attended the American Society of Civil Engineers (ASCE) Legislative Fly-In, in Washington D.C. I have
one distinct memory of a conversation with a junior congressional staffer. I used the phrase “infrastructure investment.”
He scolded me, advising I avoid using the word investment entirely, explaining that Congress members did not consider
infrastructure spending to be an “investment.” He went on to say infrastructure spending was a politically explosive, high
impact budget expenditure leading to increased deficit spending. He implied benefits could not be reasonably presented
in terms of return on investment or ROI. I did not challenge him; I wish I had, because an ROI for the greater good is easy
to define. The savings in maintenance of deteriorating, outdated infrastructure is a significant part of the equation. Higher
infrastructure investment modernizes critical systems and lowers long-term operations and maintenance expenses.
Investing in infrastructure pays for itself several times over.
    •   “Reliable, modern infrastructure is the underpinning of economic growth across communities.”
        — ASCE’s 2021 Failure to Act Report
    •   “Infrastructure is the backbone of the U.S. economy and a necessary input to every economic output.”
        — ASCE’s 2016 Failure to Act Report
Years later, my Infrastructure Report Card (IRC) journey began as a member of the Texas 2017 IRC Water Subcommittee.
Then, in 2019, I jumped at the opportunity to be the Chair of the 2021 Texas IRC Committee, eager to become part of
the solution. I believe ASCE’s Failure to Act Report positions are well stated. Infrastructure is the backbone of a successful
economy and will afford our communities a 21st Century way of life. Neglecting infrastructure will leave us mired in
static 20th Century status quo, or worse. Investment in Texas infrastructure now will result in substantial quality of life
improvement with environmental benefits, and an economy that will continue the economic prosperity Texas has enjoyed
in recent years.
    •   According to national business leaders of the Business Roundtable, infrastructure investment pays for itself
        several times over. Every additional dollar invested in infrastructure delivers a return of roughly $3.70 in
        additional economic growth over 20 years.1
    •   The Interindustry Forecasting Project at the University of Maryland reported, “Reinvesting in U.S.
        infrastructure would raise average household disposable income by $1,400 per year.” 2
    •   The U.S. World Economic Forum estimates that every dollar spent on infrastructure can generate up to 25% in
        economic returns.3
    •   Council of Economic Advisers (CEA), within the Executive Office of the President, estimated that every $1
        billion in Federal highway and transit investment funded by the American Jobs Act would support 13,000 jobs
        for one year.4
‘Past performance is no guarantee of future results’ is a common caveat by brokers promoting investment opportunities.
The opposite is true for infrastructure investment. Past performance by smart infrastructure investment is a robust
guarantee of future results. Where would our economy and quality life be without our 20th century investments in the
interstate highway system, water works, and other elements of critical infrastructure? Infrastructure spending is firmly
tied to improvements in quality of life, environmental resilience, and economic prosperity.
                                                                                                               Continued on page 6.

                                   2021 TEXAS INFRASTRUCTURE REPORT CARD — PAGE 5
INFRASTRUCTURE

                                                 2021
                                                            TEXAS
                                                            REPORT CARD

Continued from page 5.
Over countless months, through quarantined virtual meetings and attention to our regular jobs,
the 2021 Texas IRC Committee found a way to deftly uphold their duties, meet draft deadlines,
and religiously attend committee meetings. And with the advent of global pandemic, we heard
and saw it all through our virtual, audio-visual kaleidoscope and cacophony of malfunctioning video
images, headsets, and microphones. They all faced their own personal pandemic challenges but
still made sure to uphold other personal and professional responsibilities along the way. They
have described the current condition of our infrastructure, predicted funding needs, identified
our state of preparedness and resilience, and attempted to anticipate how the current
extraordinary global setting affected their analysis and predictions. These fine committee
members are strong leaders in their communities, building a better quality of life across the
street and around the world—leveraging smart infrastructure maintenance and design to do so.
This Report Card is dedicated to Dams Subcommittee Chair Russel “Rusty” Gibson PE who passed away suddenly
just before the Thanksgiving Holiday 2020. Like a few others, Rusty pulled double duty as a member of the Levees
Subcommittee. A perennial ASCE leader, you may read more about Rusty and his service to ASCE on page 4 of this
Report Card. I enjoyed and admired Rusty’s approach during our many collaborative subcommittee calls. He was a
respectful, kind, experienced, knowledgeable, down-to-earth, and thoughtful force driving all of us. Long before his
passing, as I prepared the early draft version of this preamble, I was already considering Rusty amongst a handful of
impactful leaders to mention here. I’ll let Rusty exemplify the entire committee. As a person and volunteer leader, Rusty
reflected the mix of work ethic, human, and professional qualities of this committee and so many ASCE members I have
known over the years. We were all deeply saddened by his untimely passing. I am grateful to newly elected ASCE Texas
Section President Sean Merrell for representing all of us by personally attending and paying our collective respects at
Rusty’s memorial service. We were all inspired to refocus with strengthened resolve to prepare the best possible final
product as a fitting memorial to Rusty and his good work in support of ASCE and the communities we serve.
It has been one of my greatest professional privileges to work with this committee, a true high-performing team delivering
a valuable service to the State of Texas with elevated hopes to inform sound and thoughtful infrastructure funding,
planning and development. Through it all, the committee pivoted and adapted, immersed in the times and events that
affected everything and everyone. They demonstrated the flexibility of thought and action that we’d all like to expect
from engineers, scientists, and government leaders. They showed no fear, producing their analysis even while facing
obvious substantial uncertainty. They walked the walk.
My sincere thanks go out to every contributor for their hard work and perseverance, which ultimately made this year’s Texas
  IRC the best ever! This version will forever be special because of the shared challenges we faced together during 2020.
We should follow their thoughtful lead to adapt our policies, plans, and funding to support meaningful progress toward an
ever improving 21st Century infrastructure, quality of life, and environmental sustainability for all.

Mark K. Boyd PhD, PE, CAPM, D.WRE
Chair, 2021 Texas Infrastructure Report Card Committee

    1. Business Roundtable; 2019; Delivering for America; https://s3.amazonaws.com/   3. The One Brief; Life in the Fast Lane: Infrastructure Investment’s Opportunities
       brt.org/BRT-InfrastructureReport12052018.pdf.                                     and Challenges; Capital & Economics; https://theonebrief.com/life-fast-lane-
    2. Business Roundtable; 1 February 2019; New Study: Reinvesting in U.S.              infrastructure-investments-opportunities-challenges/.
       Infrastructure Would Raise Average Household Disposable Income by $1,400       4. US DOT, Federal Highway Administration; Employment Impacts of Highway
       Per Year; https://www.businessroundtable.org/new-study-reinvesting-in-us-         Infrastructure Investment; https://www.fhwa.dot.gov/policy/otps/pubs/
       infrastructure-would-raise-average-household-disposable-income-by-1400-           impacts/; accessed 11 February 2021.
       per-year.
                                                 2021 TEXAS INFRASTRUCTURE REPORT CARD — PAGE 6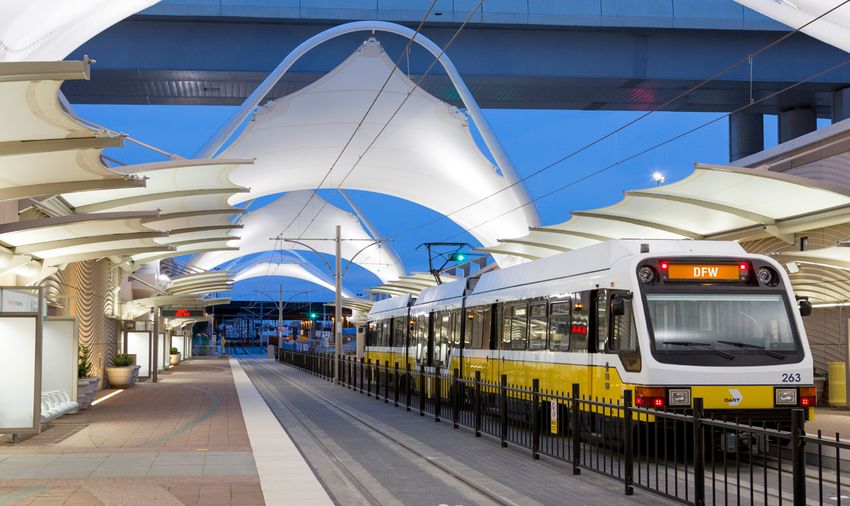
INFRASTRUCTURE

                             2021
                                    TEXAS
                                    REPORT CARD

A MESSAGE FROM ASCE TEXAS
SECTION PRESIDENTS
ASCE Texas Section is pleased to present the results of our 2021 Texas Infrastructure Report Card, a
monumental effort that spanned over two Texas Section Presidential terms and involved an unprecedented
number of 55 participating committee members. This group of hard-working, dedicated volunteers
developed detailed report chapters in accordance with the new ASCE format for primary infrastructure
categories in Texas. We appreciate the time contributed by our committee members, as well as the
stakeholder review effort provided by key government agencies.
ASCE Texas Section represents more than 10,000 civil engineers statewide. As stewards of our
infrastructure, we have an obligation to inform the public and policy makers about its condition and how
best to make improvements. Infrastructure is a critical issue impacting the economy, society, security,
                    and sustainable future of our great state.
                    The report card is an important tool used by the ASCE Texas Section membership
                    to advocate for infrastructure funding. The 2021 Texas Infrastructure Report Card
                    is not intended to be a commentary on, nor an evaluation of, the performance of
                    any government department, agency, or individuals of these groups. We commend
                    these governmental agencies for their hard work and dedication
                    to serving the citizens of Texas. It is through the hard work of
                    the report card committee and the agencies that oversee the
respective infrastructure categories that the citizens of Texas and legislators may
understand the state of our infrastructure.
The use of the ASCE Infrastructure Report Card in the popular television series,
‘Designated Survivor,’ is a clear indication that ASCE is making headway toward
bringing the concept to a broader societal consciousness. We need to continue
educating the public on the importance of infrastructure maintenance, while actively
communicating to our elected officials that funding limitations continue to severely restrict the necessary
investments needed to improve our infrastructure. Please join ASCE Texas Section in advocating for
infrastructure funding. Now is the time to grow, not cut, spending on our infrastructure to continue
the state’s economic prosperity, increase public safety, improve environmental stewardship, and build
resilience.

Sean P. Merrell PE, PTOE, RAS, F.ASCE			                        Susan K. Roth PE, PMP
ASCE Texas Section 2021 President				                           ASCE Texas Section 2020 President

                             2021 TEXAS INFRASTRUCTURE REPORT CARD — PAGE 7
INFRASTRUCTURE

                              2021
                                      TEXAS
                                      REPORT CARD

EXECUTIVE SUMMARY
Texas. The geographically largest continental state, an economic powerhouse for the United States,
leading the way in wind power energy production and some of the largest infrastructure with population
growth pushing an ever-increasing need for improvement. This is the main theme of the 2021 Texas
Infrastructure Report Card, developed by the Texas Section of the American Society of Civil Engineers
(ASCE Texas Section). Though several of the infrastructure categories reviewed show areas of adequate
performance, the clear majority indicate that Texas’ infrastructure lacks funding, proper maintenance,
and is poorly equipped to deal with environmental change as Texas continues to grow.
Texas is the second most populous state in the Nation, behind California. With its population approaching
29 million people, the need for reliable and resilient infrastructure has become paramount. Texas civil
engineers are in the best position to provide fellow citizens with reliable and resilient infrastructure for
their daily lives. Too often, we take for granted the impact that each of these 12 infrastructure categories
has on our day to day lives. Most people only think about infrastructure when it is broken. Consider the
following:
   • You only notice water infrastructure if your shower routine is interrupted by a funny smell coming
     from the pipes, or if the water does not come on at all.
   • The bread you buy at the grocery store, which has its wheat grown and irrigated with the help of
     dams, has gone bad. The carton of eggs you purchase, transported on roads and across bridges, are
     cracked.
   • Perhaps you are rushing to make a flight, only to find out it has been delayed due to too few terminal
     gates to absorb the influx of flights.
   • You may take the garbage to the curb where it is collected with the help of roadway infrastructure;
     but what if it was never removed, or you had to haul it yourself in the back of the minivan?
   • When you flush the toilet, freshwater rushes in to whisk your waste away, never to be worried about
     again. Have you ever wondered where it goes?
   •   During work, it starts to rain and your weather app SHOUTS that it is the biggest storm in over 100
       years. Do you feel safe with the flood reduction measures in place protecting the community, or are
       you worried you cannot make it home?
   • Texas, along with most of the entire country, has the safest and most reliable drinking water supply
     system in the world. Do you want it to stay that way?
   • Do each of the newcomers to Texas bring their own water supply? Do they build their own roads?
     Do they bring their own wastewater treatment systems?

                              2021 TEXAS INFRASTRUCTURE REPORT CARD — PAGE 8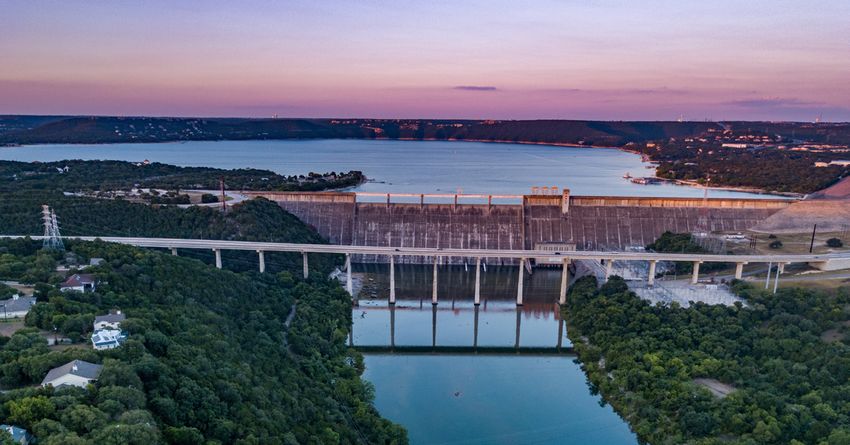
INFRASTRUCTURE
2021
TEXAS
REPORT CARD
We expect infrastructure to work effectively but when it does not, we cannot afford to take it for granted.
ASCE’s mission is to provide essential value to its members and partners, advance civil engineering, and
serve the public good. In carrying out that mission, ASCE has advocated infrastructure and environmental
stewardship through its Infrastructure Report Card since 1998. ASCE Texas Section grades our state’s
infrastructure an overall grade (GPA) of “C”.
As civil engineers in the state of Texas, we have a responsibility to safeguard the health, safety, and
welfare of the public. We believe part of this responsibility includes providing the public and our elected
leaders with critical information about the current state of our infrastructure, which is the main goal of
this Report Card. With this knowledge, the public will increase support for infrastructure improvement
and maintenance.
They will subsequently urge elected leaders to prioritize funding so that our vital infrastructure meets
the needs of current and future Texas citizens. Additionally, we as civil engineers need to utilize best
practices and design techniques to ensure the State’s investment is wisely used.
OVERALL GPA AND GRADES BY
INFRASTRUCTURE CATEGORY
With this most recent infrastructure snapshot, Texas receives a “C”, a slightly higher cumulative grade
than the ”C-“ GPA of 2017. Although several infrastructure categories are in good to fair condition, this
grade indicates a below average condition in many infrastructure categories, including dams, levees, flood
control, highways and roads, and wastewater in Texas, which all received a poor “D+ or below” grade.
While the overall grade of Texas infrastructure has not changed significantly since the previous Report
Card, a third of the categories received unsatisfactory grades. These categories, if left unchanged, will
hinder the growth and competitiveness of the Texas economy, currently the largest and fastest growing
in the nation, and the 9th largest in the world.
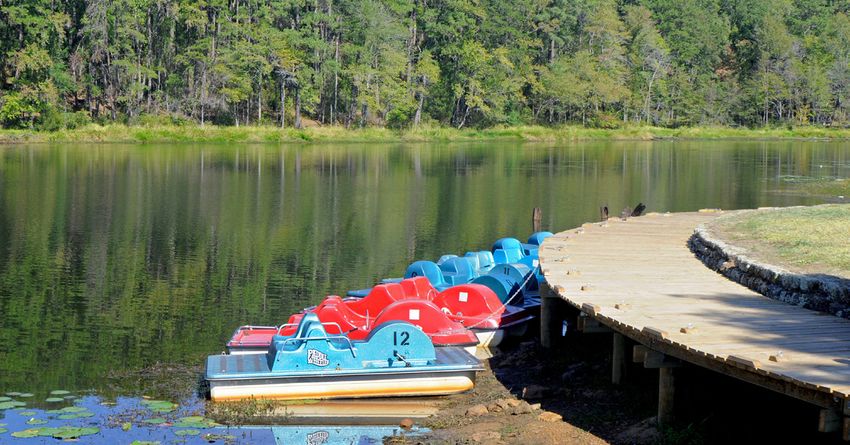
PHOTO: LAKE HOUSE DEVELOPMENT WITH FLOOD MITIGATION INFRASTRUCTURE; CIVILTECH ENGINEERING.
2021 TEXAS INFRASTRUCTURE REPORT CARD — PAGE 9
INFRASTRUCTURE

                              2021
                                     TEXAS
                                     REPORT CARD

METHODOLOGY
INFRASTRUCTURE CATEGORY SELECTION
Periodically, Texas civil engineers provide a comprehensive assessment of the state’s various infrastructure
categories in the Texas Infrastructure Report Card. In doing so, ASCE Texas Section follows in the footsteps
of our parent organization, ASCE, which publishes an Infrastructure Report Card evaluating the nation’s
infrastructure.
ASCE recognizes 17 major infrastructure categories for consideration in preparing infrastructure Report
Cards. ASCE Texas Section’s Infrastructure Report Card Committee carefully considered each of these
17 major infrastructure categories within our state and determined which specific categories required
immediate attention. The results reached by this infrastructure evaluation positively impact the public
and enable elected leaders to make well-informed decisions with respect to infrastructure performance
and funding.
ASCE Texas Section’s Infrastructure Report Card Committee is made up of dedicated civil engineers
from across the state, with decades of expertise across all categories, who volunteered their time to
work with ASCE and ASCE Texas Section staff to prepare the Report Card. Infrastructure Report Card
Committee members include civil engineers employed by public agencies, local government, private
firms, and universities.
For the 2021 Texas Infrastructure Report Card, the Infrastructure Report Card Committee identified a
need to report on 12 infrastructure categories. This Report Card includes the following infrastructure
categories: Aviation, Bridges, Dams, Drinking Water, Energy, Flood Risk Mitigation, Highways and Roads,
Levees, Public Parks and Recreation, Solid Waste, Transit, and Wastewater.

PHOTO: GEORGETOWN MUNICIPAL AIRPORT; GARVER.

                             2021 TEXAS INFRASTRUCTURE REPORT CARD — PAGE 10
INFRASTRUCTURE
2021
TEXAS
REPORT CARD
GRADING METHODOLOGY
Using a simple A to F school report card format, the Report Card examines current infrastructure
conditions and needs, assigning grades, and making recommendations to raise them.
The 55-member Infrastructure Report Card Committee comprised of subject matter experts, gathered
data, and prepare detailed summaries for each infrastructure category. The committee coordinated with
public agencies, private firms, and non-profit groups to gather the data and references presented herein.
Summaries provided for each infrastructure category were peer-reviewed by members of ASCE’s
Committee on America’s Infrastructure.
In addition, the summaries provided for each infrastructure category were reviewed by numerous
stakeholders. ASCE Texas Section consulted with Travis N. Attanasio PE, past Infrastructure Report
Card Committee Chair, to liaise with stakeholders across the state—including public agencies—to
confirm the most recently available data was considered for the Report Card.
The collaboration of public, private, and university volunteers, along with the peer and stakeholder
review process, resulted in this comprehensive assessment of Texas infrastructure.
The Infrastructure Report Card Committee assessed the best available data and references, consulted
with other technical and industry experts, and assigned grades for each infrastructure category using
the following criteria:
• CAPACITY: Does the infrastructure’s capacity meet current and future demands?
• CONDITION: What is the infrastructure’s existing and near-future physical condition?
• FUNDING: What is the current level of funding from all levels of government for the infrastructure
category as compared to the estimated funding need?
• FUTURE NEED: What is the cost to improve the infrastructure? Will future funding prospects
address the need?
• OPERATION AND MAINTENANCE: What is the owners’ ability to operate and maintain the
infrastructure properly? Is the infrastructure in compliance with government regulations?
• PUBLIC SAFETY: To what extent is the public’s safety jeopardized by the condition of the
infrastructure and what could be the consequences of failure?
• RESILIENCE: What is the infrastructure system’s capability to prevent or protect against significant
multi-hazard threats and incidents? How able is it to quickly recover and reconstitute critical services
with minimum consequences for public safety and health, the economy, and national security?
• INNOVATION: How does future technology integrate with today’s infrastructure?
2021 TEXAS INFRASTRUCTURE REPORT CARD — PAGE 11INFRASTRUCTURE
2021
TEXAS
REPORT CARD
GRADING SCALE
EXCEPTIONAL, FIT FOR THE FUTURE
The infrastructure in the system or network is generally in excellent condition, typically
new or recently rehabilitated, and meets capacity needs for the future. A few elements
show signs of general deterioration that require attention. Facilities meet modern
standards for functionality and are resilient to withstand most disasters and severe
weather events.
GOOD, ADEQUATE FOR NOW
The infrastructure in the system or network is in good to excellent condition; some
elements show signs of general deterioration that require attention. A few elements
exhibit significant deficiencies. Safe and reliable, with minimal capacity issues and
minimal risk.
MEDIOCRE, REQUIRES ATTENTION
The infrastructure in the system or network is in fair to good condition; it shows
general signs of deterioration and requires attention. Some elements exhibit significant
deficiencies in conditions and functionality, with increasing vulnerability to risk.
POOR, AT RISK
The infrastructure is in poor to fair condition and mostly below standard, with many
elements approaching the end of their service life. A large portion of the system
exhibits significant deterioration. Condition and capacity are of serious concern with
strong risk of failure.
FAILING/CRITICAL, UNFIT FOR PURPOSE
F The infrastructure in the system is in unacceptable condition with widespread
advanced signs of deterioration. Many of the components of the system exhibit signs
of imminent failure.
2021 TEXAS INFRASTRUCTURE REPORT CARD — PAGE 122021
C
Aviation Bridges Dams
B- B- D+
Drinking Water Energy Flood Risk Mitigation
C- B+ C-
Highways & Roads Levees Parks & Recreation
D+ D C-
Solid Waste Transit Wastewater
B B- D
TexASCE.org/irc #TxIRC2021AVIATION
PHOTO: DALLAS LOVE FIELD; CITY OF DALLAS.
AVIATION
EXECUTIVE SUMMARY
Texas continues to be a geographically critical hub to the nation’s domestic and international passenger
travel and air freight, boarding 90 million passengers and moving 5.8 million tons of cargo in 2019. Though
the physical condition of the state’s airfield infrastructure is good overall, the increase in traffic from
previous years puts strain on the aging system. Timely airfield pavement rehabilitation has occurred at
airports through continued investments from the Federal Aviation Administration (FAA), the Texas
Department of Transportation (TxDOT), and local municipalities. While airfield infrastructure is in good
condition, too many airports around the state are overcrowded, cramped, and operate inefficiently at
peak travel times due to outdated terminals and support facilities, including baggage and package handling
systems.
Six of Texas’ commercial airports rank in the top 50 nationwide for annual passenger enplanements with
Dallas Fort Worth (DFW) International Airport as the 4th busiest and George Bush Intercontinental Airport
as the 14th busiest. The aviation industry is changing in a variety of ways, driven largely by fluctuations in
consumer behavior, expectations, and rapid shifts in the characteristics and structure of logistic supply
chains. Texas’ general aviation airports serving private and small aircraft charter operations are a significant
component of aviation infrastructure, conducting 5.7 million operations annually that generate $9.3
billion in economic impact. Texas’ inevitable aviation change will need to be met with increased economic
investments, ongoing airport redesign, capacity expansion, and service improvement projects throughout
the state—leading to an estimated $11.2 billion in airport infrastructure demands over the next 5 years.
2021 TEXAS INFRASTRUCTURE REPORT CARD — PAGE 14CONDITION
The current state of Texas’ airfield infrastructure is good. Timely upkeep and airfield pavement rehabilitation has occurred at commercial
services and general aviation airports through continued investments from the FAA’s Airport Improvement Program (AIP); airport
sponsors such as city, county, or airport boards, and TxDOT’s Aviation Block Grant. As of 2020, the National Plan of Integrated Airport
Systems’ (NPIAS) report shows 98% of commercial airports have airfield pavement in fair condition or better. General aviation airports
are reporting runways in satisfactory condition with a pavement condition index (PCI) rating of 75 (out of 100) while the taxiways have
a PCI rating of 76. Although runways and taxiway condition can be an easy and convenient representation of infrastructure condition,
pavement is only one of many components.
While passenger and cargo traffic through commercial airport facilities continues to grow at a moderate rate, Texas’ outdated aviation
infrastructure in terminals, support facilities, baggage handling, package handling, and other areas are not keeping up with the changing
logistical passenger, freight delivery and business demands. As a result, too many airports around the state are overcrowded, cramped,
and operate inefficiently at peak demand times. Parking and ground transportation structures, and the systems surrounding them linking
other components are also in need of rehabilitation. This can be seen by the recent uptick in terminal projects at various airports around
the state.
Texas has a total of 264 general aviation (GA) airports of which 186, including 2 heliports, are included in the current NPIAS report. An
additional 78 other airports are deemed necessary for the system. Texas GA airports are home to over 25,000 registered aircraft. GA
airports have 9,100 based aircraft reported with 5.7 million operations. General aviation as an industry has an annual impact that exceeds
$9.3 billion in Texas, and in 2018, was responsible for generating 50,000 jobs.
CAPACITY AND INNOVATION
Commercial service airports are public facilities with scheduled passenger service and 2,500 or more enplaned passengers boarding per
year. Texas has 24 commercial service airports, which together received 80 million enplanements in 2019. Currently, 1.1 million jobs are
created and sustained by commercial service airports contributing $41.8 billion to local payrolls while providing an overall economic impact
of $130 billion to the Texas economy.
The FAA’s NPIAS forecasts modest 1.5% long term commercial passenger demand growth. To minimize financial losses, air carriers will
continue to fine-tune their business models by lowering operating costs, cutting unprofitable routes, and grounding older, less fuel-
efficient aircraft.
The state’s airport airfield capacity is largely sufficient because runways and taxiways can accommodate most air traffic demand. Some
needed capacity improvements include runway extensions to accommodate larger aircraft and longer routes. Capacity constraints are
related to cargo sorting facilities, terminal gates, Federal Inspection Facilities (FIS), aircraft parking aprons for Remain Over Nights
(RONs) and Ground Support Equipment (GSE) areas, as well as terminal garage parking.
Texas aviation activity continued to grow at a slightly higher rate than the U.S. average. Currently, Texas GA airports handle approximately
5.7 million operations annually. Currently, Texas has over 25,000 registered aircraft making up 9% of the total U.S. registered aircraft
fleet. Most Texas GA airports continue to have enough capacity for the near term. The larger GA airports designated as relievers continue
to program projects to increase capacity and safety, enhance service at major commercial service airports and meet the recent changes to
the FAA Airport Design Advisory Circular 150/5300-13 (latest edition).
Federal Block Grant & Discretionary to TxDOT AIP for Commercial Service & Discretionary Total
2019 $53,813,735 $265,718,534 $319,532,269
2018 $60,710,492 $177,485,558 $238,196,050
2017 $55,010,157 $200,064,262 $255,074,419
2016 $67,183,650 $176,591,979 $243,775,629
2015 $75,968,186 $198,832,936 $274,801,122
2014 $56,514,593 $195,200,377 $251,714,970
Total $369,200,813 $1,213,893,646 $1,583,094,459
TABLE 1. Summary of Federal Funding. This table illustrates state apportionment and discretionary granted funding through the State Block
Grant Program (SBGP) and Airport Improvement Program (AIP).
2021 TEXAS INFRASTRUCTURE REPORT CARD — PAGE 15GA traffic for Texas should eventually return to a growth rate of 3% over the next 5 years. Changes to commercial air travel due to
COVID-19 may impact this growth rate as it is possible that travel by private aircraft may be preferred over commercial travel in the near
term.
NextGen flight procedures are an innovation that continues to be implemented at many commercial service airports around the country.
Improved data communications between pilots and air traffic controllers helps to communicate more quickly and more easily with less
risk of miscommunication than radio communications. The switch to a primarily satellite-enabled navigation system that is more precise
than traditional ground-based navigation. Satellites enable the FAA to create optimal flight paths in the national air space from departure
to cruising altitude to landing. These procedures have increased the flight safety, efficiency and helped to improve the environmental
performance of aircraft As NextGen continues to be implemented over the next decade, it will allow for more exact location of aircraft as
well as clearer vision of the surrounding conditions for that aircraft, including weather patterns and other aircraft.
Other areas of airport innovation include use of autonomous shuttles and clean energy vehicles for environmental improvements, use of
touchless technology is also increasing to improve the customer service experience.
FUNDING AND FUTURE NEEDS
Commercial service airports in Texas utilize FAA AIP entitlement, discretionary and passenger facility charge (PFC) for funding for airfield
infrastructure improvements. Commercial service entitlement and discretionary grant funding over the last five years was $1.2 billion.
FAA AIP grant funding is expected to continue at an average of $220 million annually. PFCs vary by the number of enplaned passengers
that fly from the airport. This fee has been capped at $4.50/passenger for over two decades now and needs to be increased to help meet
demand. Depending on the airport, economy, and other outside factors the amount a commercial service airport receives can vary greatly
from year to year. Estimates of PFCs for Texas airports can be found here: https://www.faa.gov/airports/pfc/monthly_reports/.
According to the Airports Council International (ACI), Texas airport infrastructure needs $11.2 billion over the next five years. Additional
investments and funding sources are needed to accommodate airfield configuration updates to meet new, more stringent standards.
At nearly 56%, terminal projects account for the largest share of airport infrastructure needs. Such projects are needed to accommodate
more passengers and larger aircraft, implement new security requirements, facilitate increased competition among airlines, and enhance
the passenger experience. Legacy carriers are shifting larger aircraft to international services, and 70 to 90-seat regional jets are replacing
50-seat regional jets. Low-cost carriers have been initiating service at major airports, creating a demand for additional gates. Anticipated
requirement changes are needed to respond to the evolving aviation market.
FIGURE 1. Estimated National Plan of Integrated Airport Systems (NPIAS) General Aviation
Funding Needs vs Texas Department of Transportation (TxDOT) Capital Improvement Program (CIP)
Funding per fiscal year.
2021 TEXAS INFRASTRUCTURE REPORT CARD — PAGE 16The FAA’s NPIAS estimated the need for $901.3 million in Airport Improvement Program-eligible development projects at Texas GA
airports over the five-year period from fiscal years 2021 to 2025. Capital improvements at Texas GA airports are funded through a
combination of FAA AIP funds administered by the state. The most current Texas Aviation Capital Improvement Program (CIP) has
$228 million programmed for fiscal years 2021 to 2023: $159 million through federal funding, $45 million from state funding and $24
million from local sponsor funding. As seen in Figure 1, the available funding is well below the NPIAS projected development needs.
TxDOT has closed a portion of this funding gap with the Routine Airport Maintenance Program (RAMP), allowing GA airport sponsors
to use TxDOT district staff or bid prices from their own contracts to perform a variety of maintenance work on their airports. TxDOT
puts airfield maintenance work at the top of its priorities, so nearly all maintenance is eligible. Funding is 50% of project costs annually up
to a $50,000 grant amount. TxDOT provides a 50% funding match up to a $500,000 grant amount for development of new terminal
facilities at GA airports and will cover up to 90% of project costs up to $1.5 million in federal funds for development of air traffic control
towers. Closing the funding gap will be critical in keeping pavements maintained.
PUBLIC SAFETY, OPERATION, MAINTENANCE, AND RESILIENCE
Worldwide air travel for persons using, working, or living in the vicinity of airports is well known for its excellent track record of safety. Texas’
aviation safety record is part of that national and worldwide safety success. Planning and funding for airport infrastructure must keep up
with the inevitable demands of Texas’ expanding role as a national and worldwide hub. Falling behind on infrastructure development may
cause a severe chain reaction to nationwide and worldwide systems.
The FAA continues to improve the national airspace to make it safer and more efficient for the flying public. GA aircraft continue to be
updated with Global Positioning System (GPS) equipment while more GA airports are requesting GPS and LNAV (lateral navigation)
approaches into their airports to improve location accuracy on approach.
Another less obvious stress on airport development is the changing climate and our ever-evolving understanding of Texas weather. Good
drainage is especially important to airport operations. The National Weather Service (NWS) Atlas 14 study shows that Texas is more
likely to experience larger and more intense storms than previously thought, making severe flooding more likely. Airfield operations
can be compromised by flooded runways and taxiways, and access to and from the airport can also be impaired by flooding. For Texas
airports to remain resilient and operational when faced with increased stormwater pressures, there is a need to update drainage master
plans, judiciously perform routine operation and maintenance procedures to minimize preventable instances of flooding, and invest in
stormwater capacity improvements with drainage designs based on the most recently developed climate information.
The COVID-19 pandemic has additionally uncovered the challenges airports will face implementing safety measures such as effective
social distancing strategies in passenger terminals. Implementing and maintaining the recommended spacing between people for effective
social distancing can be difficult to achieve but will need to be addressed at security checkpoints, customs, ticket counters, aircraft boarding
gates, hold rooms, concessions, and restrooms. There is an urgent need for effective health standards in commercial service airports, and
release of federal grant funding to aid with implementation of new health standards.
PHOTO: ADDISON AIRPORT; GARVER.
2021 TEXAS INFRASTRUCTURE REPORT CARD — PAGE 17AVIATION
RECOMMENDATIONS
TO RAISE THE GRADE
• Increase the cap on the Passenger Facility Charge (PFC) so Texas airports may
access the capital needed to support and improve the state’s aviation infrastructure.
• Implement NextGen system encompassing the planning and implementation of
new airspace technologies.
• Allow the fuel tax to support aviation facilities within the state by increasing the
fuel tax cap on air carrier/transport companies.
• Invest in modernization and expansion of existing airport facilities to ensure
resiliency and sustainability and to accommodate future airline growth.
• Provide additional state funding to aviation initiatives
• Support Texas legislature toward regulatory zoning and development reforms to
improve strategic land planning for new and expanded airport facilities.
• Invest in stormwater capacity improvements to accommodate the most recent
information about geographic rainfall patterns within the state.
• Support and foster leadership to fill the funding gap between available funding
and needs so Texas can fulfill its potential to become modernized like never before.
Sources
• National Weather Service NOAA Precipitation-Frequency Atlas of the United States
(Atlas 14); https://www.nws.noaa.gov/oh/hdsc/PF_documents/Atlas14_Volume11.pdf
• National Plan of Integrated Airport Systems (NPIAS); https://www.faa.gov/airports/
planning_capacity/npias/
• FAA Grant History; https://www.faa.gov/airports/aip/grant_histories/lookup/
• www.faa.gov/nextgen
• US DOT; Small Community Air Service Development Program (SCASDP); https://www.
transportation.gov/policy/aviation-policy/small-community-rural-air-service/SCASDP
• TxDOT Aviation and Texas Airport System Plan 2010
• Texas Aviation 2018 Economic Impact Study
• ACI Report; Texas Airports are Terminally Challenged
• FAA PFC Monthly Reports; https://www.faa.gov/airports/pfc/monthly_reports/
2021 TEXAS INFRASTRUCTURE REPORT CARD — PAGE 18BRIDGES
PHOTO: AUSTIN 360 BRIDGE; B. SEIDEL.
BRIDGES
EXECUTIVE SUMMARY
Texas maintains the largest bridge inventory in the nation, has the smallest percentage (1.3%) of structurally
deficient bridges along with Nevada, and, according to the Texas Department of Transportation (TxDOT),
achieves a level of safety where zero crashes are caused annually by poor bridge conditions. However, to
accommodate Texas’ growth and continue this good standing, estimates show $3.6 billion needed annually
for bridges and culverts over the next 10 years, while $18 billion is still needed over the same timeframe
to erase the backlog of deficient bridges. Public initiative and legislative leadership led to the passing of
Propositions 1 and 7 in 2014 and 2015, respectively, to raise funds, but heavier trucks, a growing population,
and some bridges in flood-prone areas, exert increasing demand on the system, requiring continued priority
and resources for maintaining and improving the state’s assets.
INTRODUCTION
Texas has the largest bridge inventory in the United States. The assets are valued at $104 billion and include about 57,000 bridge structures
which include over 22,000 culvert crossings with an overall deck area of about 539 million square feet. These bridges carry an astounding
737 million vehicles a day. Based on the responsible authority for funding, Texas bridges are grouped into two categories: on-system and
off-system bridges.
• On-system bridges are located on state highway systems and funded by a combination of state and federal sources, which includes
about 461 million square feet of deck area comprised of 36,000 bridges and culverts.
• Off-system bridges are the rest of the system not located on the state highway system and are owned by local governments.
2021 TEXAS INFRASTRUCTURE REPORT CARD — PAGE 19CAPACITY
As of 2019, there are over 18,000 national highway system (NHS) bridges and culverts carrying an average 595 million vehicles per day
and accounting for 350 million square feet of deck area.
Based on a 10-year analysis (from 2010 to 2019) of structure inventory data, traffic volumes on bridges and their associated culvert
systems have been increasing at an average annual rate of 1.4% for on-system and 1.2% for off-system. To keep up with this demand,
TxDOT and the off-system jurisdictions have been adding 8.7 million square feet per year with an annual investment of $1.7 billion for
on-systems and $230 million off-system.
The nature of bridge capacity demand is changing and adversely impacting infrastructure. For example, the TxDOT Bridge Division must
process and approve requests from the Texas Legislature for increased truck size and weight regulations as well as developments in new
truck configurations such as Specialized Hauling Vehicles (SHVs). These heavier single unit trucks (not tractor trailers) cause structural
wear and reduced bridge life.
CONDITION
Despite the daunting maintenance task associated with the nation’s largest bridge inventory, Texas, along with Nevada, has the smallest
percentage (1.3%) of structurally deficient bridges in the nation. According to the TxDOT 2018 Report on Texas Bridges, 82% of Texas
bridges were classified as “good” or “better” condition. The percentage of “Good or Better” bridges increased from 78.5% in 2008 to 82%
in 2018, indicating a positive trend in this classification.
Figure 2 presents deck area age distribution for both on and off-system bridges. Assuming a forecasted average 50-year bridge life, 24%
of the on-system bridge network is older than 50 years while only 16% of off-system bridges are at or nearing the end of their service life.
FUNDING AND FUTURE NEEDS
Primarily, funding comes from two sources: federal and state. Federal funds are appropriated by Congress through the federal Highway
Trust Fund while the State utilizes motor fuels tax, vehicle registration fees, sales taxes (Proposition 7), and oil & gas production tax
(Proposition 1). Proposition 1 allocates approximately $700 million per year from 2022 to 2029 based on the historical average since
2015. Proposition 7 dedicates a portion of the state’s general sales tax for non-tolled highway construction, maintenance, and rehabilitation
projects. The 10-Year TxDOT Unified Transportation Program (UTP) 2020 allocates $3.6 billion/year to Category 6, which is dedicated
to bridge replacement and rehabilitation.
TxDOT’s UTP 2020 allocates funding of $3.6 billion per year for bridges and culverts through 2030. Texas population is projected to
increase to 45 million people by 2040. This population increase will require expansion of the transportation system to keep up with the
economic growth. An estimated $2 billion per year investment in bridge and culvert expansion is needed to meet future capacity demand.
An additional estimated $1.8 billion per year is needed to erase the backlog of deficient bridges for the next 10 years. Without considering
inflation, these estimates are based on average spending in past years to meet demand and an estimated upgrade cost per square foot for
bridges not classified as Good or Better. The values in the 2020 UTP may fall short to meet these requirements over the next ten years.
On-System (461 million sq ft) Off-System (78 million sq ft)
16%
24%
40% 38%
46%
36%
< 20 years 20 to 50 years > 50 years < 20 years 20 to 50 years > 50 years
FIGURE 2. Age of On- and Off-System bridges per deck area.
2021 TEXAS INFRASTRUCTURE REPORT CARD — PAGE 20OPERATION AND MAINTENANCE
To maintain and/or improve the Texas bridge quality, proper operation and maintenance (O&M) of the state bridges is essential. Lack of
proper and timely O&M results in a decline in the bridge’s useful life and ride quality, an adverse impact on drivers’ public safety, and an
increase in deteriorated bridge repair cost. Extensive repairs or bridge replacement also adversely affects traffic flow and travel time due
to potential bridge closures. Bridge maintenance ensures the integrity of bridge structural elements, repairs the bridge deck and deck
joints, paints the bridge, and repairs guard rail damage. Maintenance of the river channel underneath the bridge is also included in bridge
maintenance costs.
Recognizing these facts, the Federal Highway Administration (FHWA) has allowed funds to be used to perform preventive maintenance on
highway bridges under the Highway Bridge Replacement and Rehabilitation Program (HBRRP). The 2030 committee report estimated
an annual cost of $105 million to inspect and provide regular maintenance for bridges on average over a 20-year planning horizon. Annual
maintenance could include cleaning debris (on the bridge or under water crossing bridges), painting, joint and approach slab repairs and
bridge pads and pins inspections and replacement.
PUBLIC SAFETY
Public safety concerns are associated with bridges that are unable to carry current and future traffic due to restricted number of lanes
and geometric road design aspects, such as alignment issues with the existing roadway approaches. Capacity issues can lead to possible
traffic queueing and an associated increase in crash numbers and severity. Bridge-road alignment issues such as limited sight distances to
structure approaches have also been known to increase crash rates, according to road safety research. Road and bridge flooding are also
associated with crashes and will later be discussed in the Resiliency section of this report.
TxDOT’s maintained Crash Records Information System (CRIS) shows an average of 3,500 bridge crashes per year for the past 10 years.
There have been no reports of crashes due specifically to poor bridge condition, except for any due to low clearance from bridges designed
under older criteria.
In Texas frequent bridge icing and flooding at water crossings have heightened public and media attention to bridge safety concerns. Such
attention can be used to advance bridge replacement funding by legislators. Recent federal transportation legislation has also contributed
to systematic approaches to data collection and management systems for crashes involving bridges to ascertain impacts of measures to
improve transportation efficiencies and crash prevention strategies.
RESILIENCE
Texas rainfall patterns are changing with evolving scenarios for Texas weather and climate patterns. Texas bridges and the motorists they
serve will become increasingly vulnerable to flooding, with the current Texas bridge design not expected to hold up to flooding in the
coming years. The current TxDOT approach to selecting the design standard for a structure that may experience flooding such as a
bridge or culvert, is to use a reference table that specifies a range of design Annual Exceedance Probability (AEP). AEPs are selected
depending on the risk associated with different types of structures and highway functional classes. This predicts the flood standard around
which the bridge should be designed. Analysis of the AEPs suggests original design accounted for a 50-year return period whereas for
the off-system the return period would be lower or 25-year. There is an economic balance for using higher design standards with impacts
on construction costs and associated reductions on weather related traffic impacts. To increase the resiliency of the bridge and culvert
infrastructure, TxDOT will be facing an increased demand for funding.
INNOVATION
Innovation in bridge design and development comes in many forms and shapes: Geometry, structural design, materials, testing, foundations,
construction methodology, and contracting methods. TxDOT has been open to innovation, primarily the use of prefabrication, in its
projects to solve complex problems, expediting construction and reducing costs.
TxDOT has been a pioneer in improving construction speed and control by opting to use pre-cast structures when feasible such as on the
Louetta Road Overpass project in Houston. Traffic disruption was minimized to only 6 hours on the US 290 Ramp G project with a pre-
cast straddle bent cap. The projected disruption using other methods was 41 days. To increase durability of the new structure, designers
used high performance concrete (HPC) and hollow column segments to take advantage of the high strength concrete that goes with
pre-casting. The column segments were stacked sequentially, the joints epoxy-bonded, and the columns post-tensioned vertically after all
segments were in place. The bottom segment was filled with concrete to protect it against possible vehicular impact.
2021 TEXAS INFRASTRUCTURE REPORT CARD — PAGE 21BRIDGES
RECOMMENDATIONS
TO RAISE THE GRADE
• Prioritize efforts to maintain and improve the national highway system
(NHS). The NHS carries the bulk of state traffic and is of strategic importance to
maintaining flow of goods to keep Texas’ economy rolling.
• Reevaluate design standards. Certain bridges and culverts in high traffic demand
areas should be built to more stringent flood standards. The balance of risk and
cost and prioritizations focusing on the replacement of flood prone bridges and
culverts should be directed to increase the transportation network resiliency.
Sources
• Texas Transportation Commission; 2020 Unified Transportation Program; http://ftp.
dot.state.tx.us/pub/txdot/tpp/utp/2020-utp.pdf
• 2030 Committee Texas Transportation Needs Report; February 2009; https://
texas2030committee.tamu.edu/documents/final_022609_report.pdf
• Crash Records Information System; http://ftp.dot.state.tx.us/pub/txdot-info/trf/crash_
statistics/automated/standardextractfilespecification.xlsx
• TxDOT; 2019 March; Highway Bridge Program
• TxDOT; 2019 September; Hydraulic Design Manual;. http://onlinemanuals.txdot.gov/
txdotmanuals/hyd/manual_introduction.htm
• R. Medlock, M. Hyzak, and L. Wolf; Innovative Prefabrication in Texas Bridges
• PonTex Coding Guide; http://onlinemanuals.txdot.gov/txdotmanuals/ins/coding_
guide.pdf
• TxDOT; 2018 September; Report on Texas Bridges; http://ftp.dot.state.tx.us/pub/txdot-
info/library/reports/gov/bridge/fy18.pdf
2021 TEXAS INFRASTRUCTURE REPORT CARD — PAGE 22You can also read