2021 UNDERSTANDING THE PERFORMANCE OF MACHINE LEARNING MODELS TO PREDICT CREDIT DEFAULT: A NOVEL APPROACH FOR SUPERVISORY EVALUATION
←
→
Page content transcription
If your browser does not render page correctly, please read the page content below
UNDERSTANDING THE PERFORMANCE OF
MACHINE LEARNING MODELS TO PREDICT
 2021
CREDIT DEFAULT: A NOVEL APPROACH
FOR SUPERVISORY EVALUATION

Documentos de Trabajo
N.º 2105

Andrés Alonso and José Manuel Carbó
UNDERSTANDING THE PERFORMANCE OF MACHINE LEARNING MODELS
TO PREDICT CREDIT DEFAULT: A NOVEL APPROACH FOR SUPERVISORY
EVALUATION
UNDERSTANDING THE PERFORMANCE OF MACHINE
LEARNING MODELS TO PREDICT CREDIT DEFAULT: A NOVEL
APPROACH FOR SUPERVISORY EVALUATION

Andrés Alonso and José Manuel Carbó (*)
BANCO DE ESPAÑA

(*) The authors work as senior economists in the Financial Innovation Division of Banco de España, and appreciate
the comments received from José Manuel Marqués, Ana Fernández and Sergio Gorjón, as well as all the feedback
received in two internal seminar done at the Spanish Central Bank, and the 9th Research Workshop of the
European Banking Authority (EBA), specially from our discussant Klaus Duellmann (European Central Bank).
Part of this paper has been used for the realization of the master´s thesis of José Manuel Carbó for the Master in
Artificial Intelligence for Financial Markets of Bolsas y Mercados Españoles.
The opinions and analyses expressed in this paper are the responsibility of the authors and, therefore, do not
necessarily match with those of the Banco de España or the Eurosystem.

Documentos de Trabajo. N.º 2105
2021
The Working Paper Series seeks to disseminate original research in economics and finance. All papers
have been anonymously refereed. By publishing these papers, the Banco de España aims to contribute
to economic analysis and, in particular, to knowledge of the Spanish economy and its international
environment.

The opinions and analyses in the Working Paper Series are the responsibility of the authors and, therefore,
do not necessarily coincide with those of the Banco de España or the Eurosystem.

The Banco de España disseminates its main reports and most of its publications via the Internet at the
following website: http://www.bde.es.

Reproduction for educational and non-commercial purposes is permitted provided that the source is
acknowledged.

© BANCO DE ESPAÑA, Madrid, 2021

ISSN: 1579-8666 (on line)
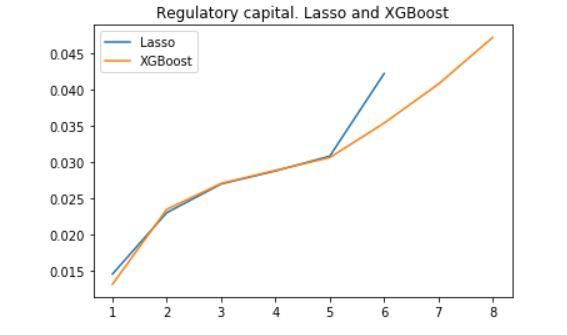
Abstract

In this paper we study the performance of several machine learning (ML) models for
credit default prediction. We do so by using a unique and anonymized database from a
major Spanish bank. We compare the statistical performance of a simple and traditionally
used model like the Logistic Regression (Logit), with more advanced ones like Lasso
penalized logistic regression, Classification And Regression Tree (CART), Random
Forest, XGBoost and Deep Neural Networks. Following the process deployed for the
supervisory validation of Internal Rating-Based (IRB) systems, we examine the benefits
of using ML in terms of predictive power, both in classification and calibration. Running
a simulation exercise for different sample sizes and number of features we are able to
isolate the information advantage associated to the access to big amounts of data, and
measure the ML model advantage. Despite the fact that ML models outperforms Logit
both in classification and in calibration, more complex ML algorithms do not necessarily
predict better. We then translate this statistical performance into economic impact. We
do so by estimating the savings in regulatory capital when using ML models instead of
a simpler model like Lasso to compute the risk-weighted assets. Our benchmark results
show that implementing XGBoost could yield savings from 12.4% to 17% in terms of
regulatory capital requirements under the IRB approach. This leads us to conclude that
the potential benefits in economic terms for the institutions would be significant and this
justify further research to better understand all the risks embedded in ML models.

Keywords: machine learning, credit risk, prediction, probability of default, IRB system.

JEL classification: C45, C38, G21.
Resumen

En este artículo estudiamos el rendimiento de diferentes modelos de aprendizaje
automático —machine learning (ML)— en la predicción de incumplimiento crediticio. Para
ello hemos utilizado una base de datos única y anónima de uno de los bancos españoles
más importantes. Hemos comparado el rendimiento estadístico de los modelos
tradicionalmente más usados, como la regresión logística (Logit), con modelos más
avanzados, como la regresión logística penalizada (Lasso), árboles de clasificación
y regresión, bosques aleatorios, XGBoost y redes neuronales profundas. Siguiendo
el proceso de validación supervisora de sistemas basados en calificaciones internas
—Internal ratings-based approach (IRB)— hemos examinado los beneficios en poder
predictivo de usar técnicas de ML, tanto para clasificar como para calibrar. Hemos
realizado simulaciones con diferentes tamaños de muestras y número de variables
explicativas para aislar las ventajas que pueden tener los modelos de ML asociadas
al acceso de grandes cantidades de datos, de las ventajas propias de los modelos de
ML. Encontramos que los modelos de ML tienen un mejor rendimiento que Logit tanto
en clasificación como en calibración, aunque los modelos más complejos de ML no
son necesariamente los que predicen mejor. Posteriormente traducimos esta mejoría
en rendimiento estadístico a impacto económico. Para ello estimamos el ahorro en
capital regulatorio cuando usamos modelos de ML en lugar de métodos tradicionales
para calcular los activos ponderados en función del riesgo. Nuestros resultados indican
que usar XGBoost en lugar de Lasso puede resultar en ahorros de un 12,4 % a un
17 %, en términos de capital regulatorio, cuando utilizamos el proceso IRB. Esto nos
lleva a concluir que los beneficios potenciales de usar ML, en términos económicos,
serían significativos para las instituciones, lo que justifica una mayor investigación para
comprender mejor todos los riesgos incorporados en los modelos de ML.

Palabras clave: aprendizaje automático, riesgo de crédito, predicción, probabilidad de
impago, modelos IRB.

Códigos JEL: C45, C38, G21.
1. Introduction - Motivation
 Recent surveys show that credit institutions are increasingly adopting Machine Learning
 1. Introduction - Motivation
 (ML) tools in several areas of credit risk management, like regulatory capital calculation,
 Recent surveys show that credit institutions are increasingly adopting Machine Learning
 optimizing provisions, credit-scoring or monitoring outstanding loans (IIF 2019, BoE 2019,
 (ML) tools in several areas of credit risk management, like regulatory capital calculation,
 Fernández 2019). While this kind of models usually yield better predictive performance
 optimizing provisions, credit-scoring or monitoring outstanding loans (IIF 2019, BoE 2019,
 (Albanessi et al 2019, Petropoulos et al 2019)1, from a supervisory standpoint they also
 Fernández 2019). While this kind of models usually yield better predictive performance
 bring new challenges. Aspects like interpretability, stability of the predictions and
 (Albanessi et al 2019, Petropoulos et al 2019)1, from a supervisory standpoint they also
 governance of the models are amongst the most usually mentioned factors and concerns
 bring new challenges. Aspects like interpretability, stability of the predictions and
 arising from the supervisors when evaluation ML models in financial services (EBA 2017,
 governance of the models are amongst the most usually mentioned factors and concerns
 EBA 2020, BdF 2020). All of them point towards the existence of an implicit cost in terms
 arising from the supervisors when evaluation ML models in financial services (EBA 2017,
 of risk that might hinder the use of ML tools in the financial industry, as it becomes more
 EBA 2020, BdF 2020). All of them point towards the existence of an implicit cost in terms
 difficult (costly) for the supervisor to evaluate these innovative models in order to ensure
 of risk that might hinder the use of ML tools in the financial industry, as it becomes more
 that all the regulatory requirements are fulfilled. In Alonso and Carbó (2020), we identified a
 difficult (costly) for the supervisor to evaluate these innovative models in order to ensure
 trade-off between predictive performance and the risk of ML models, suggesting a
 that all the regulatory requirements are fulfilled. In Alonso and Carbó (2020), we identified a
 framework to adjust their statistical performance by the models’ embedded risk from a
 trade-off between predictive performance and the risk of ML models, suggesting a
 supervisory perspective. The absence of transparency and lack of a standardized
 framework to adjust their statistical performance by the models’ embedded risk from a
 methodology to evaluate these models is indeed mentioned by market participants when
 supervisory perspective. The absence of transparency and lack of a standardized
 asked about the major impediments that may limit further implementation or scalability of
 methodology to evaluate these models is indeed mentioned by market participants when
 ML technology in the financial industry (IIF 2019, BoE 2019, NP 2020). However, in order
 asked about the major impediments that may limit further implementation or scalability of
 to define an adequate regulatory approach it is important to understand not only the risks
 ML technology in the financial industry (IIF 2019, BoE 2019, NP 2020). However, in order
 associated with the use of this technology, but also the tools available to mitigate these
 to define an adequate regulatory approach it is important to understand not only the risks
 risks. Given the novelty and complexity of some of these statistical methods this is not an
 associated with the use of this technology, but also the tools available to mitigate these
 easy task. Therefore, prior to enter into the risk analysis it could be relevant to ask what will
 risks. Given the novelty and complexity of some of these statistical methods this is not an
 be the real economic gains that credit institutions might get when using different ML
 easy task. Therefore, prior to enter into the risk analysis it could be relevant to ask what will
 models. While there exists an extensive and growing literature on the predictive gains of ML
 be the real economic gains that credit institutions might get when using different ML
 on credit default prediction, any comparison of results from different academic studies
 models. While there exists an extensive and growing literature on the predictive gains of ML
 carries the caveat of relying on different sample sizes, types of underlying assets and several
 on credit default prediction, any comparison of results from different academic studies
 other differences, like observed frequency of defaults, which would prevent us from having
 carries the caveat of relying on different sample sizes, types of underlying assets and several
 a robust result to be used for this purpose.
 other differences, like observed frequency of defaults, which would prevent us from having
 a
 In robust result
 this paper wetoaim
 beto
 used for thisthis
 overcome purpose.
 limitation by running a simulation exercise on a unique
 and anonymized database provided by a major Spanish bank. To this extent we compare
 In this paper we aim to overcome this limitation by running a simulation exercise on a unique
 the performance of a logistic regression (Logit), a well-known econometric model in the
 and anonymized database provided by a major Spanish bank. To this extent we compare
 banking industry (BIS 2001), with the performance of the following ML models: Lasso
 the performance of a logistic regression (Logit), a well-known econometric model in the
 penalized logistic regression, Classification And Regression Tree (CART), Random Forest,
 banking industry (BIS 2001), with the performance of the following ML models: Lasso
 1 For further references, see next section on literature review.
 XGBoost and Deep Neural Networks. As a result, we will compute, firstly, the benefits in
 terms
 1
 of references,
 For further statisticalseeperformance of using
 next section on literature ML models from a micro-prudential perspective.
 review.

 Evaluating the macro-prudential effects from the use of ML models is out of the scope of
BANCO DE ESPAÑA 7 DOCUMENTO DE TRABAJO N.º 2105

 this paper.2 Finally, we propose a novel approach to translate the statistical performance
 into actual economic impact of using this type of models in credit default prediction.
penalized logistic regression, Classification And Regression Tree (CART), Random Forest,
 XGBoost and Deep Neural Networks. As a result, we will compute, firstly, the benefits in
 terms of statistical performance of using ML models from a micro-prudential perspective.
 penalized
 Evaluatinglogistic regression, Classification
 the macro-prudential effects fromAnd
 theRegression
 use of ML Tree (CART),
 models is outRandom Forest,
 of the scope of
 XGBoost
 this paper.and
 2 Deep we
 Finally, Neural Networks.
 propose a novelAsapproach
 a result, to
 wetranslate
 will compute, firstly, the
 the statistical benefits in
 performance
 terms of statistical
 into actual economic performance
 impact ofofusing
 usingthis
 ML type
 modelsof from
 modelsa micro-prudential
 in credit defaultperspective.
 prediction.
 Evaluating
 Assuming thethe macro-prudential
 Basel formulas foreffects from the use
 risk-weighted of ML
 assets andmodels
 capitalisrequirements
 out of the scope of
 in the
 this paper.
 Internal
 2
 Finally, we propose
 Ratings-Based a novel approach
 (IRB) approach to translateas
 for retail exposures, theit statistical
 is in our performance
 dataset, we
 into actual
 compute theeconomic
 savings inimpact
 terms ofofregulatory
 using thiscapital
 type which
 of models
 couldinbecredit default
 achieved prediction.
 by using more
 Assuming the Basel formulas for risk-weighted assets and capital requirements
 advanced techniques, in particular XGBoost as the most efficient model in this study, in the
 Internal
 compared Ratings-Based
 to a benchmark(IRB) approachused
 extensively for in
 retail
 the exposures, as it is such
 industry nowadays, in ourasdataset,
 Lasso. we
 compute the savings in terms of regulatory capital which could be achieved by using more
 The fact that we observe potentially significant capital savings due to a better statistical
 advanced techniques, in particular XGBoost as the most efficient model in this study,
 performance of advanced ML tools leads us to conclude that further research is needed in
 compared to a benchmark extensively used in the industry nowadays, such as Lasso.
 the area of supervisory risks in model evaluation. There seems to be an optimal decision to
 Thetaken
 be fact on
 thatmodel
 we observe potentially
 selection, which willsignificant
 not dependcapital savings
 only on due to aperformance,
 the predictive better statistical
 but
 performance
 also of advanced
 on the implicit ML tools to
 costs observed leads
 get us
 thetoapproval
 conclude thatthe
 from further research
 supervisor dueistoneeded in
 the risks
 the area of supervisory
 embedded risks in model
 in the implementation evaluation.
 of this There seems to be an optimal decision to
 technology.
 be taken on model selection, which will not depend only on the predictive performance, but
 The paper is organized as follows. Section 2 provides a literature review on the use of ML
 also on the implicit costs observed to get the approval from the supervisor due to the risks
 models for credit default prediction. Section 3 explains the data and the models used in the
 embedded in the implementation of this technology.
 analysis. Section 4 contains the comparison of the predictive power, in terms of
 The paper is organized
 classification as follows.
 and calibration, Section
 for the 2 provides
 six chosen a literature
 ML models. In review
 sectionon5 the
 we use
 showof ML
 the
 models
 economic forimpact
 credit default
 of usingprediction.
 XGBoost Section 3 explains
 for calculating the the data and the
 risk-weighted models
 assets andused in the
 regulatory
 analysis. Section 4 Section
 capital requirements. contains6 concludes.
 the comparison of the predictive power, in terms of
 classification and calibration, for the six chosen ML models. In section 5 we show the
 2. Literature
 economic impactreview
 of using XGBoost for calculating the risk-weighted assets and regulatory
 There
 capitalisrequirements.
 an extensive Section
 empirical6 literature
 concludes. on the use of ML models for default prediction in
 credit risk. We have methodically reviewed it in order to find those papers that compare the
 2. Literature review
 predictive power of ML models with the predictive power of a logistic regression (Logit) for
 There
 defaultisprediction
 an extensive empirical
 of loans. Theseliterature on the
 loans could be use ofmortgages,
 either ML modelscorporate
 for defaultloans,
 prediction in
 or retail
 credit risk. We
 exposures. Wehave
 can methodically
 separate the reviewed
 literature itinindifferent
 order tostrands,
 find those papers that
 depending on compare the
 the main ML
 predictive power
 method used. Weofconsider
 ML models with that
 papers the predictive powermethods
 use tree based of a logistic regression
 (either (Logit)and
 classification for
 default prediction
 regression ofensembles
 trees or loans. These loans
 like couldforest,
 random be either mortgages,
 boosting corporate
 or XGBoost), loans,
 neural or retail
 networks
 exposures. We can
 methods (either separate
 deep the literature
 neural networks in different strands,
 or convolutional depending and
 neural networks), on the main that
 papers ML
 method
 compareused. Wemethods.
 several considerAmong
 papers the
 thatpapers
 use tree
 thatbased methods
 use mainly tree(either
 basedclassification
 methods, one and
 of
 2
 Any policy decision should take into account the potential positive impact of using ML and big-data on financial inclusion
 regression trees
 (see Barruetabeña
 the first attempts or
 2020, ensembles
 Huang
 was like
 et al 2020),
 Khandiani et random
 as well forest,
 as the possibility
 al (2010), who of boosting theorperformance
 XGBoost),
 having negative
 tested neural
 side effects on networks
 social discrimination
 of classification
 (Bazarbash 2019, Jagtiani and Lemieux, 2019) due to the better classification performance of ML models (Fuster et al, 2020).
 and regression trees for predicting credit card delinquencies using data from a bank´s
 customer
 2
 base should
 Any policy decision fromtake2005 to 2009.
 into account Butaru
 the potential et al
 positive (2016)
 impact also
 of using focused
 ML and big-data on creditinclusion
 on financial card
 (see Barruetabeña 2020, Huang et al 2020), as well as the possibility of having negative side effects on social discrimination
 delinquencies
 (Bazarbash prediction,
 2019, Jagtiani using
 and Lemieux, a large
 2019) due to dataset collectedperformance
 the better classification by a US financial regulator
 of ML models over
 (Fuster et al, a
 2020).

 period of 6 years. They found that random forests can have gains of 6% with respect to
BANCO DE ESPAÑA 8 DOCUMENTO DE TRABAJO N.º 2105

 Logit in terms of recall. Other papers have used ensemble tree based methods to predict
 corporate loans default. Petropoulos et al (2019), collected data on corporate and SME
the first attempts was Khandiani et al (2010), who tested the performance of classification
 and regression trees for predicting credit card delinquencies using data from a bank´s
 customer base from 2005 to 2009. Butaru et al (2016) also focused on credit card
 delinquencies prediction, using a large dataset collected by a US financial regulator over a
 period of 6 years. They found that random forests can have gains of 6% with respect to
 Logit in terms of recall. Other papers have used ensemble tree based methods to predict
 corporate loans default. Petropoulos et al (2019), collected data on corporate and SME
 loans from Greece from 2005 to 2015, and found that random forests can have gains with
 respect to Logit of 8% in terms of AUC. Sigrist and Hirnschall (2019) used data on SME
 loans from Switzerland, and showed that a model that combines Tobit and gradient tree
 boosted can have up to 17% gains over Logit in terms of AUC. And Moscatelli et al (2019)
 used a dataset of Italian non-financial firms from 2011 to 2017, and found that ensemble
 tree methods could yield gains over Logit of 2.8% in terms of AUC. On the other hand,
 there are papers that have used mainly deep learning or convolutional neural networks to
 predict credit default. Turiel et al (2018) collected loans from Lending Club that covered the
 2007 to 2017 period, including consumer loans, corporate loans, etc. They found that deep
 learning could have gains of 12% in terms of recall over Logit. Sirigniano et al (2018)
 developed a deep learning model to predict default on a sample of 120 million mortgages
 from US between 1995 and 2014, and show that deep learning can have gains from 6%
 to 20% in terms of AUC with respect Logit, depending on the definition of default. Kvamme
 et al (2018) also collected data on mortgages, specifically more than 20,000 Norwegian
 mortgages approved from 2012 to 2016. They show that the use of convolutional neural
 networks can yield gains of 6% in terms of AUC with respect to Logit. Finally, Albanesi and
 Vamossy (2019) used a combination of deep neural network and gradient boosted trees to
 predict consumer default form the Experian credit bureau, from 2004 to 2015, and
 concluded that deep learning performs significantly better than logistic regression, with
 gains up to 5% in terms of precision. While the majority of the papers reviewed focus on
 one or few ML models we found some that compare the predictive power of an ample class
 of ML methods, highlighting Jones (2015) and Guegan and Hassani (2018). All
 aforementioned papers find that ML models outperform Logit in classification power. This
 is true regardless of the technique used and the type of underlying asset of the study.
 However, these results are very heterogeneous.
 Our contribution to this literature is that we are able to assess robustly the predictive
 performance of a wide range of ML methods under different circumstances (different
 sample sizes, and different amount of explanatory variables, as shown in Section 4) using
 a unique database on consumer loans granted by a big Spanish bank. Unlike the
 aforementioned comparisons in the literature, this allows us to test whether the statistical
 performance comes from an information advantage (associated to the access to big
 amounts of data) and/ or model advantage (associated to ML as high end technology) when
 9 DOCUMENTO DE TRABAJO N.º 2105
 comparing these innovative tools to traditional quantitative models, as suggested by Huang
BANCO DE ESPAÑA

 et al (2020). We find that there exists a model advantage on top of information advantage.
 Our results are in line with Huang et al (2020), who use a dataset from the Fintech industry
aforementioned comparisons in the literature, this allows us to test whether the statistical
 performance comes from an information advantage (associated to the access to big
 Our contribution to this literature is that we are able to assess robustly the predictive
 amounts of data) and/ or model advantage (associated to ML as high end technology) when
 performance of a wide range of ML methods under different circumstances (different
 comparing these innovative tools to traditional quantitative models, as suggested by Huang
 sample sizes, and different amount of explanatory variables, as shown in Section 4) using
 et al (2020). We find that there exists a model advantage on top of information advantage.
 a unique database on consumer loans granted by a big Spanish bank. Unlike the
 Our results are in line with Huang4 et al (2020), who use a dataset from the Fintech industry
 aforementioned
 a baseline scenario, comparisons
 using Lasso in the literature,
 , against this allows
 a scenario us to
 in which thetest whether
 banking the statistical
 institution would
 in China, but we have used a different approach. They computed the information advantage
 performance
 have chosen to comes from aan
 implement moreinformation advantage
 statistically (associated
 efficient model, to the access
 like XGBoost. We show tothat
 big
 by discretionally dividing the features into two sets: traditional vs innovative explanatory
 amounts
 the latter ofscenario
 data) and/canoryield
 model advantage
 savings from(associated
 12.4% to 17% to MLinasterms
 high end technology)capital
 of regulatory when
 variables. This way they observed the performance of ML models under both datasets.
 comparing
 requirements these
 underinnovative
 an IRB tools to traditional
 approach, quantitative
 depending models, as suggested
 on the corresponding by Huang
 risk components
 They found that, within each model, using all the available variables yields better
 et al (2020).
 in the Basel We find that
 formulae there exists
 associated a model
 to our type ofadvantage
 exposureon or top of information
 underlying assets.advantage.
 This is, to
 performance, concluding that this is an indication of the existence of information advantage.
 Our results
 the best are knowledge,
 of our in line with Huang
 the firstetattempt
 al (2020), who use a
 to measure thedataset
 impactfrom the Fintech
 of using industry
 ML methods in
 In our case, instead of discretionary separating the sample into two, we have measured the
 in China,
 terms of but we havecapital
 regulatory used asavings.
 differentThis
 approach.
 impactTheycould computed the information
 be interpreted as a flooradvantage
 amount,
 performance of ML models under both dimensions of the information space MxN, where
 by discretionally
 since it does notdividing
 accounttheforfeatures into two
 the potential sets:oftraditional
 benefit using the vs innovative
 model for new explanatory
 business
 M represents the number of observations (length) and N the number of features (width). In
 variables.
 originated.This way theywhile
 In contrast, observed the performance
 conservative, of MLamount
 this estimated models couldunderbe both datasets.
 immediately
 particular we perform simulations with a random selection of features and sample sizes.
 They found by
 materialized that, within institution,
 the credit each model, using all the exercise
 complementing availablethatvariables
 might beyields better
 additionally
 This allows us to add statistical robustness to the conclusion that a model advantage exists
 performance, concluding
 carried out through that this isofan
 the estimation theindication
 VA. of the existence of information advantage.
 on top of information advantage, capturing a broader concept of information advantage
 In our case, instead of discretionary separating the sample into two, we have measured the
 (and therefore, a finer model advantage definition) when compared to Huang et al (2020).
 performance of ML models under both dimensions of the information space MxN, where
 M
 3. represents
 We Data
 also the number
 collection
 contribute and
 to the of ML
 observations
 models
 literature (length)
 by assessing theand N the number
 economic impact of features
 using ML(width). In
 for credit
 particular
 default we perform
 prediction.
 An anonymized simulations
 Khandani
 database et al
 from withSantander
 (2010)
 Banco aand
 random selection
 Albanesi
 has of features
 and Vamossy
 been used and computed
 (2019)
 to conduct sample sizes.
 the
 this analysis.
 This
 Valueallows
 Added
 It contains us(VA)
 tofrom
 data add statistical
 as athe ofrobustness
 net savings
 subset to theofconclusion
 to lenders
 consumer credits,granting that
 thealines
 grantedcredit
 by model advantage
 to borrowers
 aforementioned exists
 based
 bank in
 on top (better)
 the of information
 unspecified dates. Thisadvantage,
 predictions of has
 data capturing
 ML been
 models. a broader
 This and concept
 method,
 completely of anonymized
 information
 while useful,
 previously advantage
 has its drawbacks.
 by Banco
 (and
 First, therefore,
 it is limited
 Santander atofiner
 through model
 thean advantage
 assessment MLdefinition)
 of dissociation
 irreversible when compared
 for credit scoring,
 process while we to
 in origin Huang
 aim et al (2020).
 to evaluate
 which preventsmodels
 the
 in more areas
 possibility susceptible
 of identifying to implement
 costumers in anythisway.technology
 The dataset in the banking
 contains industry. from
 information Second,moreit
 We also contribute to the literature by assessing the economic impact of using ML for credit
 might be considered
 than 75,000 backwardwhich
 credit operations looking havemetric,
 beenasclassified
 it is estimated
 into two using a randomly
 groups, chosen
 depending on
 default prediction. Khandani et al (2010) and Albanesi and Vamossy (2019) computed the
 subset
 whetherofthey the resulted
 loans or on credit linesorofnot.
 default the Additionally,
 outstanding each portfolio, assuming
 operation has athat some ofofthem
 maximum 370
 Value Added (VA) as the net savings to lenders of granting credit lines to borrowers based
 could be granted
 risk factors (features)or associated
 cut retrospectively
 to it, whose
 3
 . We, instead,
 labels propose have
 or description to monetize
 not beenthe impact
 provided.
 on the (better) predictions of ML models. This method, while useful, has its drawbacks.
 Consequently,
 through the natureofofcalculated
 the comparison these variables is unknown
 risk-weighted to us,
 assets andand theyrequirements
 capital cannot be used to
 under
 First, it is limited to the assessment of ML for credit scoring, while we aim to evaluate models
 aestablish
 baselinethe identityusing
 scenario, of the customers
 Lasso 4
 , against they refer to. inOut
 a scenario of 370
 which features,institution
 the banking 105 are binary
 would
 in more areas susceptible to implement this technology in the banking industry. Second, it
 variables
 have (onlytotwo
 chosen different avalues),
 implement 99 have 3 to
 more statistically 5 different
 efficient values,
 model, like 34 have 6 to
 XGBoost. We10show
 different
 that
 might be considered backward looking metric, as it is estimated using a randomly chosen
 values,
 the and
 latter 132 have
 scenario can more
 yieldthan 10 values
 savings from5. 12.4%
 Around to 3.95%
 17%ofinthe loans
 terms ofresulted in default,
 regulatory capital
 subset
 3
 of the
 See section loans
 5.1 for or credit
 an explanation lines
 of this of the outstanding portfolio, assuming that some of them
 method.
 but the data has
 requirements underno an
 temporal dimension,
 IRB approach, so we doon
 depending notthe
 know when the loan
 corresponding riskwas granted,
 components
 could be granted or cut retrospectively3. We, instead, propose to monetize the impact
 and
 in theif resulted in default,
 Basel formulae when it happened.
 associated to our type 6
 of exposure or underlying assets. This is, to
 through the comparison of calculated risk-weighted assets and capital requirements under
 the best of our knowledge, the first attempt to measure the impact of using ML methods in
 As mentioned in the introduction, we will firstly compare the predictive performance of Logit
 terms of regulatory capital savings. This impact could be interpreted as a floor amount,
 vs several ML models. In particular, we have chosen Lasso penalized logistic regression,
 since it does not account for the potential benefit of using the model for new business
 3
 See section 5.1 for an explanation of this method.
 originated.
 4 In contrast, while conservative, this estimated amount could be immediately
 Although in the literature review the comparison in the evaluation has been performed using Logit as benchmark, we assume
 for this exercise that currently the use of a logistic penalized regression with Lasso is common practice in the banking industry.
 materialized
 5 by the credit institution, complementing the exercise that might be additionally
 Since there are a considerable number of binary variables in our sample, we have performed robustness exercises by
 removing binary variables with low variance (binary variables which have the same value 80% of the times) and by creating
 carried
BANCO DE ESPAÑA
 out through
 10 DOCUMENTO
 additional dummy variables
 DE TRABAJO
 the estimation of the VA.
 to account for the binary variables. The main results do not change significantly when performing
 N.º 2105

 these transformations.
 6
 Therefore, we will focus on the estimation of probabilities of defaults point-in-time, leaving out of the scope of this work any
 assessment on the impact of macroeconomic variables that could explain observed defaults through-the-cycle.
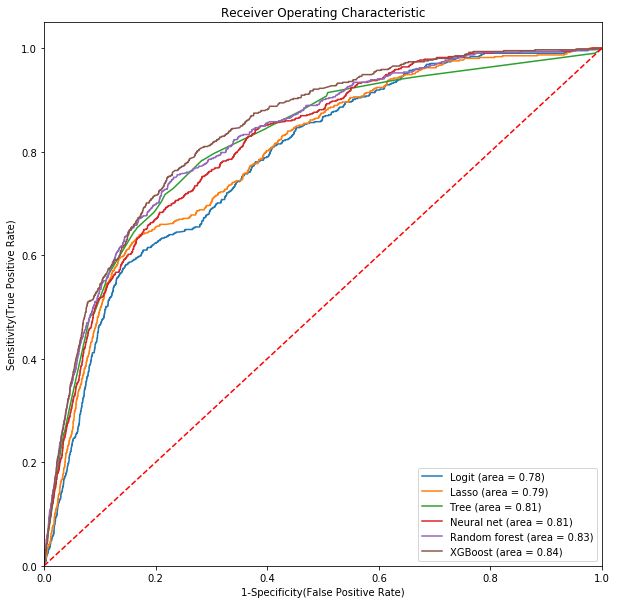
the best of our knowledge, the first attempt to measure the impact of using ML methods in
 a baseline scenario, using Lasso4, against a scenario in which the banking institution would
 terms of regulatory capital savings. This impact could be interpreted as a floor amount,
 have
 a chosen
 baseline to implement
 scenario, a more
 using Lasso 4 statistically efficient model, like XGBoost. We show that
 since it does not account for the, against a scenario
 potential benefit ofin using
 which the
 the model
 bankingfor
 institution would
 new business
 the latter
 have scenario
 chosen can yield savings from 12.4% to model,
 17% inlike
 terms of regulatory capital
 originated. In tocontrast,
 implement a more
 while statistically
 conservative, efficient
 this estimated amount XGBoost.
 could beWe show that
 immediately
 requirements undercan
 the latter scenario an IRB
 yieldapproach, depending
 12.4% on
 savingscomplementing
 from the
 tothe17%corresponding
 in terms risk components
 of regulatory capital
 materialized by the credit institution, exercise that might be additionally
 in the Basel formulae
 requirements anassociated
 under the to ourdepending
 IRB approach, type of exposure or underlying assets.
 on the corresponding This is, to
 risk components
 carried out through estimation of the VA.
 the best
 in the of our
 Basel knowledge,
 formulae the firsttoattempt
 associated our typeto of
 measure theor
 exposure impact of using
 underlying ML methods
 assets. in
 This is, to
 terms of of
 best regulatory
 ourand
 Classification
 the capital the
 Regression
 knowledge, savings.
 Trees This impact
 first attempt couldForest,
 toRandom
 (CART), measure be impact
 the interpreted
 XGBoost asand
 of usingaMLfloor
 Deep amount,
 Neural
 methods in
 since itofdoes
 Networks
 terms 7 not account
 because
 regulatory they arefor
 capital the potential
 amongst
 savings. benefit
 the most
 This cited
 impact of using
 ones
 could theliterature
 the modelasfor
 beininterpreted a new
 floor8 business
 review. We have
 amount,
 3. Data collection and ML models
 originated.
 conducted
 since In not
 our
 it does contrast,
 analysis while
 using
 account conservative,
 forPython
 the and open
 potential this estimated
 source
 benefit usingamount
 libraries
 of been the couldforbe
 Sklearn
 likemodel and
 newimmediately
 Keras. The
 An anonymized database from Banco Santander has used to conduct this business
 analysis.
 materialized by
 hyper-parameters
 originated. the credit
 have
 In contrast, institution,
 been chosen complementing
 according
 while conservative, to the exercise
 standard
 this estimated that might
 cross-validation be additionally
 techniques,
 It contains data from a subset of consumer credits, granted amount could be immediately
 by the aforementioned bank in
 carried
 as the out
 materializedthrough the
 ourestimation
 by theofcredit
 purpose exercise ofiscomplementing
 institution, the VA. featuretheengineering
 neither exercise nor
 that optimization,
 might but
 be additionally
 unspecified dates. This data has been completely and previously anonymized by Banco
 comparing betweenthe
 carried out through correctly calibrated models. We have divided our data into training
 Santander through an estimation
 irreversibleof dissociation
 the VA. process in origin which prevents the
 (80%) and test (20%) set, and we have used a five-fold cross-validation on the training set
 possibility of identifying costumers in any way. The dataset contains information from more
 3. choose
 to Data the
 collection and ML that
 hyper parameters modelsmaximizes the out-of-sample AUC9. As it is common
 than 75,000 credit operations which have been classified into two groups, depending on
 Anthe
 in
 3. literature,
 Data input
 collection
 anonymized values
 and
 database have
 MLBanco
 from models hasby
 standardized
 beenSantander removing
 been used to mean and
 theconduct thisscaling to
 analysis.
 whether they resulted on default or not. Additionally, each operation has a maximum of 370
 unit
 An variance
 It contains 10
 data . from a subset
 fromofBanco
 consumer credits,has
 granted
 been by thetoaforementioned bank in
 riskanonymized database
 factors (features) associated Santander
 to it, whose used
 labels or description haveconduct thisprovided.
 not been analysis.
 unspecified
 It dates.
 contains data fromThis data has
 a subset been completely
 of consumer and previously anonymized by bank
 Banco
 Consequently, the nature of these variables credits, granted
 is unknown by and
 to us, the aforementioned
 they cannot be used in
 to
 Santander through
 unspecified an data
 irreversible dissociation process in originanonymized
 which prevents the
 establish thedates. This
 identity has been
 of the customers completely
 they refer to.and
 Outpreviously
 of 370 features, by Banco
 105 are binary
 4. Predictive
 possibility
 Santander performance
 ofthrough
 identifying
 ancostumers in any way. Theprocess
 irreversible dataset contains information from more
 variables (only two different values), 99dissociation in origin
 have 3 to 5 different values, which6 to
 34 have prevents the
 10 different
 than
 To 75,000
 assess
 possibility credit operations
 predictive
 theidentifying which any
 performance of the
 have 5been models
 MLclassified
 6 The twofocus
 intowill
 we on two
 groups, measures:
 depending on
 values, andof132 costumers
 have more than 10invaluesway.
 . Arounddataset
 3.95%contains information
 of the loans resultedfrom more
 in default,
 whether and
 they credit
 classification
 than 75,000 calibration.
 resulted Classification
 on default or not. means
 Additionally, the
 each intoof
 ability
 operation model
 the has to discriminate
 a maximum of 370
 but the data has nooperations which
 temporal dimension,have sobeen classified
 we do not know two
 when groups,
 the loandepending on
 was granted,
 defaulted
 risk factors
 whether loans
 they (features)
 resulted those
 from associated
 on defaultthat have to not. been
 it, whose repaid,
 labels or being able to classify
 description have
 has not different
 beeninprovided.
 them
 and if resulted in default, when itor happened. Additionally,
 6 each operation a maximum of 370
 risk buckets.
 Consequently, We
 factors (features) the use
 willnature of AUC-ROC
 the
 associated thesetovariables or Area
 it, whose islabelsUnder
 unknown or the toCurve
 us, and
 description theyReceiving
 the
 ofhave cannot
 not beenbe Operating
 used to
 provided.
 As mentioned in the introduction, we
 in order will
 to firstly
 measure compare theOutthe predictive
 discriminatory performance
 power (BIS, of Logit
 2005).
 Characteristic
 establish the identity
 Consequently, (Fawcett,
 the nature of 2005)
 the
 of customers
 these variablesthey isrefer to.
 unknown to of
 us,370 andfeatures,
 they cannot 105 are
 be usedbinary 11
 to
 vs several MLhand, models. In particular, we have chosen Lasso
 the of penalizedoflogistic
 estimation the6105 regression,
 probability by
 On the other
 variables
 establish (only
 the identity calibration
 two differentof thevalues), refers
 customers 99to havethe3quality
 they refer to.ofOut
 to 5 different values, 34 have
 370 features, to 10 different
 are binary
 Classification
 looking,
 values, and per andhave
 bucket,
 132 Regression
 atmore good
 how values),
 than Trees
 the99
 10 (CART),
 average
 values Random Forest,
 estimated probability XGBoost
 fitshave and Deep default
 observed
 theresulted Neural
 have. 3Around 3.95% of the loans 6 to 10indifferent
 default,
 5
 variables (only two different to 5 different values, 34
 4
 Although in the
 Networks 7 literature review the comparison in the evaluation has been performed using Logit as benchmark,
 because they are amongst the most cited ones in the literature review. 8 we assume
 We have
 rate.
 butthisthe
 values,
 for Toand this
 data
 exercise purpose
 has
 132
 that have
 currently weuse
 no temporal
 more
 the will ause
 ofthan 10the
 dimension,
 logistic Brier
 values
 penalized 5 score
 so we do
 . Around
 regression (BIS,
 not 2005)
 3.95%
 with know
 Lasso isof themeasure
 to
 when
 common loans
 practice inhow
 the resulted
 loan thewasprecise
 ingranted,
 banking the
 default,
 industry.
 5
 Since
 conducted there are a considerable
 our analysis number
 using of binary
 Python and variables
 open in our sample, we
 source libraries have performed
 like curves, robustness
 Sklearninand exercises
 Keras. Theby
 estimations
 and
 but the
 removing dataare,
 if resulted
 binary has in along
 variablesdefault,
 nowith with
 temporal
 low calibration
 when
 variance it(binary
 happened.
 dimension, plots, 6
 weparticular
 in
 so which
 variables do
 havenot reliability
 the know
 same when
 value 80%the loan
 of the which
 was
 times) bywe
 and granted, will
 creating
 additional dummy variables
 hyper-parameters to account
 have been forchosen
 the binary variables. The main results do notcross-validation
 change significantly when performing
 divide
 and
 these if the predictions
 resulted
 transformations. in default,into groups,
 when it and according
 happened. for each 6
 to we
 one standard
 will compare precisely the techniques,
 average
 As
 6 mentioned
 Therefore, in theonintroduction,
 we will focus of we will firstly compare the predictive performance
 scope of thisof Logit
 as the purpose of theour estimation
 exercise
 of default
 probabilities
 withis the
 neither of defaults point-in-time,
 feature
 corresponding
 leaving outnor
 engineering
 observed
 of theoptimization,
 default
 work
 rate. For both
 any
 but
 assessment onprobability
 estimated the impact of macroeconomic variables that could explain observed defaults through-the-cycle.
 vs
 As several
 mentioned ML in models. In particular,
 the introduction, we firstly
 we will have comparechosen Lasso penalizedperformance
 the predictive logistic regression,
 comparing between correctly calibrated models. We have divided our data into of Logit
 training
 measures, we perform a sensitivity analysis in the two dimensions of the information space
 vs several
 (80%) and ML test models.
 (20%) set, In and
 particular,
 we have weusedhaveachosen five-foldLasso penalized logistic
 cross-validation on the regression,
 training set
 (MxN), simulating the impact in the AUC-ROC and Brier score of the models for different
 4 Although in the literature review the comparison in the evaluation has been performed using Logit as benchmark, we assume

 to choose
 for this exercise the
 that hyper
 currently parameters that maximizes thewith
 out-of-sample (N). AUC
 practice. inAs
 9
 theitbanking
 is common
 sample
 5
 sizes (M), andthe forusedifferent
 of a logistic penalized
 number regression
 of available Lasso is common
 features industry.
 4 Since there are a considerable number of binary variables in our sample, we have performed robustness exercises by
 Although in the literature review the comparison in the evaluation has been performed using Logit as benchmark, we assume
 in
 for the
 removing literature,
 binarythat
 this exercise input
 variables
 currently values
 withthe lowuse of have
 variance been
 (binary
 a logistic standardized
 variables
 penalized which have
 regression withby
 the removing
 same
 Lasso value 80%
 is common the ofmean
 the in
 practice and
 times)
 the andscaling to
 by industry.
 banking creating
 additional
 5 dummy
 Since there variables
 are a to account
 considerable for the
 number binary variables
 of binary variables. in
 The main
 our resultswe
 sample, dohave
 not change significantly
 performed robustnesswhen performing
 exercises by
 unit
 these variance 10
 .
 transformations.
 removing binary variables with low variance (binary variables which have the same value 80% of the times) and by creating
 6
 Therefore,
 additional we willvariables
 dummy focus ontothe estimation
 account of probabilities
 for the of defaults
 binary variables. The mainpoint-in-time, leaving
 results do not out significantly
 change of the scopewhen
 of thisperforming
 work any
 assessment on the impact of macroeconomic variables that could explain observed defaults through-the-cycle.
 these transformations.
 6 Our benchmark Neural Network has 5 layers, with 3 hidden units of 300, 200 and 100 neurons. We have selected this
 7
 Therefore, we will focus on the estimation of probabilities of defaults point-in-time, leaving out of the scope of this work any
 assessment after
 architecture on theimplementing
 impact of macroeconomic variables thatand
 the proper cross-validation hyper
 could parameter
 explain tuning.
 observed Our main
 defaults results are not significantly
 through-the-cycle.
 affected by choosing other variations of Neural Networks.
 4.
 8 Predictive
 For an introduction intoperformance
 the functioning of each model, please see WB (2019).
 9
 Among the hyper parameters, we have chosen the depth of trees for CART and the number of trees and depth of trees
 To assessForest
 for Random the and predictive
 XGBoost. For performance
 neural networks,ofwe the
 use6Talos
 ML to models
 choose theweoptimal
 will focus
 numberon two measures:
 of hidden layers,
BANCO DE ESPAÑA 11 DOCUMENTO
 nodes, activation functions and optimizers.
 DE TRABAJO N.º 2105

 classification and calibration. Classification means the ability of the model to discriminate
 10 Our results do not change ostensibly if we use input values without standardization, but standardizing them helps to

 reduce computing time, especially in the case of deep neural networks.
 defaulted loans from those that have been repaid, being able to classify them in different
 11 There are other metrics that evaluate the performance of a classifier, like F1, Gini index, recall, precision and accuracy. We

 choose AUC because is the most used metric across the papers we reviewed and one of the most popular metrics in the
comparing between correctly calibrated models. We have divided our data into training
 (80%) and test (20%) set, and we have used a five-fold cross-validation on the training set
 to choose the hyper parameters that maximizes the out-of-sample AUC9. As it is common
 Classification
 in the literature, and Regression
 input values have Treesbeen(CART), RandombyForest,
 standardized removing XGBoost
 the mean andand Deep Neural
 scaling to
 The reason why we have decided to use these two measures to pursue the evaluation of
 Networks
 unit
 7
 variance because
 10
 . they are amongst the most cited ones in the literature review. We have 8

 the performance of the ML models is that they are explicitly mentioned in the supervisory
 conducted
 Classification ourand
 analysis using Python
 Regression and openRandom
 Trees (CART), source libraries like Sklearn
 Forest, XGBoost andand Keras.
 Deep The
 Neural
 process for the validation of IRB systems, which we find to be the most complete framework
 hyper-parameters
 Networks7 becausehave they been chosen the
 are amongst according
 most cited to standard
 ones in the cross-validation
 literature review. techniques,
 8
 We have
 to understand the potential and limitations of these predictive models when applied in
 as the
 conducted
 4. purpose
 Predictive of ourusing
 our analysis
 performance exercise
 Pythonis and neither
 openfeature engineering
 source libraries nor optimization,
 like Sklearn and Keras. The but
 particular to regulatory capital calculation, and generally to credit risk management (Alonso
 comparing
 hyper-parameters
 To assess the between have
 predictivecorrectly
 been calibrated
 chosen
 performance models.
 6 MLtoWe
 according
 of the havewedivided
 standard
 models our ondata
 cross-validation
 will focus twointo training
 techniques,
 measures:
 and Carbó, 2020). In this sense, for a supervisor there are two separated phases when
 (80%)
 as theand test
 purpose
 classification and(20%)
 of set, exercise
 our
 calibration.andClassification
 we have usedmeans
 is neither a feature
 five-fold cross-validation
 the engineering
 ability of the nor on
 model the training but
 optimization,
 to discriminate set
 evaluating the adequacy of an IRB system. First, a supervisor should carry out an
 to chooseloans
 comparing
 defaulted the hyper
 fromparameters
 between correctly that maximizes
 those thatcalibrated
 have beenmodels.
 repaid, the
 We out-of-sample
 have
 being abledivided AUC
 our9.data
 to classify As itinto
 them isincommon
 training
 different
 assessment of the design of the rating system. In the calculation of regulatory capital,
 in the
 (80%)
 risk literature,
 and test
 buckets. input
 We(20%) values
 set,the
 will use and have
 we been
 AUC-ROC have or standardized
 used
 Area Underby
 a five-fold the removing
 Curve of the the mean
 cross-validation on the
 Receivingandtraining
 scalingset
 Operating to
 institutions have to estimate several risk factors, like the Probability of Default (PD), Loss-
 unit variance
 to choose
 Characteristic the .(Fawcett,
 10
 hyper parameters
 2005) in thatordermaximizes
 to measure thethe
 out-of-sample
 discriminatory AUC 9
 . As (BIS,
 power it is common
 2005).11
 Given-Default (LGD), or even credit conversion factors or maturity adjustments. As a general
 in the
 On theliterature,
 other hand,inputcalibration
 values have beentostandardized
 refers the quality ofbythe removing
 estimationthe of
 meanthe and scaling by
 probability to
 rule, institutions have to provide their own estimates of PD and rely on standard values for
 unit variance
 looking,
 10
 .
 per bucket, at how good the average estimated probability fits the observed default
 other risk components. In this paper we will assume this is the case.12 In this sense, the
 4. Predictive performance
 rate. To this purpose we will use the Brier score (BIS, 2005) to measure how precise the
 estimation of the PD is a two-folded task. First, institutions are required to identify the risk
 To assess the
 estimations predictive
 are, along with performance
 calibration of the 6in ML
 plots, modelsreliability
 particular we will focus
 curves,onintwowhich measures:
 we will
 in different buckets, discriminating those exposures which are riskier from the rest.
 4. Predictive
 classification
 divide and performance
 the predictions calibration. Classification
 into groups, and for eachmeans onethewe ability of the model
 will compare preciselyto discriminate
 the average
 Secondly, the risk must be quantified. To this purpose, the buckets must be well calibrated,
 defaulted loans
 To assess probability
 estimated from
 the predictive those that
 of performance have
 default with the been
 of the repaid, being
 6 ML modelsobserved
 corresponding able to classify
 we will focus them
 on two
 default rate.in different
 measures:
 For both
 resembling the observed default rate. Once the risk factors are estimated, they will be
 risk buckets.
 classification
 measures, weWe
 and will
 perform usea the
 calibration. AUC-ROC
 Classification
 sensitivity or Area
 analysis means
 in Under
 the thethe
 two Curve
 ability
 dimensions of of
 thethe
 of Receiving
 model
 the Operating
 to discriminate
 information space
 plugged into an economic model as inputs in order to compute the (un)expected losses,11
 Characteristic
 defaulted loans(Fawcett,
 (MxN), simulating from
 the those 2005)
 impact ininthe
 that order
 have to measure
 been
 AUC-ROC andthe
 repaid, being
 Brierdiscriminatory thepower
 able toofclassify
 score them
 models (BIS,
 for 2005).
 in different
 different
 which in the case of minimum capital requirements, comes from the Basel framework.
 On
 risk the
 sample other
 buckets.
 sizes Wehand,
 (M), will
 and calibration
 useforthe refers
 AUC-ROC
 different toorthe
 number ofquality
 Area Under
 available ofthe
 theCurve
 estimation
 features of the of
 (N). the probability
 Receiving Operating by
 In sum, to
 looking, understand
 per bucket, the benefits of ML tomodels applieddiscriminatory
 to estimating
 fitsPDs, it is not 2005).
 enough
 Characteristic we at
 (Fawcett,how good
 2005) in the
 toaverage
 order estimated
 measure twothe probability the the
 observed
 power (BIS, default
 11
 The reason why have decided use these measures to pursue evaluation of
 to evaluate
 rate. thisthe
 Toother models
 purpose wein will
 termsuseofthe
 discriminatory power, but we mustofget a grasp as well
 On
 the the
 performance hand, calibration
 of the ML modelsrefersis Brier
 to
 that score
 thethey (BIS,
 quality
 are 2005)
 of the to measure
 estimation
 explicitly mentioned how
 the
 in the precise
 probability the
 by
 supervisory
 on the calibration
 estimations
 looking, are, performance.
 along with Once
 calibration this work
 plots, in is done, supervisors
 particular reliability willthe
 curves, getobserved
 deeper
 in which into
 we thewill
 process per
 7
 bucket,
 for the at how
 validation of good
 IRB the average
 systems, which estimated
 we find to probability
 be the most fits complete default
 framework
 Our benchmark Neural Network has 5 layers, with 3 hidden units of 300, 200 and 100 neurons. We have selected this
 ratingTo
 divide
 rate. process,
 thethis
 architecture after which into
 predictions
 purpose
 implementing usually
 we will
 the properincludes
 groups,
 use the an
 forinvestigation
 andBrier
 cross-validationeach
 score
 and one(BIS, on
 willthe
 wepredictive
 2005) data
 compare
 to sources,
 measureprecisely
 how privacy
 arethe of the
 average
 precise the
 to understand the potential and limitations
 affected by choosing other variations of Neural Networks.
 ofhyper parameter
 these tuning. Our main
 models results
 when not significantly
 applied in
 information
 estimated and quality ofdefault
 the ofdata sets, technological infrastructure required toForput the
 estimations toprobability
 are, along of
 with with
 calibration the corresponding
 plots, insee
 particular observed
 toreliability default
 curves, inrate.
 which webothwill
 8
 For an introduction into the functioning each model, please WB (2019).
 particular
 9 regulatory capital calculation, and generally credit risk management
 Among the hyper parameters, we have chosen the depth of trees for CART and the number of trees and depth of trees
 (Alonso
 model
 measures,
 for Random
 divide into
 the production,
 we
 Forest perform
 and XGBoost.
 predictions aand
 For its governance,
 sensitivity
 neural analysis
 networks, all
 weeach
 use subject
 in the
 Talostwo
 to weto
 choose the
 dimensions
 theuse that
 optimal of each
 the
 number of institution
 information
 hidden layers,gives
 space
 and Carbó, 2020). In into
 this groups,
 sense,
 nodes, activation functions and optimizers.
 and
 for a for
 supervisor one there willarecompare precisely
 two separated the
 phases average
 when
 internally
 (MxN), to these
 simulating models.
 the impact of inanthe AUC-ROC and
 First,Brier score of the models forFor
 different
 10 Our results do not change ostensibly if we use input values without standardization, but standardizing them helps to
 estimated
 evaluating probability
 the adequacy of default with
 IRB the corresponding
 system. observed
 a supervisor default
 should rate.
 carry outbothan
 reduce computing time, especially in the case of deep neural networks.
 sample
 assessment sizes (M), theand for different
 of the number
 a sensitivity
 design analysis
 rating ofinavailable
 system.the two features
 dimensions
 In the (N).of the
 11 There are other metrics that evaluate the performance of a classifier, like F1, Gini index, recall, precision and accuracy. We
 measures, weof perform calculation informationcapital,
 of regulatory space
 choose AUC because is the most used metric across the papers we reviewed and one of the most popular metrics in the
 4.1.
 (MxN), Classification
 literature (Dastile
 institutions
 et al, 2020). We
 simulating
 have tothe
 will additionally
 impact
 estimate in the use
 several
 recall as a robustness
 AUC-ROC
 risk factors,and
 check.
 likeBrier score of the
 the Probability of models
 Default for different
 (PD), Loss-
 In this section
 sample we and
 sizes (M),
 Given-Default useorfor
 (LGD), the AUC-ROC
 different
 even to study
 creditnumber the discriminatory
 of available
 conversion factors orfeatures or classification
 maturity(N).
 adjustments. As power of
 a general
 the
 rule,selected
 7
 models.
 institutions have As
 to provide Figure
 shown intheir own 1, this curve
 estimates of plots therely
 PD and trueon
 positive ratevalues
 standard (TPR) vs
 for
 Our benchmark Neural Network has 5 layers, with 3 hidden units of 300, 200 and 100 neurons. We have selected this
 the
 other false
 architecture
 riskpositive rate (FPR)
 after implementing
 components. at different
 the proper
 In this classification
 cross-validation
 paper we thresholds.
 and hyper parameter
 will assume
 tuning. Our main results are not significantly
 this is the case.12 In this sense, the
 affected by choosing other variations of Neural Networks.
 8
 For an introduction into the functioning of each model, please see WB (2019).
 estimation
 9
 7Among of Neural
 the hyper
 Our benchmark
 the PD is we
 parameters, a two-folded
 Network have5 chosen
 has
 task.
 the
 layers, withdepth First, institutions
 of trees
 3 hidden unitsforofCART
 300, and
 are
 200 the
 required
 andnumber
 toWe
 of trees
 100 neurons.
 identify
 and depth
 have
 the
 of risk
 trees
 selected this
 for Random after
 architecture Forest and XGBoost.
 implementing theFor neural
 proper networks, we and
 cross-validation use Talos
 hyper to choose the
 parameter optimal
 tuning. Ournumber of hidden
 main results layers,
 are not significantly
 in different
 nodes,
 affected activation buckets,
 functions
 by choosing anddiscriminating
 optimizers.
 other variations those exposures which are riskier from the rest.
 of Neural Networks.
 8 Our results do not change ostensibly if we use input values without standardization, but standardizing them helps to
 10
 For an introduction into the functioning of each model, please see WB (2019).
 Secondly,
 reduce
 9
 Amongcomputingthe time,
 the hyper risk especially
 must we
 parameters, beinhave
 quantified.
 the case theTo
 of deep
 chosen this
 neural
 depth purpose,
 of networks.
 trees for CART the buckets
 and the number must beand
 of trees well calibrated,
 depth of trees
 11
 There are other metrics that evaluate the performance of a classifier, like F1, Gini index, recall,
 for Random Forest and XGBoost. For neural networks, we use Talos to choose the optimal number of hidden layers, precision and accuracy. We
 resembling
 choose
 nodes, activation the
 AUC because observed
 is theand
 functions most default
 used
 optimizers. metricrate.
 across Once
 the papersthewerisk factors
 reviewed areof estimated,
 and one the most popular they willin be
 metrics the
 literature (Dastile
 10 Our results et al,
 do not 2020).ostensibly
 change We will additionally use recall
 if we use input valuesaswithout
 a robustness check.
 standardization, but standardizing them helps to
 plugged
 12
 As further
 reduce into an
 explained
 computing time, economic
 in Section 5.1.
 especially model
 in the case ofas inputs
 deep neural in order to compute the (un)expected losses,
 networks.
 11 There are other metrics that evaluate the performance of a classifier, like F1, Gini index, recall, precision and accuracy. We

BANCO DE ESPAÑA
 which
 choose in the
 AUC
 12 DOCUMENTO
 caseis of
 because theminimum
 DE TRABAJO N.º 2105
 most used metriccapital requirements,
 across comesand
 the papers we reviewed fromone the
 of theBasel framework.
 most popular metrics in the
 literature (Dastile et al, 2020). We will additionally use recall as a robustness check.
 In sum, to understand the benefits of ML models applied to estimating PDs, it is not enough
 to evaluate the models in terms of discriminatory power, but we must get a grasp as well
You can also read