248 Royal Life Saving National Drowning Report 2020 - People drowned in Australian waterways

Page created by Maurice Bell
 
CONTINUE READING
248 Royal Life Saving National Drowning Report 2020 - People drowned in Australian waterways
248
   People drowned in
   Australian waterways

Royal Life Saving
National Drowning
Report 2020

                                 SUPPORTED BY

Research and Policy Highlights
248 Royal Life Saving National Drowning Report 2020 - People drowned in Australian waterways
CONTENTS

    4     National Drowning Report 2020 snapshot

    6     Fatal and non-fatal drowning in Australia

    7     Who drowns?

    8     Drowning deaths by life stages

    18    When do drowning deaths occur?

    20    Where and how do drowning deaths occur?

    22    Drowning deaths by key locations

    28    Fatal drowning risk factors

    30    State and Territory drowning deaths

    48    Methods

    50    2019/20 Research and policy highlights

         OUR VISION

    A water-loving nation
    free from drowning

    royallifesaving.com.au

2
248 Royal Life Saving National Drowning Report 2020 - People drowned in Australian waterways
FOREWORD

As we present the National Drowning Report for            Young lives saved
2020, we remain ever mindful of people whose              Consistently low numbers of drowning deaths in
lives have been lost or impacted by drowning,             children in recent years are encouraging, showing
including the many families affected by the loss          that our Keep Watch messages, which highlight the
                                                          importance of active adult supervision, restricting
or long-term injury of a loved one.                       access to water, water awareness and learning CPR, are
                                                          hitting home and helping to keep children safe.

This past year has been unlike any other. First, a
summer of tragic bushfires, and now the COVID-19
pandemic. While we know that bushfires changed            Swimming and water safety skills
people’s behaviours, temporarily closed access to
                                                          We are absolutely committed to the notion that all
national parks and forced holiday cancellations, we are
                                                          Australian children have the right to a comprehensive
less certain about the potential impacts of COVID-19
                                                          swimming and water safety education. The skills of
over the coming summer, or of the long-term safety
                                                          swimming, survival swimming, and basic rescue are all
impacts resulting from falling enrolments in learn to
                                                          lifesavers, yet we know that there are many barriers;
swim programs.
                                                          including cost, distance, awareness, and access in
                                                          communities most at risk of drowning.
This report highlights our research and analysis
of fatal and non-fatal drowning across Australia
                                                          The updated National Swimming and Water Safety
between 1st July 2019 and 30th June 2020. During this
                                                          Framework was launched in August 2020. The National
time, 248 people lost their lives to drowning and we
                                                          Swimming and Water Safety Framework’s ultimate goal
estimate a further 504 people experienced a non-fatal
                                                          is to increase the swimming and water safety skills of
drowning incident.
                                                          all Australians for lifelong safe and active participation
                                                          in physical aquatic activities and recreation.
Royal Life Saving continues to focus on understanding
the impact of both fatal and non-fatal drowning.
Through this work, we aim to educate, inform and
advocate best practice, working with partners and         Partnerships and collaborations
policy makers, to develop robust national drowning
prevention and water safety strategies.                   The findings and analysis in this report are based on
                                                          data collected over the past 18 years in the Royal
                                                          Life Saving National Fatal Drowning Database. In
                                                          addition, we work with Federal, State and Local
This year’s findings show that:                           Governments, coroners, institutions and other industry
                                                          bodies to inform the development of future drowning
  The total number of drowning deaths over                prevention policies.
  the past year decreased by 8% on the
  previous year;                                          As always, this report serves as an important reminder
                                                          that drowning can affect everyone. Our job at Royal
  People aged 25 to 34 years accounted for                Life Saving is to ensure that all Australians can continue
  17% of the total number of drowning deaths,             to enjoy our beautiful rivers, beaches, and community
                                                          and backyard swimming pools, while staying safe and
  the most of any age group;
                                                          mindful of the risks.
  Despite still being the leading location
                                                          As we approach 2021, we have been working with
  for drowning, deaths in rivers and creeks
                                                          our partners on the Australian Water Safety Council
  decreased by 32%, compared with the                     to develop the next Australian Water Safety Strategy
  10-year average;                                        2030 for the coming years, helping this vision come
                                                          to fruition.
  There was a 52% decrease in drowning
  deaths among children aged 0-4 years,
  compared with the 10-year average.

                                                          Justin Scarr
                                                          Chief Executive Officer
                                                          Royal Life Saving Society – Australia

                                                                                                                       3
248 Royal Life Saving National Drowning Report 2020 - People drowned in Australian waterways
NATIONAL DROWNING REPORT 2020 SNAPSHOT

                                      248
                PEOPLE DROWNED IN AUSTRALIAN WATERWAYS
                                  1 July 2019 to 30 June 2020

                                             Sex

     80% of all drowning deaths were males

                                 State and Territory breakdown

                                              9
                                                                  62
                                             NT
                         33                                       QLD

                                                  14
                         WA                                             89
                                                  SA
                                                                        NSW         1
                                                                 34

                                                                                   ACT
                                                                 VIC

                                                                              6

                                                                             TAS

4
248 Royal Life Saving National Drowning Report 2020 - People drowned in Australian waterways
Top 3 age groups

17%            25-34 years               14%       35-44 years                14%       65-74 years

                Top 3 locations                                      Top 3 activities

                              21%                                                   25%
                         River/creek                                   Swimming & recreating

                              20%                                                   18%
                      Ocean/harbour                                             Boating

                              18%                                                   15%
                             Beach                                                  Fall

                                   Remoteness of drowning location

  36%

                                                25%
                           23%

                                                                      8%
                                                                                              7%

Major cities            Inner regional       Outer regional          Remote                Very remote

                                                                                                         5
248 Royal Life Saving National Drowning Report 2020 - People drowned in Australian waterways
FATAL AND NON-FATAL DROWNING IN AUSTRALIA

                 248                                                                   This is an
                                                                                                                                        and a

           people drowned
                                                                                        8%                                           12%
             in Australian                                                                                                          decrease
                                                                                      decrease
            waterways in                                                                                                          on the 10-year
                                                                                     on 2018/19
                2019/20                                                                                                              average

             Drowning deaths and death rates from 2009/10 to 2019/20                                                             When fatal and non-fatal
                            and the 10-year average                                                                          drowning incidents are combined,
     1.45                                                                                                                         a total of 752 drowning
                1.30
                                        1.34                                                                                  incidents occurred in Australia,
                          1.25                                      1.26
                                               1.16       1.14
                                                                                1.22                                          representing a crude drowning
                                                                                                                      1.22
                                                                                                       1.08                   rate of 2.97 drowning incidents
                                                                                            0.97               0.98
     315
                                        305                         301
                                                                                                                                  per 100,000 population.
                286                            269        267                  294                     269
                          280                                                                                         283
                                                                                            239                248

                                                                                                                                                504
                                                                                                                                248             non-fatal
                                                                                                                                fatal

    2009/10 2010/11 2011/12 2012/13 2013/14 2014/15 2015/16 2016/17 2017/18 2018/19 2019/20

                        Drowning deaths                                   Crude rate
                        10-year average drowning deaths                   10-year average crude rate

    Comparison of fatal and non-fatal incidents and crude rate of drowning
        incidents from 2009/10 to 2019/20 and the 10-year average

     4.92
                4.49
                         4.26
                                    4.82       4.72     4.64

                                                                   3.96       4.08
                                                                                                                                    752
                                                                                                                                     total drowning
                                    791
                                               823        822                                                         4.23
                                                                                                                                        incidents
     752
                                                                                                   3.37
                703       671                                                 694       3.06
                                                                                                              2.97    699
                                                                   643
                                                                                                   574
                                                                                         515                  504

                                                                                                                      283

     315        286       280       305                            301        294
                                               269        267                            239       269        248

    2009/10 2010/11 2011/12 2012/13 2013/14 2014/15 2015/16 2016/17 2017/18 2018/19 2019/20

            Non-fatal                           Fatal                          Crude rate
            10-year average non-fatal           10-year average fatal          10-year average crude rate

6
248 Royal Life Saving National Drowning Report 2020 - People drowned in Australian waterways
WHO DROWNS?

              80%                             25-34
                                                  YEARS
                                                                                              52%
     of drowning deaths                   age group recorded                         decrease in 0-4 years
          were male                      the largest number of                     age group compared with
                                           drowning deaths                            the 10-year average

               Drowning deaths by age group in 2019/20 compared with the 10-year average

                                    12
  0-4 years
                                                             25
                             7
  5-9 years
                             7
                 2
10-14 years
                         5
                     4
15-17 years
                         5
                                                             25
18-24 years
                                                                       29
                                                                                               43
25-34 years
                                                                                               43
                                                                                    35
35-44 years
                                                                                         37
                                                                  27
45-54 years
                                                                                         37

55-64 years
                                                                              32
                                                                                        36

65-74 years
                                                                                   34
                                                                               33

 75+ years
                                                                  27
                                                                   28

               2019/20 drowning deaths      10-year average drowning deaths

                                                                                                             7
248 Royal Life Saving National Drowning Report 2020 - People drowned in Australian waterways
DROWNING DEATHS BY LIFE STAGES: CHILDREN AGED 0-4 YEARS

                    12                                                      This is a
                                                                                                                                       and a

         children aged
                                                                            37%                                                     52%
       0-4 years drowned                                                                                                          decrease
                                                                           decrease
           in Australia                                                                                                         on the 10-year
                                                                          on 2018/19
            in 2019/20                                                                                                             average

       58% of all drowning deaths in this age group were males

                    Drowning deaths of children aged 0-4 years from 2009/10 to 2019/20 and the 10-year average

        35
                                                      32
                                                                                                                   29
                       28
                                                                                     26

                                                                                                   22                                                            25
                                     21                              20
                                                                                                                                             19
                                                                                                                               16
                                                                                                                                                          12

     2009/10         2010/11       2011/12          2012/13       2013/14         2014/15         2015/16     2016/17        2017/18      2018/19      2019/20

                                                                                10-year average

          Drowning deaths of children aged 0-4 years                                                 Drowning deaths of children aged 0-4 years
                    by location, 2019/20                                                                        by activity, 2019/20

                                                                                                                    Unknown            Bathing
                                                              6                                                                         8%
                                                                                                                        8%
                                                                                                                                                    Boating
                                                                                                                                                     8%

         2                2

                                          1                                 1

    Bathtub / Spa     Lake / Dam    River / Creek    Swimming Pool        Other
        Bath                                                                                                Fall
                                                                                                            75%

8
248 Royal Life Saving National Drowning Report 2020 - People drowned in Australian waterways
IN FOCUS
Causes of distraction leading to supervision
lapses in cases of fatal drowning of children 0-4 years

Active adult supervision is vital for preventing drowning          This study found the most common causes
among young children. However, lapses in supervision               of distraction from supervision were:
continue to be contributory factor in child drowning.
                                                                     Indoor household duties – such as putting
All cases of fatal drowning among children aged 0-4
years from 1 July 2002 and 30 June 2017 were analysed
                                                                     on washing, washing up, cooking dinner,
to identify and describe the causes of distraction leading           checking on dinner, putting clothes in dryer,
to lapses in supervision.                                            tidying up, collecting pyjamas or forgotten
                                                                     items and bringing them to the bathroom,
Swimming pools were the leading location for drowning
(54%), of which private residential swimming pools were              using the toilet/showering.
the most common (87% of all swimming pool drowning
                                                                     Outdoor household duties – such as hanging
deaths in this study). Three-quarters of drowning deaths
occurred in toddlers aged 1–2 years (67%).                           washing outside, gardening, taking garbage
                                                                     out, outdoor household repairs.
Active supervision means focusing all of your attention
on your children all of the time, when they are in, on               Talking/socialising – talking or socialising in
or around the water. You must be within arms’ reach,                 person, either inside or outside the house.
interacting with your child and be ready to enter the
water in case of an emergency.                                       Electronic distractions – such as using
                                                                     the computer, using the phone and indoor
                                                                     recreation activities such as watching movies,
Source: Peden AE, Franklin RC. Causes of distraction leading         watching TV or playing computer games.
to supervision lapses in cases of fatal drowning of children 0-4
years in Australia: A 15-year review. Journal of Paediatrics and     Childcare – taking care of children, either a
Child Health. 2019;56(3):450-6.                                      parent’s own children or unrelated children.

                                                                                                                       9
248 Royal Life Saving National Drowning Report 2020 - People drowned in Australian waterways
DROWNING DEATHS BY LIFE STAGES: CHILDREN AGED 5-14 YEARS

                   9                                                   This is a
                                                                                                                           and an

          children aged
                                                                     13%                                                   18%
       5-14 years drowned                                                                                              decrease
                                                                     increase
           in Australia                                                                                              on the 10-year
                                                                    on 2018/19
            in 2019/20                                                                                                  average

       67% of all drowning deaths in this age group were males

                 Drowning deaths of children aged 5-14 years from 2009/10 to 2019/20 and the 10-year average

            16

                         14           14

                                                                                                        12
                                                   10           10           10             11
                                                                                                                                                       11
                                                                                                                                           9
                                                                                                                     8         8

         2009/10       2010/11     2011/12       2012/13     2013/14       2014/15        2015/16     2016/17    2017/18    2018/19     2019/20

                                                                        10-year average

          Drowning deaths of children aged 5-14 years                                       Drowning deaths of children aged 5-14 years
                     by location, 2019/20                                                              by activity, 2019/20

                                                                                                        Watercraft
           3                          3                         3
                                                                                                          11%                         Boating
                                                                                                                                      22%

                                                                                                                                                Fall
                                                                                                                                                11%

                                                                                       Swimming
                                                                                     and Recreating
     Ocean / Harbour             River / Creek             Swimming Pool                  56%

10
IN FOCUS

Exploring children’s participation in commercial swimming
lessons through the social determinants of health

Swimming and water safety lessons,            Royal Life Saving research investigated the swimming and water safety skills being
in part, have reduced drowning                taught in commercial swimming lessons and found:
in children, while also enabling
healthy aquatic participation.                  The most widely taught skills were freestyle (88%) and backstroke (84%),
However, there are concerns that                followed by treading/sculling water (53%).
some Australian children receive
                                                By age 10, almost half (50%) of participants could achieve the age-specific
insufficient swimming and water
safety education and are not                    minimum skill requirements outlined in the Framework of 50m freestyle or
achieving essential skills.                     more and 65% could swim 25m (or more) of breaststroke.
                                                By age 12, 60% of the cohort analysed could swim 50m of freestyle (or more)
The Year 4 standard of the National
                                                and 68% could swim 25m (or more) of breaststroke.
Swimming and Water Safety
Framework has been determined                   Of children aged 10-12 years, over 60% in each age group could swim 25m or
as the national ‘Benchmark’, that               more of survival backstroke.
is, the minimum swimming, water
safety and personal survival skills             By age 10, 22% could achieve the benchmark skill of treading or sculling water
and knowledge that children                     for a minimum of 2 minutes. This rose to 32% by the age of 12 years.
should be able to achieve prior to
                                                Only 9% of children were learning rescue skills. In total, only 4% of children in
leaving primary school to reduce
                                                this study were competent in a rescue skill. Of those, 21% could perform the
their risk of drowning.
                                                benchmark skill of a rescue over 5m by 10 years of age. By age 12, this had
                                                risen to 29%.
                                                Children from low socioeconomic areas were significantly less likely to be
Source: Willcox-Pidgeon SM, Peden AE,
Scarr J. Exploring children’s participation     achieving the minimum benchmark skill of 50m freestyle compared to children
in commercial swimming lessons                  from high socioeconomic areas.
through the social determinants of
health. Health Promotion Journal of             Children from major cities were significantly more likely to be achieving 50m
Australia. 2020.                                freestyle than children from inner regional and outer regional areas.

                                                                                                                                    11
DROWNING DEATHS BY LIFE STAGES: YOUNG PEOPLE AGED 15-24 YEARS

                    29                                                            This is a
                                                                                                                                            and a

          young people
                                                                                 37%                                                       15%
        aged 15-24 years                                                                                                                decrease
                                                                                  decrease
       drowned in Australia                                                                                                           on the 10-year
                                                                                 on 2018/19
           in 2019/20                                                                                                                    average

        69% of all drowning deaths in this age group were males

                 Drowning deaths of young people aged 15-24 years from 2009/10 to 2019/20 and the 10-year average

                                                                                                                                                   46
                                           41                               41
            36
                           34
                                                                                                                         32                                                34
                                                             28                                          29                                                    29
                                                                                          26                                       26

        2009/10          2010/11         2011/12       2012/13         2013/14         2014/15         2015/16      2016/17      2017/18     2018/19       2019/20

                                                                                     10-year average

      Drowning deaths of young people aged 15-24 years                                                 Drowning deaths of young people aged 15-24 years
                    by location, 2019/20                                                                             by activity, 2019/20

                                                                                                                              Watercraft Bathing
                                                        11                                                                      3%         3%
                                                                                                                                                        Boating
                                                                                                                                                         17%

                                                                     5
                                             4                                                                                                                    Fall
                     3          3                                                                                                                                 7%
                                                                                 2
                                                                                                                                                               Jumped In
        1
                                                                                                                                                                   3%
                                                                                                          Swimming
                                                                                                        and Recreating                                  Rock Fishing
     Bathtub /     Beach    Lake / Dam    Ocean /   River / Creek   Rocks    Swimming
     Spa Bath                             Harbour                              Pool                         48%                                             10%
                                                                                                                                            Swept In
                                                                                                                                                7%

12
13
DROWNING DEATHS BY LIFE STAGES: MALES AGED 25-64 YEARS

                   119                                                        This is a
                                                                                                                                       and a

          males aged
                                                                               5%                                                     4%
      25-64 years drowned                                                                                                       decrease
                                                                              increase
          in Australia                                                                                                        on the 10-year
                                                                             on 2018/19
           in 2019/20                                                                                                            average

                   Drowning deaths of males aged 25-64 years from 2009/10 to 2019/20 and the 10-year average

                                                                                                 148
                                                        143
       130                                                           129
                                                                                     122                                                                    119
                       117             116                                                                      116                         113
                                                                                                                                                                        124
                                                                                                                         103

     2009/10        2010/11         2011/12            2012/13     2013/14        2014/15       2015/16     2016/17    2017/18           2018/19           2019/20

                                                                              10-year average

             Drowning deaths of males aged 25-64 years                                              Drowning deaths of males aged 25-64 years
                        by location, 2019/20                                                                   by activity, 2019/20
                                                                                                                      Watercraft

      28                                   28                                                                            6%                       Boating

                               25                                                                                                                    19%
                                                                                                       Unknown
                                                                                                          18%

                                                                                                                                                               Diving
                  15                                                                                                                                           8%
                                                          14

                                                                                                                                                           Fall
                                                                    7
                                                                                                                                                           10%
                                                                                                       Swimming
                                                                                                     and Recreating                                  Fishing
                                                                              2                                                                        2%
                                                                                                          24%                               Rescue
                                                                                                                        Swept In
                                                                                                                                            3%
     Beach     Lake / Dam    Ocean /   River / Creek     Rocks   Swimming    Other                                        1%       Rock Fishing      Jumped In
                             Harbour                               Pool
                                                                                                                                       8%              1%

14
15
DROWNING DEATHS BY LIFE STAGES: OLDER PEOPLE AGED 65 YEARS AND OVER

                         61                                                               This is a                                                     and the
        older people aged
        65 years and over
                                                                                           5%                                                       SAME
                                                                                          increase                                              as the 10-year
       drowned in Australia
                                                                                         on 2018/19                                                average
            in 2019/20

         75% of all drowning deaths in this age group were males

            Drowning deaths of older people aged 65 years and over from 2009/10 to 2019/20 and the 10-year average

                                                                                                                               71
         67                                                                                                   68
                                               63              65
                           62                                                                                                                                                 61
                                                                                                                                                                58
                                                                                                                                                                                    61
                                                                                 52               53
                                                                                                                                               50

     2009/10             2010/11        2011/12           2012/13              2013/14        2014/15       2015/16        2016/17        2017/18           2018/19       2019/20

                                                                                          10-year average

      Drowning deaths of older people aged 65 years and                                                       Drowning deaths of older people aged 65 years
                  over by location, 2019/20                                                                           and over by activity, 2019/20
                                                                                                                                       Watercraft    Bathing
                                       15                                                                                                 5%            5%

                                                                                                                      Unknown
                                                                                                                         18%                                           Boating
                                                                                                                                                                       23%
                  10
                             9
                                                                       8

                                                                                                               Swimming                                                 Diving

                                                    5      5                                                 and Recreating                                              5%
        4                                                                                                          18%
                                                                                 3
                                                                                                                                                                Fall
                                                                                          2
                                                                                                                                Rock Fishing                    15%
                                                                                                                                               Rescue
                                                                                                                                     8%
                                                                                                                                                2%      Non-aquatic
                                                                                                                                                         Transport
     Bathtub /   Beach    Lake / Dam Ocean /    River /   Rocks     Swimming    Other   Unknown
     Spa Bath                        Harbour    Creek                 Pool                                                                                 2%

16
17
WHEN DO DROWNING DEATHS OCCUR?

                           Season                                                                   Time of the day
     Drowning deaths occur in all seasons, with the largest                          Three quarters of drowning deaths occur either
        number occurring in the summer months (39%).                                    in the morning (32%) or afternoon (44%).
                                                                                                                    Early morning
                                                                                                        Unknown   (12:01am to 6am)
                                                                                                          6%           7%
                 Spring
                                                                                      Evening
                 23%                                                             (6:01pm to 12am)
                                                           Summer                       12%
                                                           39%                                                                                Morning
                                                                                                                                         (6:01am to 12pm)
                                                                                                                                              32%

              Winter
               19%
                                                                                         Afternoon
                                                                                     (12:01pm to 6pm)
                                    Autumn                                                44%
                                      19%

                                                          Month
             By month, drowning peaked in December with 39 deaths (16%), followed by January with 36 deaths (15%).

                                                                    39
                                                                               36

                                                        24
      22                                                                                      22
                              19                                                                          20
                                                                                                                      17
                       14                    15
                                                                                                                                                   11
                                                                                                                                     9

       Jul           Aug      Sep            Oct        Nov         Dec        Jan            Feb         Mar         Apr            May           Jun

                                                     Day of the week
              Sunday continues to be the most common day of the week for drowning, accounting for 20% of deaths.

                                                                                                                                                49
                                                                                                                       43

                              32                      32                                        34
                                                                          31
         27

      Monday                Tuesday                Wednesday          Thursday                 Friday               Saturday                  Sunday

18
IN FOCUS

Summer drowning deaths

There were 97 drowning deaths        Drowning deaths in summer from 2009/10 to 2019/20
over summer in 2019/20. This is
an 8% decrease on the 10-year
                                     2009/10                                                                 121
average of 106 deaths.

More than half of all beach (53%)    2010/11                                                                119
and river/creek (51%) drowning
deaths occurred during summer.       2011/12                                              90
Similarly, 60% of deaths while
swimming and recreating occurred     2012/13                                                        105
during the summer months.
                                     2013/14                                                  96
Royal Life Saving research has
shown an increased risk of           2014/15                                             86
drowning during public holidays
and school holidays. During the
summer there are three national
                                     2015/16                                                          110
public holidays (Christmas Day,
Boxing Day and Australia Day), as    2016/17                                                           113
well as individual State/Territory
public holidays and school           2017/18                                                    100
holiday periods.
                                     2018/19                                                                120

                                     2019/20                                                   97

                                                                                                                   19
WHERE AND HOW DO DROWNING DEATHS OCCUR?

                                                          Location
         Rivers and creeks continue to be the location with the largest number of drowning deaths, accounting for
       21% of all deaths. Swimming pools recorded a 28% decrease compared with the 10-year average, while lakes
                                            and dams recorded a 19% increase.

                                                                51
                                                   49
                         45

                                   31
                                                                                      28
                                                                             26

          10
                                                                                                   6
                                                                                                                  2

     Bathtub / Spa      Beach   Lake / Dam       Ocean /   River / Creek    Rocks   Swimming      Other      Unknown
         Bath                                    Harbour                              Pool

                                                       Remoteness
       The largest proportion of drowning deaths occurred in areas classified as major cities (36%), followed by outer
      regional locations (25%). The number of incidents generally decreased as remoteness increased. In 3 cases the
                                         remoteness classification was unknown.

               89

                                                                62
                                     58

                                                                                     19
                                                                                                             17

         Major cities           Inner regional             Outer regional           Remote                Very remote

20
Activity
    Swimming and recreating was the leading activity being undertaken immediately prior to drowning (25%),
                                         followed by boating (18%).

                                                  Watercraft    Bathing
                                                     5%          2%
                                                                             Boating
                                    Unknown                                    18%
                                      16%

                                                                                          Diving
                                                                                              6%

                                                                                       Fall
                               Swimming                                              15%
                             and Recreating
                                  25%                                               Fishing
                                                                                     1%
                                                     Swept In      Rescue        Jumped In
                                                       2%            2%              1%
                                                                            Non-aquatic
                                                           Rock Fishing      Transport
                                                                7%             1%

                                                     Visitor status
   Most of those who drowned were not visitors (67%), that is, they drowned within 100km of where they lived.
 In 53 cases (21%) the person who drowned was known to be a visitor to the location of the incident. Of these, 33 people
(13%) drowned within their own State or Territory in a postcode that was 100km or further from their residential postcode,
      17 people (7%) were visiting a different State or Territory when they drowned and 3 (1%) were overseas tourists.

                                        Unknown
                                         12%

           Visitor - Intrastate
                  13%

         Visitor - Interstate
                 7%
                                                                                               Not a Visitor
             Visitor - Overseas                                                                    67%
                     1%

                                                                                                                             21
DROWNING DEATHS BY KEY LOCATIONS: RIVER/CREEK

                       51                                                              This is a
                                                                                                                                              and a

             drowning deaths
                                                                                       32%                                                32%
             occurred in river/                                                                                                        decrease
                                                                                     decrease
             creek locations in                                                                                                      on the 10-year
                                                                                    on 2018/19
                 2019/20                                                                                                                average

           78% of all drowning deaths in this location were males

                         Drowning deaths in river/creek locations from 2009/10 to 2019/20 and the 10-year average

                              113

                                                                               82
                                               76              75                                                                                 75
             72                                                                                                             71
                                                                                                 67
                                                                                                                                                                            75
                                                                                                             63                      60
                                                                                                                                                                    51

       2009/10           2010/11            2011/12          2012/13        2013/14            2014/15     2015/16     2016/17     2017/18      2018/19           2019/20

                                                                                         10-year average

                  Drowning deaths in river/creek locations                                                        Drowning deaths in river/creek locations
                            by age, 2019/20                                                                                by activity, 2019/20

                                                                                                                                 Watercraft
                                                                                                                                               Boating
                                                        11                                                                          2%
                                                10
                                                                                                                                                12%
                                                                                                                                                         Diving
                                        9                                                                                                                 2%
                                                                                                             Unknown
                                                                                                               26%
                                                                        6
                                                                                                                                                                   Fall
                                                                4                                                                                                 18%
                  3                                                                     3
                                2                                               2
                                                                                                                                                               Fishing
       1
                                                                                                                                                                  2%
                       0
                                                                                                                                                          Jumped In
      0-4      5-9    10-14    15-17   18-24   25-34   35-44   45-54   55-64   65-74    75+
                                                                                                             Swimming                                          4%
     years    years   years    years   years   years   years   years   years   years   years                                                          Rescue
                                                                                                           and Recreating
                                                                                                                                                         2%
                                                                                                               33%

22
IN FOCUS

Make the Right Call

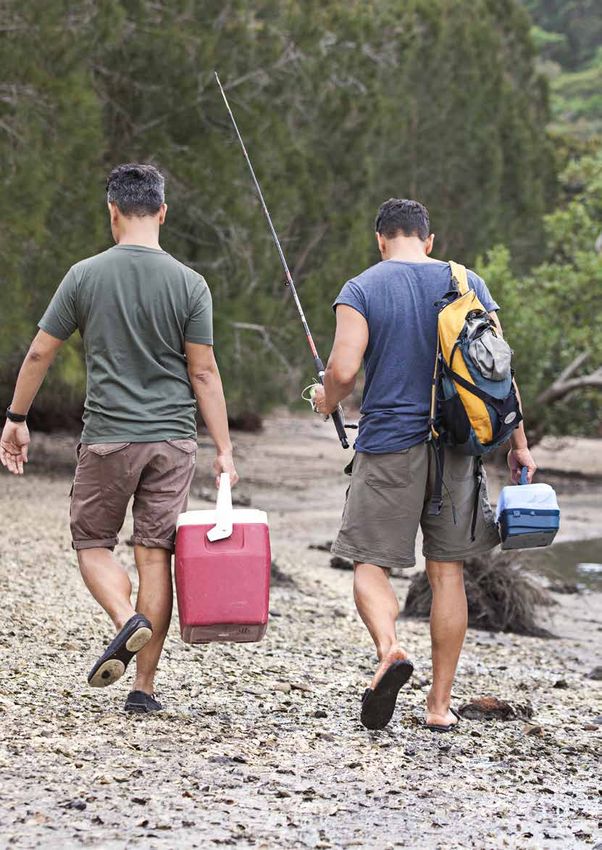
Royal Life Saving’s Make the Right       The campaign highlights a common sense approach to
Call campaign encourages all             drowning prevention and advocates simple safety tips to
Australians, especially males, to stay
safe when enjoying the country’s
                                         prevent drowning:
beautiful inland waterways.
                                           Avoid alcohol around water
Isolated natural aquatic                   Alcohol reduces coordination and can impair a person’s
environments increase the risk             judgement and reaction time, thereby reducing inhibition
of drowning due to changeable              and distorting the perception of risk.
conditions and geographical
remoteness. Risk-taking behaviour          Wear a lifejacket when on the water
involving poor-decision making,            Lifejackets are the most important piece of safety equipment
such as alcohol consumption,
not wearing a lifejacket and               on any recreational vessel. Wearing a lifejacket can increase
swimming alone, can also increase          your chance of survival by 50% if you end up in the water.
the risk of drowning.
                                           Avoid going alone around water
                                           Adult males are more likely to participate in aquatic
                                           recreational activity alone than any other demographic.
                                           Research indicates males can underestimate the risk at
                                           inland waterways and overestimate their abilities.

                                                                                                           23
DROWNING DEATHS BY KEY LOCATIONS: OCEAN/HARBOUR

                     49                                                               This is a
                                                                                                                                                and a

           drowning deaths
                                                                                   123%                                                      20%
          occurred in ocean/                                                                                                              increase
                                                                                      increase
           harbour locations                                                                                                            on the 10-year
                                                                                     on 2018/19
              in 2019/20                                                                                                                   average

          88% of all drowning deaths in this location were males

                    Drowning deaths in ocean/harbour locations from 2009/10 to 2019/20 and the 10-year average

                                                                                                            56
                                            49               49                                                                                                49
                            45                                                                                              45
             41
                                                                                                                                        38                             41
                                                                                                35
                                                                              32

                                                                                                                                                    22

       2009/10            2010/11         2011/12         2012/13           2013/14           2014/15     2015/16         2016/17     2017/18     2018/19    2019/20

                                                                                        10-year average

             Drowning deaths in ocean/harbour locations                                                     Drowning deaths in ocean/harbour locations
                         by age, 2019/20                                                                               by activity, 2019/20

                                                                                                                                     Watercraft
                                                                              10                                              Unknown 4%
                                              9                                                                Swimming          4%
                                                                                                             and Recreating
                                                                      8
                                                                                                                     6%
                                                      7
                                                                                                              Fall
                                                                                                              4%
                                                                                       5
                                      4
                                                              3                                            Diving
               2                                                                                           16%
                      1
      0                       0                                                                                                                             Boating
      0-4      5-9 10-14    15-17   18-24   25-34   35-44   45-54   55-64    65-74     75+                                                                  65%
     years    years years   years   years   years   years   years   years    years    years

24
IN FOCUS

Multiple fatality events

There were 15 multiple fatality events in 2019/20 that   Multiple fatality events are tragic with far-reaching
claimed the lives of 34 people. This is a 36% increase   effects on the victims’ families, communities and
on the 10-year average.                                  rescue personnel. In order to reduce the number of
                                                         multiple fatality events each year, as well as reduce the
                                                         number of lives lost, a number of drowning prevention
A detailed analysis of these events found:               strategies can be undertaken.

  Males accounted for 82% of all multiple                These include ensuring lifejackets are worn when
                                                         boating or rock fishing, ensuring boats are seaworthy
  fatality events
                                                         and fitted with appropriate safety equipment and
  More than half of deaths occurred in ocean/            monitoring weather reports and water conditions
                                                         before and during activity.
  harbour locations (59%), followed by river/
  creek locations (18%)
  The leading activity related to deaths was
  boating (76%), followed by rock fishing (12%)
  New South Wales recorded 13 deaths as
  a result of a multiple fatality event, while
  Queensland recorded 11

                                                                                                                     25
DROWNING DEATHS BY KEY LOCATIONS: BEACH

                        45                                                                  This is a
                                                                                                                                                        and a

                drowning
                                                                                           37%                                                         15%
             deaths occurred                                                                                                                       decrease
                                                                                            decrease
               at beaches                                                                                                                        on the 10-year
                                                                                           on 2018/19
               in 2019/20                                                                                                                           average

           84% of all drowning deaths in this location were males

                                       Drowning deaths at beaches from 2009/10 to 2019/20 and the 10-year average

                                                                68                                              68                                           71
                                                                                                    61
                                              54                                                                                 51            45                            45
                                                                                                                                                                                      53
           42
                              36                                                  33

     2009/10            2010/11          2011/12          2012/13           2013/14            2014/15        2015/16        2016/17         2017/18      2018/19      2019/20

                                                                                            10-year average

                              Drowning deaths at beaches                                                                       Drowning deaths at beaches
                                   by age, 2019/20                                                                                 by activity, 2019/20

                                                                                                                                                       Boating
                                                                     10                                                         Watercraft
                                                                                                                                  16%                   9%
                                                   9
                                                                                                                                                                    Diving
                                                                                                                                                                    11%
                                                                            7                 7
                                                          6                                                     Unknown                                                   Fall
                                                                                                                  11%                                                     2%       Fishing
                                                                                                                                                                                    2%
                                                                                                                                                                          Rescue
                                          3                                            3                                                                                     4%

       0         0        0        0
      0-4        5-9    10-14   15-17   18-24   25-34   35-44    45-54    55-64   65-74      75+
     years      years   years   years   years   years   years    years    years   years     years                         Swimming
                                                                                                                        and Recreating
                                                                                                                            44%

26
DROWNING DEATHS BY KEY LOCATIONS: LAKE/DAM

                  31                                                    This is a
                                                                                                                                  and a

        drowning
                                                                     35%                                                         19%
    deaths occurred in                                                                                                        increase
                                                                      increase
   lake/dam locations                                                                                                       on the 10-year
                                                                     on 2018/19
       in 2019/20                                                                                                              average

   84% of all drowning deaths in this location were males

                      Drowning deaths in lake/dam locations from 2009/10 to 2019/20 and the 10-year average

        45

                                                                                                                                                       31
                                                                                                          29
                                    25            26                              26                                                     23
                                                                24                            21
                                                                                                                                                            26
                                                                                                                            20
                       16

  2009/10          2010/11      2011/12         2012/13       2013/14           2014/15     2015/16     2016/17         2017/18     2018/19       2019/20

                                                                          10-year average

             Drowning deaths in lake/dam locations                                                 Drowning deaths in lake/dam locations
                       by age, 2019/20                                                                      by activity, 2019/20
                                                                                                               Watercraft         Boating
                                                                                                                  7%               10%
                                     8

                                                                                              Unknown                                               Fall
                                                                 5                             26%                                                19%
                                            4                            4
                                                   3
                                                                                                                                                  Non-aquatic
  2                             2                         2                                                                                        Transport
                            1                                                                                                                          3%
                                                                                                                                              Rescue
             0    0                                                                                                                            3%
 0-4      5-9    10-14 15-17 18-24 25-34   35-44 45-54 55-64 65-74       75+
years    years   years years years years   years years years years      years                                Swimming
                                                                                                           and Recreating
                                                                                                                  32%

                                                                                                                                                                 27
FATAL DROWNING RISK FACTORS

     Sex, age and socioeconomic
     status can influence a person’s
     risk of drowning, as well as the
                                                 50
                                            drowning deaths
     presence of pre-existing medical        were known to
     conditions and consumption of        involve a pre-existing
                                            medical condition
     alcohol and/or drugs.                      in 2019/20

                                             Pre-existing medical conditions
                                               commonly occurred among
                                              males (70%) and those aged
                                                65 years and over (40%).

                                                The most common pre-existing medical
                                             conditions among those who drowned were
                                             cardiac conditions, such as ischaemic heart
                                            disease and coronary artery atherosclerosis.
                                             Cardiac conditions were recorded in 64% of
                                            cases where a pre-existing medical condition
                                              was known to be present. Other commonly
                                           occurring medical conditions included epilepsy
                                               (12%) and mental health conditions (12%).

                                            A pre-existing medical condition was deemed
                                           to have been contributory to the chain of events
                                           that led to the drowning in 66% of cases where
                                            a medical condition was known to be present.

                                        Royal Life Saving recommends that people aged 65
                                        years and over undergo regular medical check-ups
                                        to ensure that any health conditions are detected
                                        early, treated effectively and monitored appropriately.
                                        Children and adults with a history of epilepsy should
                                        always be supervised when in, on or around the water.

28
27                                                       26
    drowning deaths                                          drowning deaths
     were known to                                            were known to
     involve alcohol                                           involve drugs
       in 2019/20                                                in 2019/20

        Alcohol was deemed to                                           Legal
   be a contributory factor in 56% of
                                                           58%          (prescription or over the
                                                                        counter medication)
              these cases
                                                                        Illegal
                                                           19%          (commonly cannabis and
        The highest Blood Alcohol                                       methamphetamine)
           Concentration (BAC)
       recorded among those who
                                                                        Both
          drowned was 0.35%                                15%          (legal and illegal drugs)

       At the time of publication,                          8%          Unknown
   presence of alcohol was unknown
           in 79% of all cases

Alcohol consumption can increase the risk of drowning          At the time of publication,
by impairing judgement and reaction time, increasing        presence of drugs was unknown
risk-taking behaviour and reducing coordination.                   in 80% of all cases
Alcohol should be avoided around water.

                                                        Medications can cause drowsiness, affect alertness
                                                        and impair reaction time. Illegal drugs can numb the
                                                        senses, reduce inhibitions and distort the perception
                                                        of risk. There is also the potential for additive effects
                                                        when alcohol consumption is combined with drug
                                                        use. Royal Life Saving urges people to refrain from
                                                        consuming illegal drugs around water. It is also
                                                        important to consider the possible side effects of
                                                        prescription medication.

                                                                                                                    29
STATE AND TERRITORY
     DROWNING DEATHS

                                    33     6%

                                                               Western
                                                               Australia

                                                                               34    23%
     New South Wales recorded the largest number of
     drowning deaths (89), followed by Queensland (62). All
     States and Territories recorded decreases compared
     with the 10-year average, except for the Northern
     Territory and South Australia which recorded no change.

     The Northern Territory recorded the highest fatal
     drowning rate at 3.66 per 100,000 population. The
     Australian Capital Territory recorded the lowest fatal            Arrows reflect 2019/20 changes
     drowning rate at 0.23 per 100,000 population.                     against the 10-year average

30
62    11%

   9
Northern
Territory
                   Queensland                         89 8%

         14
        South
       Australia
                             New
                          South Wales

                                               167%
                                                      Australian
                                                      Capital Territory
                   Victoria

                                        6
                                        45%
                                               Tasmania

                                                                          31
AUSTRALIAN CAPITAL TERRITORY

                                                                                                                                            and a
                  1                                                        This is a
                                                                                                                                        67%
        drowning death                                                    50%                                                        decrease
       occurred in the ACT                                                 decrease
                                                                                                                                   on the 10-year
           in 2019/20                                                     on 2018/19
                                                                                                                                      average

                 Drowning deaths and death rates in the Australian Capital Territory from 2009/10 to 2019/20
                                                and the 10-year average

                      4                                    4                                            4

                          1.13                                                                                       3
                                                               1.06                                                                               3
                                                                                                              0.99

                                  2                                   2                      2                           0.73 2
                                                                                                                                                  0.65
                                      0.55                                 0.52                  0.51                                0.48
                                                1                                 1                                                          1
                                                    0.27                              0.26                                                          0.23

                    2009/10    2010/11     2011/12     2012/13    2013/14     2014/15    2015/16     2016/17     2017/18      2018/19     2019/20

                              Drowning deaths          10-year average drowning deaths           Crude rate          10-year average crude rate

     ACT Aquasafe program
     Aquasafe is a unique water safety and awareness program designed
     specifically for Year 2 students in the ACT. The concept of the                                                                    Primary school students
                                                                                                                                        participated in 2019/20
                                                                                                                3174
     program was developed as a joint initiative between Royal Life
     Saving ACT and the ACT Government’s Education Directorate.                                                                         across 69 primary schools,
     Participation in the program is subsidised by the ACT Government.                                                                  including:
     This funding increases accessibility and affordability of the program
     for all students.

     The program consists of a 2-week (10-day) block of pool-based                                                                      EALD students
     sessions and 5 x 40-minute classroom sessions. Royal Life Saving ACT is
     responsible for the organisation and facilitation of the pool sessions,                                     299                    (English as an additional
                                                                                                                                        language or dialect)
     including transport, for all ACT primary schools and has developed a
     Teacher Resource for the delivery of the classroom sessions.

     Aquasafe is different from traditional learn to swim programs in
     that it focuses specifically on water safety skills and knowledge
                                                                                                                                        Aboriginal and Torres
     that can be applied to a range of aquatic environments. Aquasafe
     complements existing learn to swim programs and supports children                                               134                Strait Islander students
     to develop the knowledge, skills and understanding to avoid danger
     and prevent drowning.

32
33
NEW SOUTH WALES

                                                                                                and an
             89                                        This is a
                                                                                                8%
       drowning deaths                                 6%                                     decrease
       occurred in NSW                                 decrease
                                                                                            on the 10-year
          in 2019/20                                  on 2018/19
                                                                                               average

      89% of those who drowned in New South Wales were male

                     Drowning deaths and death rates in New South Wales from 2009/10 to 2019/20
                                              and the 10-year average

      1.53
              1.46
                         1.41      1.41
                                               1.23      1.31      1.26       1.24
                                                                                                                  1.31
                                                                                                 1.19
                                                                                                          1.10
                                                                                        1.02
      108
              104        102       103
                                                          98        96         96                    95      89
                                               91                                                                 97
                                                                                         80

     2009/10 2010/11 2011/12 2012/13 2013/14 2014/15 2015/16 2016/17 2017/18 2018/19 2019/20

                             Drowning deaths                       10-year average drowning deaths
                             Crude rate                            10-year average crude rate

34
Age                                                                              Location

                                                                                                           Swimming         Bathtub /
                                                                                                             Pool   Unknown Spa Bath
                                     16                                                                      6%       2%        5%
                                              14      14
                                                                     13                           Rocks                                      Beach
                                                                               11                 12%                                        24%
                                                              8
                               7

  2        2
                  1     1

                                                                                                                                             Lake / Dam
 0-4      5-9    10-14 15-17 18-24 25-34 35-44 45-54 55-64 65-74            75+            River / Creek                                       11%
years    years   years years years years years years years years           years              23%

                                                                                                                           Ocean / Harbour
                                                                                                                                18%

                                   Activity                                                                          Season

                            Watercraft Bathing                                                              Spring
                               6%         2%
                                                           Boating                                          14%
                                                              18%
        Unknown
         21%

                                                                     Diving                Winter
                                                                      6%                    17%                                                Summer
                                                                                    Fall
                                                                                    3%                                                           49%
                                                                     Fishing
                                                                          1%
                                                                  Rescue       Jumped
                                                                   2%            In
                                                                                    1%
                                                           Rock Fishing
            Swimming                                           9%                                      Autumn
          and Recreating                           Swept In
                                                     1%                                                    20%
                 29%

                                                                                                                                                          35
NORTHERN TERRITORY

                9                                        This is a                                   and the

       drowning deaths                                  50%                                        SAME
       occurred in the NT                                increase                                 as the 10-year
          in 2019/20                                    on 2018/19                                   average

      67% of those who drowned in the Northern Territory were male

                     Drowning deaths and death rates in the Northern Territory from 2009/10 to 2019/20
                                                and the 10-year average

      6.64

                                                                      5.72
                                               5.38

      15                  4.32       3.82
                                                                                                                         3.95
                                                                      14                                      3.66
                3.48
                                                  13
                                                                                          2.83
                                                                                3.26                 2.43
                           10
                                       9                                                                         9
                                                                                                                         9
                 8                                        1.65                   8
                                                                                            7
                                                                                                       6

                                                           4

     2009/10   2010/11   2011/12    2012/13   2013/14    2014/15     2015/16   2016/17   2017/18    2018/19    2019/20

                                Drowning deaths                      10-year average drowning deaths
                                Crude rate                           10-year average crude rate

36
Age                                                       Location

                                                                                                         Lake / Dam
                                     5
                                                                                                           11%

 2

                                                                                                                       River / Creek
          1                                                1
                                                                                                                            33%
                                                                              Swimming Pool
                 0       0     0              0       0        0          0       56%
 0-4     5-9    10-14 15-17 18-24 25-34 35-44 45-54 55-64 65-74 75+
years   years   years years years years years years years years years

                                   Activity                                                   Season

                      Unknown                     Diving
                         11%                      11%

                                                                                                                      Dry
                                                                                                                      33%
                                                                   Fall
                                                               22%

                                                                                        Wet
          Swimming                                                                      67%
        and Recreating
              56%

                                                                                                                                       37
QUEENSLAND

                                                                                                      and an
               62                                         This is a
                                                                                                      11%
        drowning deaths                                   2%                                         decrease
        occurred in QLD                                   decrease
                                                                                                   on the 10-year
           in 2019/20                                    on 2018/19
                                                                                                      average

      77% of those who drowned in Queensland were male

                         Drowning deaths and death rates in Queensland from 2009/10 to 2019/20
                                               and the 10-year average

      1.96
                1.86

                          1.61
                                     1.58                              1.57
                                                           1.40                  1.44                                  1.51
       85                                         1.29
                 82                                                                                    1.26     1.22
                                                                                           1.18
                                                                        75
                           72          72                                         70
                                                            66                                                         70
                                                                                                        63       62
                                                  60                                         58

     2009/10   2010/11   2011/12    2012/13   2013/14     2014/15     2015/16   2016/17   2017/18    2018/19   2019/20

                                Drowning deaths                       10-year average drowning deaths
                                Crude rate                            10-year average crude rate

38
Age                                                                        Location

                                                                                                                      Bathtub /
                                                                                                             Other    Spa Bath
                                                                                                                 3%     2%
                                                                                          Swimming Pool
                                                             13                                                                    Beach
                                                                                                  13%                              19%

                                                                     10
                                      9
                               8
                                              7                                   River / Creek
  6                                                                                                                                        Lake / Dam
                                                                                     19%
                                                                                                                                             13%

          3                                              3
                        2
                                                                              1
                  0
                                                                                                                      Ocean /
  0-4     5-9    10-14 15-17 18-24 25-34 35-44 45-54 55-64 65-74 75+
 years   years   years years years years years years years years years                                                Harbour
                                                                                                                       31%

                                   Activity                                                                       Season

                                      Bathing
                        Watercraft
                                       2%
                            8%
              Unknown                                                                                                             Summer
                 5%                                               Boating                                                         24%
                                                                                          Spring
                                                                  26%
                                                                                          32%

Swimming
   and
Recreating
                                                                     Diving
  27%                                                                                                                                Autumn
                                                                      8%
                                                                                                                                       18%
                  Rescue
                   2%       Jumped In             Fall                                                  Winter
                                 2%             19%                                                     26%
                 Non-aquatic
                  Transport
                      2%

                                                                                                                                                        39
SOUTH AUSTRALIA

               14                                         This is the
                                                                                                     and the

        drowning deaths
         occurred in SA
                                                          SAME                                     SAME
                                                                                                  as the 10-year
                                                          as 2018/19
           in 2019/20                                                                                average

      79% of those who drowned in South Australia were male

                         Drowning deaths and death rates in South Australia from 2009/10 to 2019/20
                                                and the 10-year average

                                                            1.01
                           0.91       0.91
                0.86                               0.84
      0.75                                                              0.76    0.76      0.75       0.81 0.80
                                                                                                                        0.84
                                                             17

                            15          15
                 14                                14                                                  14       14
                                                                        13       13         13                          14
       12

     2009/10   2010/11    2011/12    2012/13   2013/14     2014/15   2015/16   2016/17   2017/18    2018/19   2019/20

                                 Drowning deaths                     10-year average drowning deaths
                                 Crude rate                          10-year average crude rate

40
Age                                                                   Location

                                                                                          Swimming Pool               Beach
                                                                                              14%                     14%
                                              3                 3     3

    2                                             2

                                     1
                                                                          River / Creek                                       Lake / Dam
                                                                             29%                                                29%

             0       0    0    0                        0
    0-4      5-9 10-14 15-17 18-24 25-34 35-44 45-54 55-64 65-74 75+
   years    years years years years years years years years years years

                                                                                                            Ocean /
                                                                                                            Harbour
                                                                                                             14%

                                   Activity                                                               Season

                     Unknown                                                                 Spring
                         14%                                                                 14%
                                                            Boating
  Swimming                                                  36%
and Recreating
     7%
                                                                                                                              Summer
     Rescue
                                                                                Winter
                                                                                                                               50%
        7%
                                                                                 21%

           Fishing
            7%

                                                                                               Autumn
                                    Fall                                                         14%
                                   29%

                                                                                                                                           41
TASMANIA

                                                                                                     and a
                6                                       This is a
                                                                                                   45%
        drowning deaths                                 50%                                        decrease
         occurred in TAS                                increase
                                                                                                 on the 10-year
           in 2019/20                                  on 2018/19
                                                                                                    average

      100% of those who drowned in Tasmania were male

                         Drowning deaths and death rates in Tasmania from 2009/10 to 2019/20
                                              and the 10-year average

                          2.93

      2.58                                                                     2.51
                2.36                           2.34
                           15

       13                             1.76                1.75                  13       1.91
                                                                                                                      2.05
                 12                               12                 1.55

                                                                                                                      11
                                                                                           10
                                                                                                              1.12
                                       9                    9
                                                                       8                              0.76

                                                                                                                  6

                                                                                                       4

     2009/10   2010/11   2011/12    2012/13   2013/14    2014/15    2015/16   2016/17   2017/18     2018/19   2019/20

                                Drowning deaths                     10-year average drowning deaths
                                Crude rate                          10-year average crude rate

42
Age                                                     Location

                                                                                                        Beach
                                      2            2                                                    17%

                                               1          1
                                                                                                                Lake / Dam
                                                                                                                  17%

 0       0       0          0   0                             0       0
 0-4     5-9    10-14 15-17 18-24 25-34 35-44 45-54 55-64 65-74 75+        Ocean /
years   years   years years years years years years years years years
                                                                           Harbour
                                                                             67%

                                    Activity                                                 Season

                 Unknown                           Boating
                     17%                            17%

                                                                           Spring
                                                                           33%

                                                                  Diving                                        Summer
                                                                  17%                                           50%

                     Fall                                                           Winter
                  50%                                                                17%

                                                                                                                             43
VICTORIA

                                                                                                    and a
               34                                      This is a
                                                                                                  23%
        drowning deaths                              39%                                          decrease
         occurred in VIC                              decrease
                                                                                                on the 10-year
           in 2019/20                                on 2018/19
                                                                                                   average

      77% of those who drowned in Victoria were male

                          Drowning deaths and death rates in Victoria from 2009/10 to 2019/20
                                              and the 10-year average

                                                                    0.90
                                                                                                     0.87
                                              0.81
                                                                              0.75
      0.73                0.70      0.73                 0.64                                         56              0.74
                0.66                                                 54                  0.63
                                                                                                               0.52
                                               47                               46
                                                                                                                      44
                                     41                                                   40
       39                  39                             38
                 36
                                                                                                                 34

     2009/10   2010/11   2011/12   2012/13   2013/14    2014/15    2015/16   2016/17   2017/18      2018/19   2019/20

                             Drowning deaths                       10-year average drowning deaths
                             Crude rate                            10-year average crude rate

44
Age                                                              Location

                                                                                                                 Bathtub /
                                                                                                  Other
                                                                                                                 Spa Bath
                                                                                                  6%
                                                                                                                   12%
                                             7                         7
                                                                               Swimming Pool
                                                                                   15%                                       Beach
                                                                                                                             9%
                              5

                                                    4      4
                                                                                                                               Lake / Dam
                                     3                                                                                               9%
                                                                2                Rocks
                                                                                                                              Ocean /
                 1      1                                                         21%                                         Harbour
                                                                                                                                6%
  0       0
 0-4     5-9    10-14 15-17 18-24 25-34 35-44 45-54 55-64 65-74 75+
years   years   years years years years years years years years years                                        River / Creek
                                                                                                                24%

                                  Activity                                                           Season

                                   Bathing
                                                 Boating
                                     3%           6%

                                                                                   Spring
                                                                Fall                                                         Summer
                                                                                    35%
 Unknown
                                                               18%                                                            41%
   38%

                                                                 Non-aquatic
                                                                  Transport
                                                                       3%

                                                           Rock Fishing
                                                                                         Winter
                                                               15%
                                                                                          6%
                        Swimming                                                                     Autumn
                      and Recreating
                                                                                                       18%
                            18%

                                                                                                                                            45
WESTERN AUSTRALIA

                                                                                                       and a
               33                                        This is a
                                                                                                     6%
        drowning deaths                                 14%                                         decrease
         occurred in WA                                 increase
                                                                                                  on the 10-year
           in 2019/20                                  on 2018/19
                                                                                                     average

      67% of those who drowned in Western Australia were male

                      Drowning deaths and death rates in Western Australia from 2009/10 to 2019/20
                                               and the 10-year average

                                      2.14

      1.74                                                                       1.72
                                       52                             1.54
                                                           1.35
                                                                                                                       1.42
                 1.22                             1.21                            44                            1.26
                                                                                           1.09        1.12
                         1.10
       39                                                              39
                                                            34
                                                                                                                 33 35
                                                  30                                                    29
                 28                                                                         28
                           26

     2009/10   2010/11   2011/12    2012/13   2013/14    2014/15     2015/16   2016/17   2017/18     2018/19   2019/20

                                Drowning deaths                      10-year average drowning deaths
                                Crude rate                           10-year average crude rate

46
Age                                                               Location

                                                                                                                Bathtub /
                                                                                                        Other   Spa Bath
                                                                                                        3%        3%
                                                                                   Swimming Pool                                  Beach
                                        7                                                9%                                       18%

                                5                          5          5     5

                                                                                Rocks
                                                3                               24%
                                                                                                                                          Lake / Dam
                                                    2                                                                                       12%

           1

   0               0     0
  0-4     5-9    10-14 15-17 18-24 25-34 35-44 45-54 55-64 65-74 75+
 years   years   years years years years years years years years years                  River / Creek                    Ocean /
                                                                                           12%                           Harbour
                                                                                                                            18%

                                     Activity                                                            Season

                             Watercraft Bathing
                  Unknown      6%           3%          Boating
                       3%                                                               Spring
                                                         15%
                                                                                        21%
                                                                                                                                     Summer
Swimming                                                                                                                              36%
   and
                                                                      Diving
Recreating
                                                                       9%
  24%

                                                                                  Winter
                                                               Fall
                                                                                  21%
           Swept In                                         15%
                 9%
                                                                                                                Autumn
                                    Rock Fishing
                                       15%                                                                      21%

                                                                                                                                                       47
METHODS

       Fatal drowning                                                  Exclusions and categorisations

     The information presented in the Royal Life Saving              Drowning deaths as a result of suicide or homicide,
     National Drowning Report 2020 has been collated from            deaths from natural causes, shark and crocodile attacks,
     the National Coronial Information System (NCIS), State          or hypothermia have been excluded from this report. All
     and Territory Coronial offices and year-round media             information presented in this report relates to drowning
     monitoring. Cases are collated in partnership with Royal        deaths or deaths where drowning is a contributory cause
     Life Saving State and Territory Member Organisations            of death.
     (STMOs) and Surf Life Saving Australia and analysed by
     Royal Life Saving Society – Australia.                          ‘Non-aquatic transport’ relates to drowning deaths
                                                                     involving a means of transport that is not primarily
     Royal Life Saving uses a media monitoring service for           designed or intended for aquatic use such as cars,
     broadcast, print and online all year round to identify          motorbikes, bicycles and aeroplanes among others.
     drowning deaths reported in the media. This information
     is then corroborated with information from the NCIS,            Means of transport primarily used for aquatic purposes
     police reports and Royal Life Saving STMOs before being         are categorised under ‘boating’ (water-based wind
     included in the National Drowning Report.                       or motor-powered vessels, boats, ships and personal
                                                                     watercraft, such as boats, jet skis, sail boats and yachts).
     Great care is taken to ensure that the information in           ‘Watercraft’ refers to water-based non-powered
     this report is as accurate as possible. Figures may change      recreational equipment such as those that are rowed
     depending on ongoing coronial investigations and                or paddled (e.g., rowboats, surfboats, kayaks, canoes,
     findings, as 78% of cases are still under investigation         boogie boards).
     (i.e. open) as this report went to press. Royal Life Saving
     regularly publishes ongoing studies, which provide              Within this report, ‘swimming pool’ includes home
     detailed information on long-term data trends.                  swimming pools, public swimming pools, hotel and motel
                                                                     pools, and portable swimming pools among others.
     Information on all cases is correct as of 12 August 2020.
     Historical drowning data are correct as of 1 July 2020 in
     accordance with Royal Life Saving’s ongoing data quality
     assurance policy. All cases in the Royal Life Saving National
     Fatal Drowning Database are checked against those in the
     NCIS on a regular basis and figures are updated in annual
     National Drowning Reports as cases close. The 10-year
     averages in this report are calculated from drowning
     death data from 2009/10 to 2018/19 inclusive.

     Drowning rates per 100,000 population are calculated
     using population data from the Australian Bureau of
     Statistics (ABS) publication ‘Australian Demographic
     Statistics’ (Cat 3101.0). Percentages and averages are
     presented as whole numbers and have been rounded up
     or down accordingly. Percentages may not total 100 due
     to rounding.

48
Non-fatal drowning                                             Acknowledgments

In the absence of up-to-date data on non-fatal drowning,       Royal Life Saving would like to thank the
non-fatal drowning incidents in 2015/16, 2016/17, 2017/18,     following people and organisations for their
2018/19 and 2019/20 were estimated using the observed          assistance in producing the Royal Life Saving
ratios of fatal to non-fatal incidents for each age group      National Drowning Report 2020:
and sex between 2002/03 and 2014/15.
                                                               • Royal Life Saving State and Territory
                                                                 Member Organisations (STMOs)
The applicable average ratio of fatal to non-fatal incidents
over that period was then used to project the likely           • The National Coronial Information
number of non-fatal incidents based on the number of             System (NCIS)
fatal incidents for that age group and sex in 2015/16,
                                                               • Surf Life Saving Australia (SLSA)
2016/17, 2017/18, 2018/19 and 2019/20, respectively.
                                                               • The Queensland Family and Child
Since available counts of non-fatal incidents do not             Commission (QFCC)
include all drowning incidents, the proportion of
                                                               • Shane Daw (SLSA)
missing incidents was estimated based on a four-year
sample of fatal incident data which compared incident          • Jaz Lawes (SLSA)
counts using both broad and restrictive definitions of
‘drowning’. The estimated proportion of drowning               • Annabel Ellis (SLSA)
incidents not captured in existing non-fatal data for each     • Leanne Daking (NCIS)
age group was then used to scale-up estimates of non-
fatal incidents to arrive at a projection comparable with      • Bernadette Matthews (LSV)
the broad definition of drowning used to count fatal           • Lauren Nimmo (RLSSWA)
drowning incidents in this report.
                                                               • Rick Carter (Studio One Another)

                                                               The drowning prevention research of the Royal
                                                               Life Saving Society – Australia is supported by
                                                               the Australian Government.

                                                               This report was compiled and written by Alison
                                                               Mahony, National Manager – Research and
                                                               Policy, Stacey Pidgeon, National Manager –
                                                               Research and Policy and Keeley Allen, Senior
                                                               Project Officer – Research and Policy, Royal Life
                                                               Saving Society – Australia.

                                                                                                                   49
2019/20 RESEARCH AND POLICY HIGHLIGHTS

     Royal Life Saving’s research and policy contribution
     in 2019/20 has been diverse and continues to
     impact drowning prevention policy and programs.

50
51
DROWNING IN LAKES, DAMS AND LAGOONS

                                           PEOPLE DROWNED
        255                    IN A LAKE, DAM OR LAGOON IN AUSTRALIA
                                       1 JULY 2008 - 30 JUNE 2018

      87% of all drowning deaths were males

                                                Top 3 age groups

      15%      25-34 years                  12%                 45-54 years                10%         0-4 years

                                       State and Territory breakdown

                                                         3%
                                                                               23%
                                                          NT
                          9%                                                   QLD

                                                                4%
                          WA                                                         31%
                                                                SA
                                                                                                 2%
                                                                          24% NSW

                                      Drowning deaths                                            ACT
                                   among Aboriginal and                       VIC
                                 Torres Strait Islanders were

                                    4 TIMES                                                3%
                                  more likely than deaths
                                  among non-Aboriginal

                                                                                           TAS

52
Key Findings                                                  Recommendations
                                                                Children
 51%     Lakes        44%    Dams          5%     Lagoons       Supervise children at all times and create safe play
                                                                areas for children on rural properties with access
                                                                to inland waterways, especially dams on private/
Most (60%) drowning deaths in lakes, dams and lagoons           residential properties.
occurred in major cities or inner regional areas and 12%
                                                                Older people
occurred in remote or very remote locations. The rate
of drowning in remote (12.75 times greater) and very            Raise awareness of drowning risk among older people
remote (18.75 times greater) locations were found to be         (65 years and older), including pre-existing medical
significantly greater than that of major cities.                conditions, the effects of medication and being alone
                                                                when undertaking activities around water.
A diverse range of activities were being undertaken
                                                                Aboriginal and Torres Strait Islander people
immediately prior to death:
                                                                Develop culturally appropriate strategies to prevent
• 22% Fall                                                      drowning among Aboriginal and Torres Strait Islander
• 20% swimming and Recreating                                   communities to highlight the risks associated with
• 12% Boating                                                   undertaking aquatic activity when under the influence of
                                                                alcohol and/or drugs.
Consistent with general drowning trends, drowning               Industry
deaths in lakes, dams and lagoons commonly occurred in:
                                                                Raise awareness among those working in agriculture
• 37% Summer                                                    or remote regions about the risks of drowning on rural
• 23% Spring                                                    properties and sites.
• 48% Afternoon (between 12:01pm and 6pm)                       Swimming and water safety education
                                                                Highlight the value of learning to swim and water safety
                                                                skills, and the need for local water safety education
Risk factors                                                    programs, particularly in regional and remote locations.
• 31% involved alcohol and 32% involved drugs                   Regional, remote and rural
 - 11% were known to involve both alcohol and drugs             Key strategies to increase public awareness of the risks
                                                                and to improve outcomes in regional, remote and rural
• 38% recorded a pre-existing medical condition
                                                                locations include:
 - People aged 65 to 74 years were most likely to record
   a pre-existing medical condition (79%)                       - Provide greater access to CPR training, particularly in
                                                                  remote locations;
• 31% of cases recorded swimming ability, of which
  71% were considered to be a non-swimmer or a poor             - Improve telecommunications in rural, regional and
  swimmer                                                         remote regions, and skilled telephone triage training
• 12% of people participating in boating and watercraft           for emergency service providers;
  activities were known to be wearing a lifejacket              - Develop prevention strategies that cater for both local
• 42% of cases were known to be alone when they                   community members and tourists, including culturally
  drowned                                                         appropriate materials;
• 2% of cases were known to be flood related                    - Ensure that accommodation providers that are
                                                                  located on or have access to lakes/lagoons supply
This study identified specific findings for lakes, dams and       guests with water safety information, install clear
lagoons that had not been explored fully in previous              safety signage, emergency phones and defibrillators,
drowning analyses:
                                                                  and consider ways to restrict intoxicated people
• Cardiopulmonary resuscitation (CPR) was administered            accessing the aquatic environment in line with
  in 24% of incidents                                             relevant industry guidelines.
• Visibility of the person in the water was lost in 86% of
  incidents (usually due to water quality or depth)
• A search was conducted In 84% of incidents

Dams were the only location to record work-related
drowning deaths. Work-related drowning occurred in 32%        Source: Taylor DH, Pidgeon S, Peden AE (2020).
of dam drowning deaths. More work-related drowning            A ten-year national review of lake, dam and lagoon
deaths occurred in dams classed as private/residential dams   drowning deaths: 2008/2009 to 2017/2018, Royal Life Saving
(43%) compared to public access dams (10%).                   Society – Australia. Sydney.

                                                                                                                            53
AQUATIC INDUSTRY WORKFORCE PROFILE

     Royal Life Saving conducted a survey of the
     aquatic industry in April to June 2019 to gather            Workers place a high value on having
     comprehensive data on the full range of                    a positive impact and working as a team
     aspects that make up, influence, and affect the
     characteristics and working lives of the aquatic
     industry workforce.
                                                                      74%    Positive impact on people’s lives
     At June 2019, an estimated 67,000 people worked
     across the aquatic industry in a variety of roles
     at aquatic centres, back offices and in their own
     businesses. At June 2019, the aquatic industry                   59%    Interaction with customers
     employed people across Australia of different ages
     and backgrounds.

                                                                      54%    Being part of a team
     Two reports have bene published
     following this survey:

        The Workforce Profile, published in
        December 2019, provided a snapshot of
        specific demographic information for key
        roles within the industry.
        The National Aquatic Workforce Report,
        published in July 2020, analysed employee
        insights relating to working life, professional
        development and future needs of those
        working in the aquatic industry.

     The aim is to use the findings of both
     publications to form a Workforce Development
     Plan. The primary focus of this Plan will be to
     guide and support industry stakeholders to
     make decisions and take actions to ensure the
     workforce has the capabilities, opportunities,
     resources and systems to enable it to best meet
     client, community and business needs, and
     respond to ongoing change.

     The Aquatic Industry Workforce Development
     Project was conceived of and commenced in
     a pre-COVID-19 world. This report was under
     development when the economic effects of
     COVID-19 took hold. As the aquatic industry,
     like many others, looks to bounce back from               The top skills nominated by workers needed
     COVID-19, the knowledge, skills, positivity and             for success in the aquatic industry are:
     resilience of the paid workforce and volunteers
     will be more important than ever.

                                                                      01     Verbal communication

                                                                      02     Customer service
     Sources:
     Allen, K & Jackson, S. (2019) National aquatic industry
     workforce profile 2019. Royal Life Saving Society –
     Australia. Sydney.
                                                                      03     Teamwork and collaboration
     Allen, K & Jackson, S. (2020) National aquatic
     industry workforce report. Royal Life Saving Society –
     Australia. Sydney.

54
The workforce is largely casual

10%            16%                      27%                                        47%
Other         Part time                 Full time                                  Casual

                                     The industry is overwhelmingly female

             73%                                         27%                                < 1% OTHER
                                                                                            Gender proportions have been
                                                                                            rounded to the nearest whole number.

                                                                    Workers are local community members

                                                                           43%
                                                                           Live within
                                                                           15 minutes

                                                                                         69%
                                                                                   Live within
                                                                                 15 kilometres

                                   16% of workers have never undertaken PD.
        For those that have, the number of PD activities undertaken per year is relatively evenly spread.

    21%                          26%                          22%                 13%                    19%
        1                           2                           3                   4                     5+

                                                                                                                                   55
AUTISM AND DROWNING

     Royal Life Saving conducted a study exploring                 The study suggests that parents and carers of
     unintentional fatal drowning among children and
                                                                   children with diagnosed ASD or with suspected
     adolescents aged between 0 and 19 years diagnosed
     with Autism Spectrum Disorder (ASD) in Australia              ASD should be made aware of the increased
     between 1 July 2002 and 30 June 2018.                         risk of drowning and advised on how to reduce
                                                                   the risk. This includes:
     Of the 667 cases of drowning among those aged 0 to
     19 years with known medical history, 27 children and             highlighting the importance of active adult
     adolescents (4%) who drowned had an ASD diagnosis.
                                                                      supervision for all ages,
     Children and adolescents with ASD were found to be
     three times more likely to drown than those without              the erection of barriers to restrict access to
     ASD (RR=2.85; CI 0.61 to 13.24). Among those with ASD,           water (e.g., four-sided pool fencing),
     children aged 0 to 4 year recorded the highest rate
     (11.60/100 000 diagnosed).
                                                                      the creation of child safe play areas in
                                                                      locations where the risk of drowning is posed
     This study found that the highest rates of drowning              by natural waterways, and
     were seen in children aged 0 to 4 years and that over
                                                                      adults with ASD should always swim with
     half of all ASD-related drowning deaths were due to an
     unintentional fall into water. Children and adolescents          a friend.
     with ASD were significantly more likely to drown when
     compared with those without ASD: if aged 5–9 years            It is, however, important to note that with the right
     (44% of ASD-yes cases; 13% of ASD-no cases); in a lake        support and learning environment, people with ASD
     or dam (26% vs 10%) and during winter (37% vs 13%).           can learn to swim.
     Pre-existing medical conditions are known to increase the     For more information or to find an approved Instructor
     risk of drowning. The findings of this study are consistent   or Centre, visit https://autismswim.com.au/
     with other international research, which indicates that
     people with ASD have an increased risk of premature           For more information about Australian drowning
     death and that children with ASD are at greater risk of       statistics and ASD, and drowning prevention measures
     unintentional injury, particularly drowning.                  for people with ASD, visit https://www.royallifesaving.
                                                                   com.au/facts-and-figures/key-facts/medical/autism-
                                                                   spectrum-disorder-asd-and-drowning

                                                                   Source: Peden AE, Willcox-Pidgeon S. Autism spectrum disorder
                                                                   and unintentional fatal drowning of children and adolescents
                                                                   in Australia: an epidemiological analysis. Archives of Disease in
                                                                   Childhood. 2020.

56
IDENTIFYING A GAP IN DROWNING PREVENTION

Drowning is one of the leading causes of unintentional       Proposed prevention strategies included education,
injury deaths and it is widely known and accepted            practical skills, research, policy and engagement.
that some populations are at greater risk of drowning        However, many studies recommended strategies that
than others.                                                 were very general, and did not provide specific examples
                                                             of how strategies were tailored to meet the needs of
A literature review of peer reviewed articles published      these ‘high-risk’ populations.
between 1990 and 2018 from high-income
Countries was conducted to explore high-risk                 The findings from this study concluded that the
populations for drowning, risk factors and prevention        determinants of health influence attitudes and
strategies. Thirty-five articles were reviewed, and were     behaviour towards swimming and water safety, and
from: Australia (11%), Canada (11%), New Zealand             participation in and around the water but are not well-
(20%) and the United States (57%). Most studies              understood and largely ignored when implementing
focused on children (0-18 years).                            prevention strategies. Understanding the specific
                                                             characteristics of the target populations is important
                                                             when designing and implementing drowning prevention
Populations identified to be at greater                      strategies for high-risk populations. Further research is
risk for drowning were:                                      required to explore drowning among adults from high-
                                                             risk populations.
  Aboriginal and Torres Strait Islander
  people and, other First Nations peoples;                   This study is the first to be published as part of an
                                                             industry-based PhD research project led by Royal Life
  ethnic minority populations;                               Saving’s National Manager for Research and Policy,
                                                             Stacey Pidgeon, in partnership with James Cook
  migrants and;                                              University to investigate the drowning incidence and
                                                             risk mitigation strategies for migrant populations
  rural residents.                                           living in Australia. It builds on previous Royal Life
                                                             Saving research carried out to review overseas-
Indigenous populations were often combined into the          born drowning deaths in Australia and highlights
‘ethnic-minority’ population category.                       the organisation’s ongoing commitment to address
                                                             drowning in high-risk populations.
Key risk factors for these high-risk populations included:
                                                             Source: Willcox-Pidgeon SM, Franklin RC, Leggat PA, Devine
social determinants, attitudes and behaviour, and
                                                             S. Identifying a gap in drowning prevention: high risk
swimming ability and knowledge. Social determinants          populations. Inj Prev. 2020;26:279-88.
refer to the conditions in which people are born, grow,
work, live and age, and also includes the forces that
might shape a person’s life – for example, cultural/
religious customs, economic policies and systems,
development agendas, social norms, social policies and
political systems.

                                                                                                                          57
1894 DROWNING REPORT

     Royal Life Saving Society - Australia has been working                       In 1894, fatal drowning generally occurred as a result of
     to prevent drowning for 125 years. As part of our                            daily life, such as children falling in open water sources
     organisation’s celebrations, we prepared an analysis                         near home or people attempting to cross a river on
     of drowning deaths in 1894. Drowning events were                             horseback. Today, drowning deaths mostly occur during
     identified through a review of historical newspapers,                        recreational or leisure activities.
     cemetery records and government records. Australian
     society has undergone dramatic changes since the
     nineteenth century. We explored the similarities and                         Source: Allen K (2019). Drowning deaths then and now, Royal
     differences in drowning deaths in 1894 and today.                            Life Saving Society – Australia. Sydney.

     Drowning in Australia has reduced dramatically over
     the past 125 years, from approximately 20 per 100,000
     people in 1894 to 1.1 per 100,000 people in 2018/19.
     This is an estimated 95% decrease in the fatal drowning
     rate. However, men remain overrepresented in
     drowning deaths across Australia.

                                     In 1894                                                              In 2018/19

                            697                                        DROWNING
                                                                        DEATHS                       276
                                                                   DROWNING RATE
                                    20.34                      PER 100,000 POPULATION                        1.10

                                    In 1894*                                                              In 2018/19

          82% 14%                                                                      81%                              19%

     *Unknown data from 1894 for sex, age, location and activity are not shown.

58
Suggested citation
Royal Life Saving Society – Australia
(2020) Royal Life Saving National
Drowning Report 2020, Sydney Australia.

                                          59
You can also read