269 Online Bioaerosol Sensing (OLBAS) - Authors: John Sodeau, David O'Connor, Patrick Feeney, Michael Quirke, Shane Daly, Mehael Fennelly, Paul ...
←
→
Page content transcription
If your browser does not render page correctly, please read the page content below
Report No. 269

                Online Bioaerosol Sensing (OLBAS)
          Authors: John Sodeau, David O’Connor, Patrick Feeney,
       Michael Quirke, Shane Daly, Mehael Fennelly, Paul Buckley,
              Stig Hellebust, Eoin McGillicuddy and John Wenger

www.epa.ie
ENVIRONMENTAL PROTECTION AGENCY                                     Monitoring, Analysing and Reporting on the
The Environmental Protection Agency (EPA) is responsible for        Environment
protecting and improving the environment as a valuable asset        • Monitoring air quality and implementing the EU Clean Air for
for the people of Ireland. We are committed to protecting people      Europe (CAFÉ) Directive.
and the environment from the harmful effects of radiation and
                                                                    • Independent reporting to inform decision making by national
pollution.
                                                                      and local government (e.g. periodic reporting on the State of
                                                                      Ireland’s Environment and Indicator Reports).
The work of the EPA can be
divided into three main areas:                                      Regulating Ireland’s Greenhouse Gas Emissions
                                                                    • Preparing Ireland’s greenhouse gas inventories and projections.
Regulation: We implement effective regulation and environmental     • Implementing the Emissions Trading Directive, for over 100 of
compliance systems to deliver good environmental outcomes and         the largest producers of carbon dioxide in Ireland.
target those who don’t comply.

Knowledge: We provide high quality, targeted and timely             Environmental Research and Development
environmental data, information and assessment to inform            • Funding environmental research to identify pressures, inform
decision making at all levels.                                        policy and provide solutions in the areas of climate, water and
                                                                      sustainability.
Advocacy: We work with others to advocate for a clean,
productive and well protected environment and for sustainable       Strategic Environmental Assessment
environmental behaviour.                                            • Assessing the impact of proposed plans and programmes on the
                                                                      Irish environment (e.g. major development plans).
Our Responsibilities
                                                                    Radiological Protection
Licensing                                                           • Monitoring radiation levels, assessing exposure of people in
We regulate the following activities so that they do not endanger     Ireland to ionising radiation.
human health or harm the environment:                               • Assisting in developing national plans for emergencies arising
• waste facilities (e.g. landfills, incinerators, waste transfer      from nuclear accidents.
  stations);                                                        • Monitoring developments abroad relating to nuclear
• large scale industrial activities (e.g. pharmaceutical, cement      installations and radiological safety.
  manufacturing, power plants);                                     • Providing, or overseeing the provision of, specialist radiation
• intensive agriculture (e.g. pigs, poultry);                         protection services.
• the contained use and controlled release of Genetically
  Modified Organisms (GMOs);                                        Guidance, Accessible Information and Education
• sources of ionising radiation (e.g. x-ray and radiotherapy        • Providing advice and guidance to industry and the public on
  equipment, industrial sources);                                     environmental and radiological protection topics.
• large petrol storage facilities;                                  • Providing timely and easily accessible environmental
• waste water discharges;                                             information to encourage public participation in environmental
• dumping at sea activities.                                          decision-making (e.g. My Local Environment, Radon Maps).
                                                                    • Advising Government on matters relating to radiological safety
National Environmental Enforcement                                    and emergency response.
• Conducting an annual programme of audits and inspections of       • Developing a National Hazardous Waste Management Plan to
  EPA licensed facilities.                                            prevent and manage hazardous waste.
• Overseeing local authorities’ environmental protection
  responsibilities.                                                 Awareness Raising and Behavioural Change
• Supervising the supply of drinking water by public water          • Generating greater environmental awareness and influencing
  suppliers.                                                          positive behavioural change by supporting businesses,
• Working with local authorities and other agencies to tackle         communities and householders to become more resource
  environmental crime by co-ordinating a national enforcement         efficient.
  network, targeting offenders and overseeing remediation.          • Promoting radon testing in homes and workplaces and
• Enforcing Regulations such as Waste Electrical and Electronic       encouraging remediation where necessary.
  Equipment (WEEE), Restriction of Hazardous Substances
  (RoHS) and substances that deplete the ozone layer.               Management and structure of the EPA
• Prosecuting those who flout environmental law and damage the      The EPA is managed by a full time Board, consisting of a Director
  environment.                                                      General and five Directors. The work is carried out across five
                                                                    Offices:
                                                                    • Office of Environmental Sustainability
Water Management
• Monitoring and reporting on the quality of rivers, lakes,         • Office of Environmental Enforcement
  transitional and coastal waters of Ireland and groundwaters;      • Office of Evidence and Assessment
  measuring water levels and river flows.                           • Office of Radiation Protection and Environmental Monitoring
• National coordination and oversight of the Water Framework        • Office of Communications and Corporate Services
  Directive.                                                        The EPA is assisted by an Advisory Committee of twelve members
• Monitoring and reporting on Bathing Water Quality.                who meet regularly to discuss issues of concern and provide
                                                                    advice to the Board.
EPA RESEARCH PROGRAMME 2014–2020

        Online Bioaerosol Sensing (OLBAS)

                       (2014-CCRP-MS.19)

                      EPA Research Report

                 Prepared for the Environmental Protection Agency

                                       by

                             University College Cork

                                    Authors:

John Sodeau, David O’Connor, Patrick Feeney, Michael Quirke, Shane Daly, Mehael
   Fennelly, Paul Buckley, Stig Hellebust, Eoin McGillicuddy and John Wenger

                ENVIRONMENTAL PROTECTION AGENCY
                 An Ghníomhaireacht um Chaomhnú Comhshaoil
               PO Box 3000, Johnstown Castle, Co. Wexford, Ireland

               Telephone: +353 53 916 0600 Fax: +353 53 916 0699
                     Email: info@epa.ie Website: www.epa.ie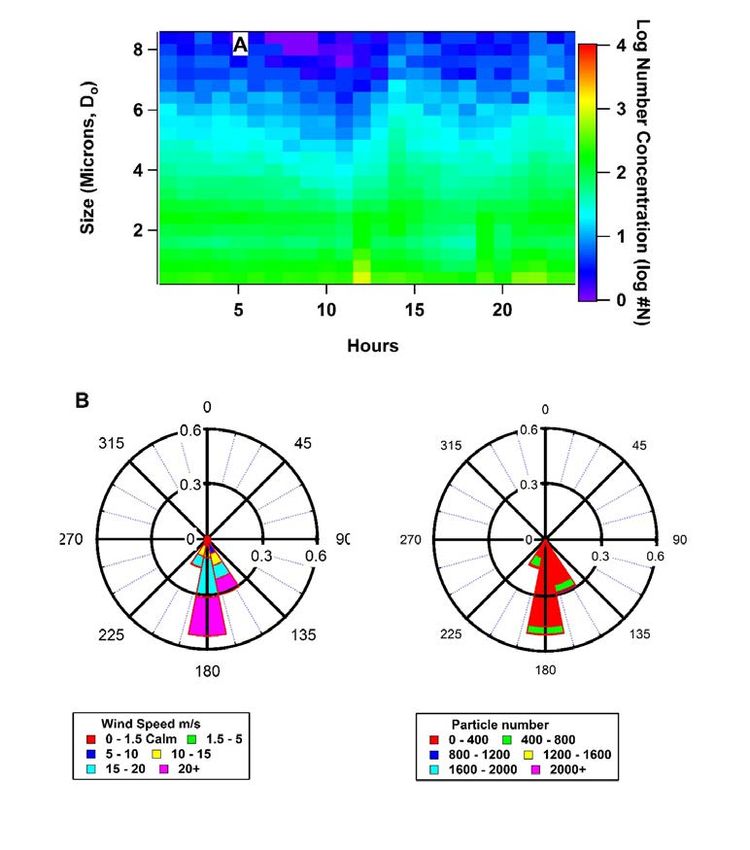
© Environmental Protection Agency 2019

                                 ACKNOWLEDGEMENTS
This report is published as part of the EPA Research Programme 2014–2020. The EPA Research
Programme is a Government of Ireland initiative funded by the Department of Communications,
Climate Action and Environment. It is administered by the Environmental Protection Agency, which
has the statutory function of co-ordinating and promoting environmental research. An IRC research
studentship was awarded to Patrick Feeney in association with this project.

The authors would like to acknowledge the members of the project steering committee, namely
John McEntagart (EPA), Caoimhin Nolan (EPA), David Dodd (Department of Communications,
Climate Action and Environment), Professor Rob Kinnersley (English Environment Agency), Dr
Warren Stanley (University of Hertfordshire), Dr Ray McGrath (Met Éireann) and Dr Saji Varghese
(Met Éireann). Thanks also to Professor Martin Gallagher (University of Manchester) for the loan
of the multi-parameter bioaerosol sensor, Dr Cathy O’Sullivan (University College Cork) for help
with statistical analyses and José María Maya-Manzano (University of Extremadura, now at Dublin
Institute of Technology) for primary biological atmospheric particle counting. Finally, a large debt
of gratitude is owed to Professor Paul Kaye and his team at the University of Hertfordshire for
designing and building the upgrade to our wideband integrated bioaerosol sensor (WIBS-4), which
became WIBS-4+.

                                        DISCLAIMER
Although every effort has been made to ensure the accuracy of the material contained in this
publication, complete accuracy cannot be guaranteed. The Environmental Protection Agency, the
authors and the steering committee members do not accept any responsibility whatsoever for loss
or damage occasioned, or claimed to have been occasioned, in part or in full, as a consequence of
any person acting, or refraining from acting, as a result of a matter contained in this publication.
All or part of this publication may be reproduced without further permission, provided the source is
acknowledged.

The EPA Research Programme addresses the need for research in Ireland to inform policymakers
and other stakeholders on a range of questions in relation to environmental protection. These reports
are intended as contributions to the necessary debate on the protection of the environment.

                         EPA RESEARCH PROGRAMME 2014–2020
                    Published by the Environmental Protection Agency, Ireland

ISBN: 978-1-84095-815-7                                                              February 2019

Price: Free                                                                         Online version

                                                 ii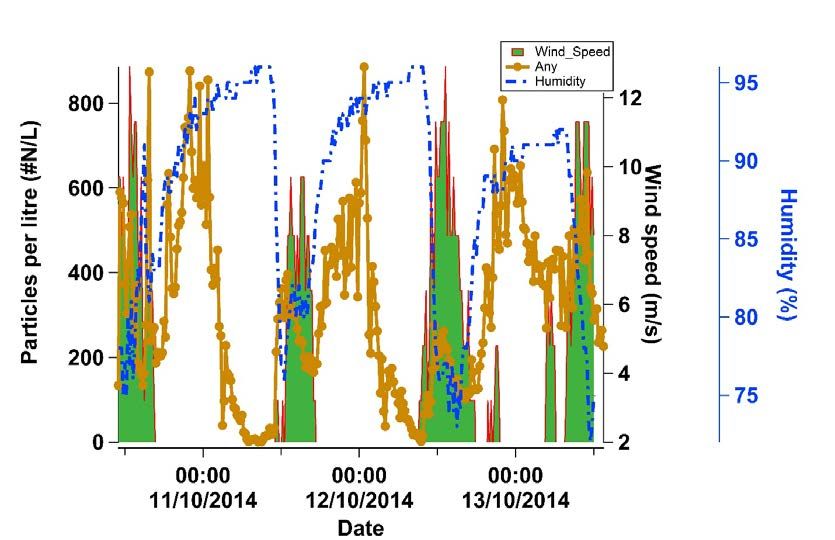
Project Partners

Professor John R Sodeau                                Shane Daly
Centre for Research into Atmospheric                   Centre for Research into Atmospheric
Chemistry                                              Chemistry
Environmental Research Institute and School of         Environmental Research Institute and School of
Chemistry                                              Chemistry
University College Cork                                University College Cork
Cork                                                   Cork
Ireland                                                Ireland
Tel.: +353 (0)21 490 2680                              Tel.: +353 (0)21 490 2680
Email: j.sodeau@ucc.ie                                 Email: cmssmd@leeds.ac.uk

Dr David J O’Connor                                    Mehael Fennelly
School of Chemical and Pharmaceutical                  Centre for Research into Atmospheric
Science                                                Chemistry
Dublin Institute of Technology                         Environmental Research Institute and School of
Dublin                                                 Chemistry
Ireland                                                University College Cork
Tel.: +353 (0)1 402 4571                               Cork
Email: david.x.oconnor@dit.ie                          Ireland
                                                       Tel.: +353 (0)21 490 2680
Patrick Feeney                                         Email: 116224792@umail.ucc.ie
Centre for Research into Atmospheric
Chemistry                                              Paul Buckley
Environmental Research Institute and School of         Centre for Research into Atmospheric
Chemistry                                              Chemistry
University College Cork                                Environmental Research Institute and School of
Cork                                                   Chemistry
Ireland                                                University College Cork
Tel.: +353 (0)21 490 2680                              Cork
Email: paddy.feeney1@gmail.com                         Ireland
                                                       Tel.: +353 (0)21 490 2680
Michael Quirke                                         Email: paulbuckley@umail.ucc.ie
Centre for Research into Atmospheric
Chemistry                                              Dr Stig Hellebust
Environmental Research Institute and School of         Centre for Research into Atmospheric
Chemistry                                              Chemistry
University College Cork                                Environmental Research Institute and School of
Cork                                                   Chemistry
Ireland                                                University College Cork
Tel.: +353 (0)21 490 2680                              Cork
Email: michaelquirke99@gmail.com                       Ireland
                                                       Tel.: +353 (0)21 490 2680
                                                       Email: s.hellebust@ucc.ie

                                                 iii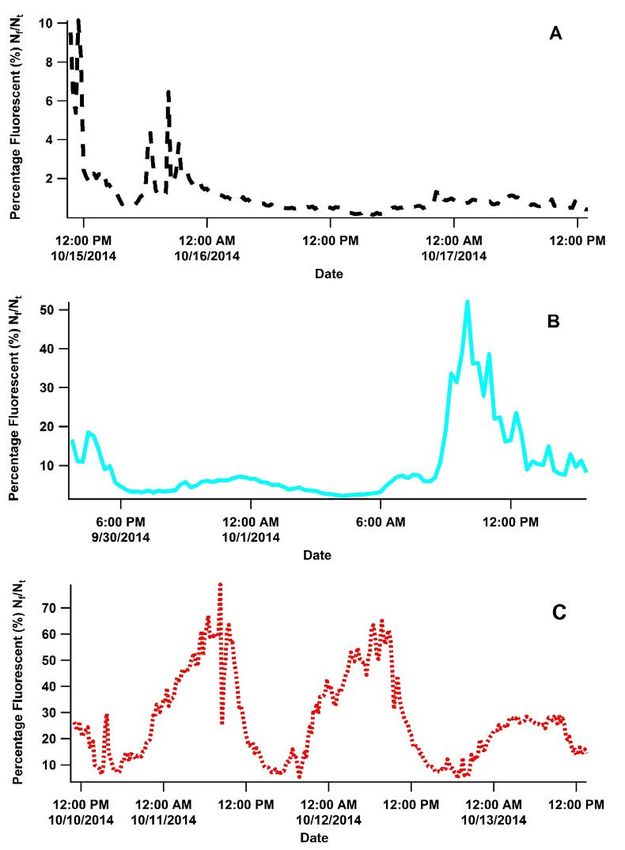
Online Bioaerosol Sensing (OLBAS)

Dr Eoin McGillicuddy                               Professor John Wenger
School of Chemical and Pharmaceutical              Centre for Research into Atmospheric
Science                                            Chemistry
Dublin Institute of Technology                     Environmental Research Institute and School of
Dublin                                             Chemistry
Ireland                                            University College Cork
Tel.: +353 (0)1 402 4571                           Cork
Email: eoinjmc@gmail.com                           Ireland
                                                   Tel.: +353 (0)21 490 2454
                                                   Email: j.wenger@ucc.ie

                                              iv
Contents

Acknowledgementsii
Disclaimerii
Project Partners                                                                  iii
List of Figures                                                                   vi
List of Tables                                                                   viii
Executive Summary                                                                 ix
1      Introduction                                                                1
       1.1        Background Information                                           1
       1.2        Impaction Methods for the Detection of Fungal Spores             5
       1.3        Impaction Methods for the Detection of Pollen                    6
       1.4        Spectroscopic, Real-time Methods for the Detection of PBAPs      6
       1.5        Objectives of OLBAS                                              7
2      Field Campaigns at a Green-waste Management Site in Ireland (2014–2016)     9
       2.1        Site Description                                                 9
       2.2        Field Campaign 1: October 2014                                 10
       2.3        Field Campaign 2: February/March 2016                          18
       2.4        Deployment of the Multi-parameter Bioaerosol Spectrometer      29
       2.5        Distinguishing Fungal Spores Using the MBS                     37
       2.6        Real-time Monitoring of FAPs in the Staff Cabin                37
3      Field Campaign at the Met Éireann Valentia Observatory (2016)             40
       3.1        Site Description                                               40
       3.2        Laboratory Testing of the WIBS-4+40
       3.3        Field Campaign: June/July 2016                                 41
       3.4        Field Testing of the WIBS-4+43
4      Afterword                                                                 46
References47
Abbreviations53

                                                    v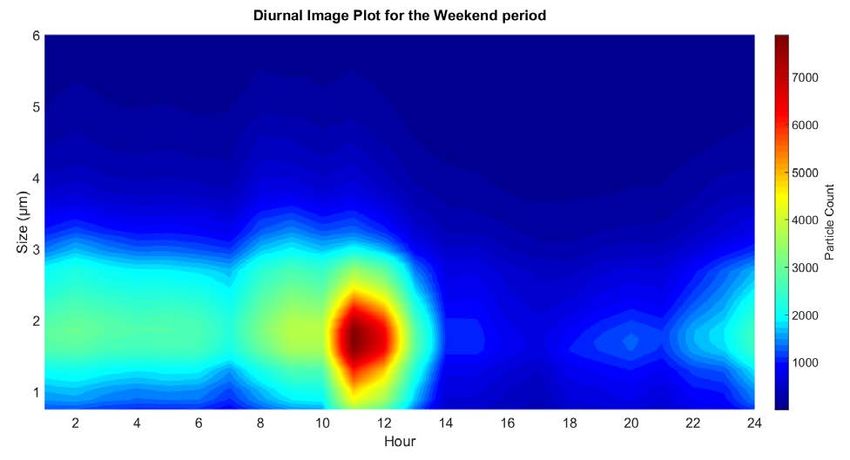
List of Figures

Figure 2.1.    A schematic of the green-waste site used for the three field campaigns           9
Figure 2.2.    Time-dependent particle size/number concentration plot (a) and
               corresponding wind rose graphic (b) for the “light” workload days               10
Figure 2.3.    Time-dependent particle size/number concentration plot (a) and
               corresponding wind rose graphic (b) for the “heavy” workload day                12
Figure 2.4.    Time-dependent particle size/number concentration plot (a) and
               corresponding wind rose graphic (b) for the weekend days.                       13
Figure 2.5.    The number concentrations of fluorescent particles as a proportion of total
               particles counted for (a) “light” workload days, (b) “heavy” workload days
               and (c) weekend days                                                            15
Figure 2.6.    Fluorescence counts over the weekend period as a function of wind speed
               and relative humidity                                                           17
Figure 2.7.    Pie chart of the six most common spores released from the composting site       18
Figure 2.8.    (a) Time series of total spore counts vs. time over the 7-day measurement
               campaign. (b) Time series of spore counts vs. time for Aspergillus–
               Penicillium (black line) and U. maydis (red line) over the 7-day
               measurement campaign                                                            20
Figure 2.9.    (a) A time-series profile of size and fluorescence intensity for the weekdays.
               (b) A time-series profile of size and fluorescence intensity for the weekend    21
Figure 2.10.   (a) Diurnal image plot over the weekday period with size on the y-axis and
               particle count as the colour index. (b) Diurnal image plot over the weekend
               period with size on the y-axis and particle count as the colour index           22
Figure 2.11.   Average diurnal profiles of FAP number concentrations plotted against the
               weather parameters of humidity (blue line), temperature (red line) and wind
               speed (green line) measured over the measurement campaign                       23
Figure 2.12.   (a) Wind rose diagram of wind speed and direction and (b) spore
               concentrations in terms of wind direction                                       24
Figure 2.13.   A comparison between the daily particle/spore concentrations measured by
               the WIBS-4A and those measured by the SporeWatch                                25
Figure 2.14.   Linear regression for SporeWatch and WIBS for the daily concentrations
               measured by each method during the campaign                                     25
Figure 2.15.   Hourly concentration diurnal graphs for 1, 3 and 4 March                        26
Figure 2.16.   (a) Time series of fluorescent particles vs time. (b) Time series of
               fluorescent particles vs time                                                   27

                                                  vi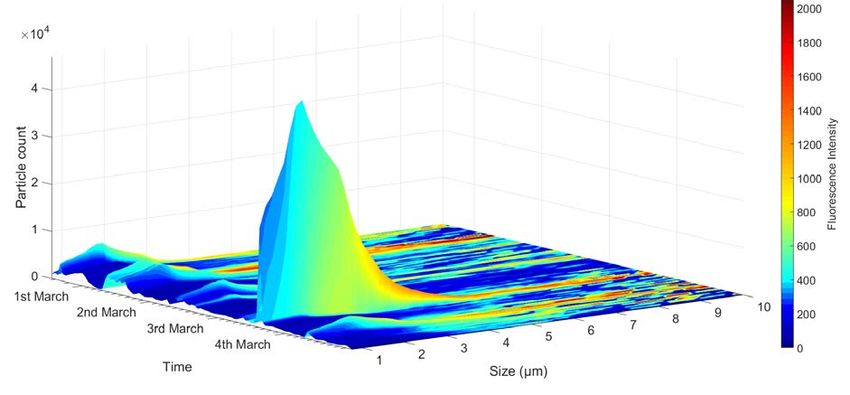
J. Sodeau et al. (2014-CCRP-MS.19)

Figure 2.17.   (a) Fluorescence intensities vs time for the 18-min period on 3 March.
               (b) Fluorescence intensities vs time for the 4-min period on 4 March          28
Figure 2.18.   Spectral fluorescence distribution of the dominant cluster for the spore
               A. fumigatus31
Figure 2.19.   Spectral fluorescence distribution of the dominant cluster for the spore
               A. niger31
Figure 2.20.   Spectral fluorescence distribution of the dominant cluster for the spore
               P. notatum31
Figure 2.21.   Size histogram for the dominant A. fumigatus cluster31
Figure 2.22.   Size histogram for the dominant P. notatum cluster                            32
Figure 2.23.   Spectral distributions of A. fumigatus and A. niger mixtures                  32
Figure 2.24.   Spectral distributions of A. fumigatus and P. notatum mixtures33
Figure 2.25.   Scatter chart comparing total spores with Aspergillus–Penicillium spores
               from 5 to 7 March                                                             34
Figure 2.26.   Dominant cluster from the K-means analysis of 5 March                         35
Figure 2.27.   Size histogram for the dominant cluster of 5 March                            35
Figure 2.28.   Spectral distribution of the first cluster from the K-means analysis of
               6 March                                                                       36
Figure 2.29.   Size histogram for the first cluster of 6 March                               36
Figure 2.30.   Spectral distribution of the second cluster from the K-means analysis of
               6 March                                                                       36
Figure 2.31.   Size histogram for the second cluster of 6 March                              36
Figure 2.32.   Histogram of fluorescent particle size measured over the campaign             38
Figure 2.33.   Plot of FAP counts measured in the FL1 channel as a function of time of day   38
Figure 2.34.   Diurnal plot of averaged FAP counts in the FL1 channel as a function of
               time of day                                                                   39
Figure 3.1.    Histogram of WIBS-4+ fluorescence intensity for four particle types           41
Figure 3.2.    Time series for total pollen grains detected at their greatest concentration
               during the campaign                                                           42
Figure 3.3.    Diurnal profile of total pollen grains as a function of time of day           42
Figure 3.4.    Total pollen number concentrations as a function of wind direction over the
               full campaign                                                                 43
Figure 3.5.    Diurnal time series over the whole campaign for (a) the FL4 channel and
               (b) the FL5 channel                                                           44
Figure 3.6.    Time series for FAP counts over the whole campaign                            45

                                                  vii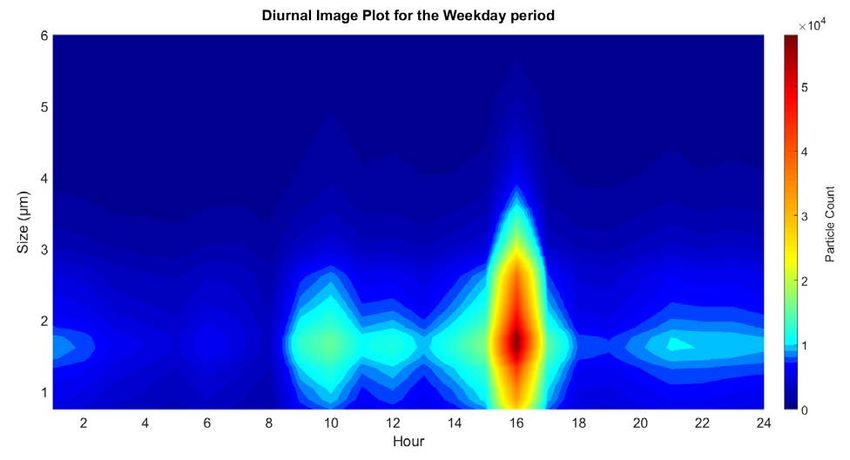
List of Tables

Table 2.1.   Number concentration limits for the monitored fluorescent particles            11
Table 2.2.   Comparative descriptive statistics for the bioaerosols monitored over the
             three campaign periods                                                         16
Table 2.3.   Clusters, populations and size distributions for airborne mixtures of
             A. fumigatus and P. notatum33
Table 2.4.   The two Aspergillus–Penicillium release events used for MBS correlation        34
Table 3.1.   Descriptive statistics for the hourly concentrations of named pollen species   42

                                              viii
Executive Summary
This report presents a description of field and biological atmospheric particles (PBAPs) using a
laboratory studies directed towards understanding novel device called the multi-parameter bioaerosol
the time behaviours of sources, removal pathways spectrometer (MBS). The second was to investigate
and number concentrations of airborne fungal spores levels of airborne PBAPs present in the staff cabin.
and pollen. To achieve these aims novel real-time
The MBS allows fluorescence spectral distributions
spectroscopic instrumentation based on fluorescence
of between 300 and 615 nm to be recorded. The data
detection and optical scattering was developed,
obtained are then treated statistically to provide further
commissioned and deployed at two contrasting
information on spore agglomerations and sizing. Three
locations: (1) a dual windrow/in-vessel composting
fungal spores – A. fumigatus, Aspergillus niger and
site and (2) an open field at the Met Éireann Valentia
P. notatum – were investigated in the commissioning
Observatory site. The real-time monitoring results
laboratory study, both individually and as spore
were contrasted with those obtained by traditional
mixtures. It was shown that, using a combination of
Andersen sampling and coupled with impaction/optical
fluorescence distributions, propensity for aerosolisation
microscopy techniques (SporeWatch).
and size measurements, the spores could be identified
Three short on-site campaigns were carried out at and distinguished. A subsequent field campaign
an Irish green-waste management facility and these performed at the composting site indicated that if a
were the first to provide real-time data on bioaerosol much larger library of MBS spore data were available
emissions as a set of site-characterising, continuous this could be used to identify and distinguish between
profiles. The wideband integrated bioaerosol airborne PBAPs.
spectrometer (WIBS) results showed that the
There were no prior measurements of bioaerosol
fluorescence aerosol particle (FAP)/bioaerosol counts
levels in the offices or recreational areas where
varied enormously depending on working activity, time
employees work, eat lunch or change clothes at
of day/week and weather conditions. The Andersen
composting sites. Employees entering their offices or
counting method provided no insight into the activities
staff cabins can act as vectors for carrying biological
because the measurements were performed off-site
particles indoors on their clothes and bodies.
on just one occasion, in line with current licensing
Furthermore, when office and cabin doors are opened
requirements.
a draft is created that brings material indoors or
A longer term campaign using the WIBS in tandem disturbs settled dust/PBAPs. Hence, the WIBS was
with a SporeWatch impactor was then launched. deployed in the staff cabin for a short period. The data
The results showed that the numbers of FAPs can show that FAP number concentrations averaged over
be counted in the WIBS sizing regime 0.5–15 μm. the 4 days are associated with three major events
However, only larger spores, such as Ustilago maydis occurring each day: at opening time, lunchtime and
(8–10 μm), can be related to optical microscopy just before site closure.
identification. Key composting microbial releases,
One final campaign was performed in an open field
such as Aspergillus fumigatus and Penicillium
site at the Met Éireann Valentia Observatory as
notatum (2–5 μm), cannot be distinguished by either
a necessary precursor to the establishment of an
WIBS or optical microscopy. Nonetheless, all fine
Irish pollen and spore network. The study utilised a
particulate matter (PM2.5), particularly examples that
traditional impaction collector as well as an entirely
are fluorescent in nature, can lead to adverse health
novel upgrade to the WIBS device, which allowed
effects and so simple counts of FAPs may prove to
FAPs of up to 40 μm to be analysed over an extended
be useful for future regulations. The field campaigns
fluorescence wavelength range. The instrument,
led to two further avenues for real-time methodology
WIBS-4+, was commissioned initially in the laboratory
to be deployed. The first was to develop a strategy
and the results provided clear evidence that PBAP
to identify and distinguish between airborne primary
exhibiting long wavelength fluorescence, such as
ixOnline Bioaerosol Sensing (OLBAS)
grass pollen, could be detected and distinguished acquisition time for the online WIBS-4+ method was
from other airborne particulates. The results obtained much quicker (seconds) than for the SporeWatch
in the field campaign also show that the WIBS-4+ traditional methodology (hours/days) also employed
results tracked the diurnal variation of the pollen as here because the latter methodology requires both
counted by optical microscopy. A distinction between an impaction and collection step on-site before
daytime and night-time pollen release patterns was undergoing optical microscopy analysis in the
shown using both techniques although the data laboratory afterwards.
x1 Introduction
1.1 Background Information (Pinnick et al., 1995; Després et al., 2012; Poehlker
et al., 2012), the real-time monitoring of small-sized
The need to monitor the occurrence and
airborne material at known “hotspot” locations, such
transformation of aerosols in our atmosphere has
as composting sites, has lagged behind. This type of
increased dramatically over recent years (Sodeau
information is particularly necessary with regard to
and O’Connor, 2016). The necessity is based on
enforcing any legal framework that underpins local
the undesirable effects that they can have on our
air quality and/or licensing activities. However, there
health and the role that they play in climate change.
are few studies published that quantify, in real time,
Of course, the atmospheric aerosol does not
the number and type of fungal spores, even though
consist of abiotic chemical components alone. Field
they are also often sized in the PM2.5–10 range and
measurements have shown that primary biological
released in places where people (particularly those
atmospheric particles (PBAPs) are also present and
who are immunocompromised) are present or where
comprise materials such as viruses, bacteria, fungal
susceptible crops may be affected on a routine basis.
spores, pollen, sub-pollen and plant fragments.
Green-waste management sites are a good example
The diameters of these materials range between
of such outdoor spaces, often being located in rural
nanometres and hundreds of microns and display a
areas close to crops, served by staff and visited by
wide variety of morphologies; they are often termed
clients.
bioaerosols (Lacey and West, 2007).
One of the most important aims of the waste industry
Fungal spores generally range from 1 to 10 μm in size,
is to maximise the benefits that can be recovered
although some are larger, and their shapes range
from global waste. However, this has now become an
from spherical to rod-like. It has been estimated that
important industrial activity, which impacts on waste
typical fungal spore mass concentrations of ≈1 µg m–3
management targets. Composting is a traditional
are present in continental boundary layer air. Their
method of waste management based on the biological
global emissions are ≈50 Tg year–1 (Elbert et al., 2007;
degradation and stabilisation of organic matter
Poehlker et al., 2012). In contrast, the size of pollen
performed under aerobic conditions (Beffa et al., 1998;
generally ranges between 10 and 100 μm. Pollen
Hryhorczuk et al., 2001; Sanchez-Monedero et al.,
also displays a wide range of shapes and structures.
2005; Avery et al., 2012; Wéry, 2014). Therefore, a
It is much more familiar to the public because it is
substantial increase in activity has become apparent
often visible to the eye and its adverse health effects
throughout the world in terms of the use of local
on those with hay fever are well known. However,
composting facilities to manage and utilise green and
anybody who has encountered “black mould” in damp
food waste (Hryhorczuk et al., 2001; Recer et al.,
bathrooms or “green mould” on bread will also be
2001; Wéry, 2014). This strategy then also leads to a
aware of fungal spores.
reduction in the amount of waste sent to landfill sites.
The air quality data determined for both ambient and
Despite the obvious social benefits of such activities,
occupational environments are affected significantly
it is also known that exposure to composting-released
by the levels of particulate matter (PM) present.
PBAPs (e.g. Aspergillus fumigatus) can be detrimental
The health risks associated with small chemical
to human health (Horner et al., 1995; Simon-Nobbe et
PM (PM10, PM2.5 and PM1), mainly generated by
al., 2007). Concerns then arise because bioaerosols
combustion processes and from non-exhaust vehicle
emitted from composting sites (including home
emissions, are well known (Pöschl, 2005; Cohen
composting) can remain airborne for some time and,
et al., 2005). Therefore, online urban monitoring of
like small chemical PMs, travel well off-site. The
chemical particulates, especially beside roads, is
average size of these spores range between 2 and
now well developed in networks throughout Europe.
10 µm (PM2.5 and PM10) (Simon-Nobbe et al., 2007)
Although the effects of bioaerosols on humans
and so can penetrate deep into the inner lining of
and plant life have been studied for many years
1Online Bioaerosol Sensing (OLBAS)
the lungs into the alveoli. This behaviour can lead to monitoring should be carried out at times of high site
numerous health problems linked with agricultural activity, e.g. turning, shredding and screening.
and composting work, including farmers’ lung,
The current regulation for the licensing and operation
aspergilliosis, pneumonitis and chronic obstructive
of compost sites set by the English Environment
pulmonary disease (COPD) (Millner et al., 1980;
Agency [also adopted by the Environmental
Simon-Nobbe et al., 2007; Chaudhary and Marr, 2011).
Protection Agency (EPA) and local authorities] is
Furthermore, the presence of PBAPs has long for their management to demonstrate so-called
been associated with asthma and other reactive “acceptable levels” of (1) mesophilic bacteria [103 CFU
airway diseases such as allergic bronchopulmonary (colony-forming units) m–3] and (2) the fungal spore
mycoses, rhinitis, allergic sinusitis and hypersensitivity A. fumigatus (500 CFU m–3) (Pankhurst et al., 2011;
pneumonitis (Simon-Nobbe et al., 2007; Chaudhary Williams et al., 2013). These benchmarks have been
and Marr, 2011). Deterioration in the pulmonary set as a ×10 factor relative to ambient levels. (Few
function of people with chronic asthma and cystic epidemiological studies have been performed to
fibrosis are of particular concern to the medical provide an appropriate limit based on actual health
community. outcomes.) A. fumigatus spores are monitored
because they are a known human pathogen (Horner
Many of the biochemical pathways involved in the
et al., 1995; Fischer et al., 1998; Abba, 2004; Simon-
degradation and transformation processes from green
Nobbe et al., 2007), with compost heaps being a major
waste to fertiliser are now understood, and it has
environmental source. Spore release occurs not only
become clear that airborne bioaerosols are a natural,
because of the internal heating process associated
unavoidable outcome of the processing. Fungal spores
with composting but also because of the intrinsic
are the most abundant of the PBAPs to be found in
thermo-tolerance of the spore (Millner et al., 1977;
many local environments (Womiloju et al., 2003; Elbert
Vincken and Roels, 1984; van der Werf, 1996; Gillum
et al., 2007; Després et al., 2012) and occur wherever
and Levetin, 2008).
decaying vegetation is present, as this is a food/energy
source for the fungus. However, harmful fungal spores Actual number concentrations of bioaerosols present
(containing significant concentrations of hazardous on-site or close by have not been extensively
mycotoxins) can be released at composting sites, characterised at any location. Indeed, the occupational
particularly during activities involving the vigorous monitoring is carried out off-site only for short time
movement of material such as shredding, compost periods (5–15 min), with the results returned in
pile-turning and screening of green-waste deliveries CFU m–3 some days later to the local management
(Millner et al., 1980; Hryhorczuk et al., 2001; Sanchez- (Williams et al., 2013; O’Connor et al., 2015).
Monedero and Stentiford, 2003; Sanchez-Monedero et Therefore, no real-time indication of increases in
al., 2005; Taha et al., 2005, 2006; Gillum and Levetin, ambient bioaerosol are ever made on-site even
2008; Pankhurst et al., 2011; Wéry, 2014). when the normal agitation processes associated
with commercial composting activities occur or when
There are licensing guidelines set by national and
deliveries are made.
regional environmental agencies for commercial
composting operations. These primarily focus on Reports on emissions from waste management sites
site workers and people inhabiting the surrounding have indicated that levels in the 102–104 CFU m–3
areas. On Irish composting sites the monitoring of a range can be measured (Frederickson et al., 2013;
limited number of harmful biological particles, such Fletcher et al., 2014). Interestingly, there did not
as A. fumigatus, is performed only once a year for a appear to be a relationship between the age of
short time period, with the results returned some days the media, air flow rate, residence or emission
later to the local management. Therefore, no indication concentrations over a range of sites incorporating
of minute-to-minute or hour-to-hour changes in several different biofilter abatement systems, which
bioaerosol releases are made, even when the normal often incorporate adsorption materials. Furthermore,
agitation processes associated with the composting in contrast to odour removal, the performance of the
process occur or when deliveries are made. The biofilters for bioaerosol reduction efficiency was found
English Environment Agency guidance specifies that to be extremely variable and the same abatement
2J. Sodeau et al. (2014-CCRP-MS.19)
systems did not appear to be able to achieve because PM the size of most fungal spores can be
significant, consistent removals of A. fumigatus, dispersed over hundreds of kilometres (van der Werf,
even during 1-day periods at a single site. In fact, 1996; Sanchez-Monedero et al., 2005; Wéry, 2014).
some of the tested abatement systems produced
Local residents (and certain crops) in the site vicinity
an increase in A. fumigatus, with the presence
have the potential to be harmed because many
of a scrubber appearing to have little effect on
bioaerosols are allergenic or plant pathogenic. The
performance regardless of whether the subsequent
four genera most commonly associated with the
biofilter was open or closed. It was concluded that
development of allergies are Alternaria, Cladosporium,
an enclosed biofilter system results in a ≈30–45%
Penicillium and Aspergillus (Twaroch et al., 2015). The
drop in A. fumigatus, whereas an open biofilter leads
first two make large ambient contributions to the fungal
to ≈40–80% reductions. The detailed understanding
spore load in continental climates (Corden et al., 2003;
of localised effects on the air related to the different
Grinn-Gofroń and Rapiejko, 2009; Grinn-Gofroń et
abatement systems used awaits experimental scrutiny
al., 2015); however, in Mediterranean regions, all four
by the waste management site operators and the
are abundant (Rodolfi et al., 2003; Pepeljnjak and
licensing authorities.
Klarić, 2005; El-Akhdar and Ouda, 2009; Lanier et al.,
In summary, the data outlined in the above reports and 2010; Fernández-Rodríguez et al., 2014; Pasquarella
obtained from a variety of sites suggest that: et al., 2015; Pyrri and Kapsanaki-Gotsi, 2015). The
actual range of fungal spore types (propagules) along
The concentration of bioaerosols in the exhaust
with their number concentrations found at waste
air from enclosed biowaste treatment facilities
management sites or in farms, cities and towns have
is extremely variable and appears to be depen-
been little studied in Ireland to date. In other words,
dent upon the site operating parameters at the
epidemiological studies relating human health to
time of sampling and, from the data obtained,
the small-sized bioaerosol releases specific to the
it was not possible to determine if the different
composting process cannot be performed currently.
treatments systems or the type of waste being
treated produces a typical bioaerosol emission Although the human health aspect is the reason why
profile. (Frederickson et al., 2013; Fletcher et licensing authorities in some countries have put in
al., 2014) place regimes where regular monitoring of bioaerosols
is performed, particularly in the early years of site
Such a statement indicates the complexities operations, there are also potential adverse effects on
associated with measuring bioaerosol releases from crops and other plants. For example, Ustilago maydis
composting sites. The problems of inconsistency may is a smut fungus that is pathogenic to maize (Carlile
be related not only to the wide range of variables et al., 2001; Brefort et al., 2009) and is associated
involved in biowaste treatments (temperature, with the type of green waste delivered by brewers and
humidity, pH, agitation, etc.) but also to the reliability distillers to composting sites.
and accuracy of the current measurement strategy
In contrast to fungal spores, the size of pollen is
employed, which involves Andersen samplers, as
> PM10. The main function of pollen is to transport
discussed in section 1.2, and general parameters such
DNA/genetic material in plants, but its dimensions and
as TVCs (total viable counts).
biochemical composition have led to many studies
Composting plant operations in the UK that are located on its potential health effects (Mullins and Seaton,
< 250 m from any other property in the vicinity must 1978; Garrett et al., 1998; Kirkhorn and Garry, 2000).
complete a Specific Bioaerosol Risk Assessment for For example, components such as nicotinamide
the Environment Agency. Furthermore, the increasing adenine dinucleotide phosphate (NADPH) oxidases
commercial growth of the industry is expected to lead cause oxidant stress in the lung epithelium and drive
to increased emissions of bioaerosols (Sanchez- allergic lung inflammation, whereas the presence of
Monedero et al., 2005). This aspect is currently adenosine represents a potent immunoregulatory
causing concerns related to potential occupational substance (Gilles et al., 2011). Thus, allergens can
health impacts on staff, clients and visitors at the become trapped in the nasopharynx and trachea,
facilities, as well as people living in the region, leading to adverse reactions such as pollinosis (hay
3Online Bioaerosol Sensing (OLBAS)
fever), diseases such as asthma and even mortality generated in the UK. This situation is quite different
(Nunes and Ladeira, 2007; D’Amato et al., 2001). from the period between 1976 and the early 2000s,
In this regard, it has been reported that, for studies when a predictive model was developed for pollen
performed in the Netherlands, a strong association measurements made in Dublin, Dartry and Baldonnel.
exists between the day-to-day variation in pollen The service provided members of the public who
concentrations and death owing to cardiovascular read the Irish Times with country-wide pollen levels
disease and COPD (Brunekreef et al., 2000). In over the hay fever season. This Irish-based network
addition, there is evidence that, under wet conditions is no longer functioning, which means that Ireland is
or during thunderstorms, pollen grains may be one of only five countries in Europe (including Bosnia
ruptured to make sub-pollen units and/or release a and Herzegovina and Moldavia) that cannot be part
portion of their biochemical content, thereby inducing of the European Aeroallergen Network (EAN) Pollen
asthmatic reactions in patients with pollinosis (D’Amato Database and therefore cannot access data used by
et al., 2012). scientists to create statistics and calculate climate
change trends for the distribution of pollen on national
There are, of course, linkages between the above
and international scales.
health issues and climate change, because increased
air temperatures significantly influence pollen growth However, a few research-based studies on pollen and
patterns whereas temperature as well as relative spores have been performed in order to investigate
humidity and rainfall contribute to airborne number atmospheric concentrations of selected PBAPs in
concentrations of fungal spores. Longer pollination Ireland. These include grass pollen, Cladosporium,
seasons and increasingly widespread releases of basidiospores and other spores (with Aspergillus,
fungal spores are then likely to increase the duration of Penicillium and Botrytis counted jointly) (McDonald
allergic, respiratory and cardiac reactions in sensitised and O’Driscoll, 1980). The studies centred on airborne
subjects. species detected in Galway City during the late
1970s. During a similar period of time, collections of
In light of these direct impacts on the general public
Cladosporium and basidiospores were made in Dublin,
it is important that society develops “early warning”
with the results analysed much later, in 1990 (Stephen
systems for bioaerosol detection at national and local
et al., 1990). A more recent study has focused on
levels. Recognising these pressures, the USA, France,
the use of culture techniques for sampling ambient
Switzerland and the UK have been mounting research-
fungal spore concentrations in Galway (O’Gorman
led campaigns to achieve such an aim over recent
and Fuller, 2008). Since then, few aerobiological
years. For example, the UK has many established
surveys have been carried out in Ireland but the
aerobiological monitoring stations, often organised
International Phenological Garden network does
by the British Aerobiology Federation. Therefore,
exist and comprises four sites (Valentia Observatory,
many studies relevant to spore concentrations, their
JFK Arboretum, Johnstown Castle and the National
distributions and their correlation with meteorological
Botanic Garden), with phenological data records
parameters have been performed (Harvey, 1967;
extending back to the 1960s. At these locations,
Corden and Millington, 1994; Hollins et al., 2004).
chosen observers record and monitor phenophases
Monitoring campaigns for ambient Cladosporium
such as budburst, flowering and leaf-fall for a range
concentrations and also the fungal genus Ganoderma
of species, including downy birch (Betula pubescens).
have been carried out throughout the country
In fact, a recent publication using computer modelling
(Sreeramulu, 1963; Lewis et al., 2000; Hollins et al.,
to determine possible climate change effects on birch
2004). Furthermore, related studies have highlighted
budburst has been built on such observational work
the significance of Alternaria, in conjunction with other
recorded at Valentia Observatory between 1969 and
PBAPs, in the exacerbation of symptoms in those with
2012 (with only the 1994 record missing) (Caffarra et
asthma (Langenberg et al., 1977; Corden et al., 2003).
al., 2014).
In contrast, Ireland’s current capability to provide
It is of little use to the public, particularly those with
accurate, indigenous bioaerosol assessments is
allergies and respiratory disease, to simply be made
limited. Even the summer pollen count is currently
aware of historical records of PBAPs in their locality.
based on monitoring data and models obtained and
4J. Sodeau et al. (2014-CCRP-MS.19)
It is equally suspect not to provide staff and visitors which can be deployed close to the source of the
to sites known to release bioaerosols with real-time bioaerosol emissions (Kenny et al., 1999), and (2)
measurements alongside real-time reporting that at the the Andersen sampler, an impaction device that is
very least enumerate the number of potentially harmful prone to overloading and cannot be used reliably in
particles in the air. The problem is that traditional highly contaminated environments (Solomon and
(impaction-based) methods for identifying and counting Gilliam, 1970). Although both of these culture-based
fungal spores and pollen are time-consuming and techniques can be more exact in their determination
labour intensive. of differing species that cannot be detected using
optical microscopy, they also require considerable time
Real-time monitoring of airborne pollen and other
for the sampled fungal spore to grow on a suitable
PBAPs using a variety of spectroscopic and light
agar medium. Furthermore, the culture-dependent
scattering techniques represents an area of growing
method suffers from the possibility of providing an
development and consequence (Pan et al., 1999,
underestimation of the total fungal content because a
2011b; Agranovski et al., 2003; Kanaani et al., 2008;
portion of the spores is generally unviable (Mandrioli et
Gabey et al., 2010; Huffman et al., 2010; Mitsumoto
al., 2003). Therefore, culture-independent studies are
et al., 2010; Kiselev et al., 2011; Sivaprakasam et al.,
now performed, but only on occasion because of their
2011; Healy et al., 2012a). This approach, in tandem
expense, using quantitative polymerase chain reaction
with traditional monitoring strategies, forms the basis
(q-PCR) sequencing (Chen and Li, 2007; Le Goff et
of the Online Bioaerosol Sensing (OLBAS) project.
al., 2011; Pankhurst et al., 2012; Galès et al., 2015).
Notwithstanding its inherent limitations, Andersen
1.2 Impaction Methods for the
sampling remains the current method of choice used
Detection of Fungal Spores
for determining the concentrations of mesophilic
In the past, detection techniques for fungal spore bacteria and A. fumigatus at compost sites in Ireland.
types were generally confined to methods such as The samples are collected, after pumped-air impaction,
the impaction of air samples onto adhesive sample onto agar gel plates, which are then returned to the
substrates before analysis using optical microscopy, laboratory for further cultivation and counting (Després
although scanning electron microscopy has also been et al., 2012). However, the procedure allows for the
employed (Vestlund et al., 2014). This undertaking measurement of spores and bacteria that are viable
relies on the intrinsic skill of the identifier and is also for specific media only. More importantly, only a
very labour intensive because careful preparation small volume of air is collected, off-site, for a short
of the substrate is required for accurate analysis. 5- to 15-min period of time (Hryhorczuk et al., 2001)
In fact, the approach represents one that is often because, as the micro-organisms are impacted directly
employed for pollen counting and forecasting, but onto the agar surface, there is a danger of the plate
such a combination of techniques has also been becoming overloaded in environments that give rise
used previously to show that very large number to high concentrations. Clearly, composting sites are
concentrations of spores can build up at agricultural a good example of this possibility and so sampling
sites. For example, using the above methodology it rarely occurs on-site; rather, sampling takes place
has been shown that air sampled from a cowshed can 100–250 m upwind and downwind, off-site from the
contain as many as 16,000,000 spores per m3; the source (Eduarda and Heederik, 1998; Cartwright et
preponderance of these spores was deemed to be al., 2009; Williams et al., 2013). Commercial costs for
Aspergillus–Penicillium as a grouping because they such a test can currently approach €10,000, with the
are difficult to distinguish by optical microscopy as their measurements being performed only once a year.
sizes and morphology are very similar (Baruah, 1961).
This situation means that detailed long-term profiles
Other, more modern methods for determining of green-waste site bioaerosol emissions cannot
fungal spore concentrations and identifying be constructed as a function of important variables
species include (1) the Institute of Occupational such as site location, weather conditions or agitation
Medicine (IOM) (inhalable dust) filtration sampler, activities such as turning and loading.
5Online Bioaerosol Sensing (OLBAS)
1.3 Impaction Methods for the is applied for predictive purposes. The information may
Detection of Pollen take days to disseminate to the public.
Although the existence of flowering pollen “dust” In Ireland, the daily pollen count published in
has been recognised since about 1540, it was only newspapers or specialist websites comes from
the development of optical microscopy some 200 impaction collections made near Worcester (and
years later that allowed us to establish their differing elsewhere) in England. The UK Met Office then
shapes, sizes and colours (Kennedy and Wakeham, provides predictions such as “low”, “moderate”, “high”
2015). In fact, it was not until the 1950s that JM Hirst or “very high” as blanket descriptions for four large
invented an air sampler that allowed the detection and regions of the island. No information on allergenic
capture of “air flora”, such as bacterial spores, fungal fungal spore levels is available despite the fact that
spores and pollen, to become routine. The device has their sizes are found in the PM2.5 range and can
subsequently become known as the Hirst trap. Further have adverse health effects on those at risk, such as
modifications were later made to the device (e.g. Hirst- asthmatics.
type Burkhard volumetric trap or the “whirling arm”)
but its essential nature and use continue to this day
1.4 Spectroscopic, Real-time Methods
(Lacey and West, 2007; Caruana, 2011).
for the Detection of PBAPs
The commercial instrument SporeWatch: Electronic
Light-absorbing chromophores such as tryptophan,
Spore and Pollen Sampler (manufactured by Burkard
tyrosine, flavins and NADPH are present in PBAPs;
Scientific, Uxbridge, UK) was used in the OLBAS
these chromophores also fluoresce (Roshchina and
project to collect spore and pollen samples, in line with
Karnaukhov, 1999; Roshchina, 2003; Roshchina et al.,
many previously published reports. It was positioned
2004; Roshchina, 2008; O’Connor et al., 2011, 2014a).
3 m from the ground. A narrow orifice, directed into
Hence, real-time bioaerosol detectors employing light-
the wind, sucks in fungal spores onto a silicone tape
induced fluorescence (LIF) quantification techniques
surface that is moved across the orifice at 2 mm hour–1,
have been developed over the last 25 years. The
with a suction rate of 10 L min–1. The silicone tape is
techniques of data filtering are now much more
adhered onto a rotating drum with a 7-day sampling
advanced and so it is now relatively straightforward to
period. At the end of this time the drum is returned
distinguish between fluorescing chemical particles and
to the laboratory and the tape cut into seven equal
droplets such as secondary organic aerosols (SOAs)
segments, each representing a 24-hour period, i.e. a
and PBAPs. Nonetheless, it is generally accepted that
sample comprising 1 day of collection is deposited on
the primary measurements of the LIF techniques give
a tape area of 48 × 14 mm (Hirst, 1952), which is then
number counts of fluorescing aerosol particles (FAPs),
affixed to a microscope slide. The microscope slides
which include PBAP contributions.
were prepared, stored in a protective casing and sent
to the University of Extremadura, Badajoz, Spain, One of the first available reports on the real-time
where the counting was performed by members of the monitoring of bioaerosols was published in 1990. It
aerobiology research group. The optical microscope was based on a rapidly scanning light detection and
used for counting was a Nikon Eclypse model with a ranging (LIDAR) system called the laser cloud mapper
magnification of ×1000. (LCM); this was operated to determine its sensitivity
for the remote characterisation of airborne biological
This off-line strategy is, of course, quite labour
organisms such as Bacillus subtilis var. niger sp.
intensive and requires considerable training to prepare
globiggi in spore form (Ho et al., 1990). However,
the samples and perform the optical analyses. The
within 5 years the use of fluorescence plus optical
results give only a scaled-up estimate for the numbers
scattering measurements had become established
of impacted PBAPs but accurate identification of
by military organisations such as the US Office for
particles > 2 µm in size is obtainable with experienced
Naval Research, using prototype devices such as
operators using high-magnification microscopes. The
the single particle fluorescence analyser (SPFA) and
data is then made available to bodies such as Meteo
the fluorescence aerodynamic particle sizer (FLAPS)
Swiss where a meteorological wind dispersion model
(Ho et al., 1999; Eversole et al., 2001). However, it
6J. Sodeau et al. (2014-CCRP-MS.19)
was not for another 5 years that publications began Data are collected on a dedicated computer and stored
to appear that were directed more towards the use of for analysis using multi-variant statistical packages.
such technology for environmental analytical purposes Increasingly, these methods are based on the use of
(Gabey et al., 2010; Huffman et al., 2010; Pan et al., machine-learning algorithms and pattern recognition
2011a; Healy et al., 2014). that require computer programmes such as MATLAB
(MathWorks, Inc., USA). It is this step that currently
The wideband integrated bioaerosol sensor,
represents the most challenging task for distinguishing
universally called WIBS, was produced and designed
between PBAPs, non-fluorescent particles and
originally by Professor Paul Kaye and co-workers
fluorescing chemical pollutants because very large
at the University of Hertfordshire, UK (Kaye et al.,
amounts of data can be collected in a campaign
2005). Newer versions are now commercially available
(> 10,000,000 particles with five variable parameters
from Droplet Measurement Technologies (DMT).
for each).
WIBS is currently the most popular technique for
monitoring PBAPs in real time. In summary, WIBS is In the OLBAS project, a WIBS-4 was used to monitor
an online fluorescence spectrometer with the ability airborne particle releases from a green-waste
to characterise the sizes and asymmetry/asphericity management site to produce real-time bioaerosol
(shape) of individual, fluorescent and non-fluorescent profiles. A novel instrumental prototype called the
particles. It does so by evaluating laser scatter multi-parameter bioaerosol spectrometer (MBS) was
parameters both forward and sideways along with also deployed in one of the field campaigns because
the spectrally unresolved fluorescence intensity of it provides higher resolution spectral distributions than
single particles at a millisecond time resolution. The the WIBS approach.
exact modus operandi of this instrument has been
Pollen was monitored using a modified version of
demonstrated in a number of publications, described
the WIBS-4 instrument, which was subsequently
below. Briefly, fluorescence intensities resulting from
termed the WIBS-4+. Essentially, the instrumental
two xenon lamp excitations (280 nm and 370 nm)
modifications allowed (1) detection of particles
are evaluated using three detector channels, termed
between 0.5 and 40 μm and (2) extension of the
FL1_280, FL2_280 and FL3_370. These channels
fluorescence detection wavelength range to 700 nm.
capture the total, spectrally unresolved fluorescence
signals over two wavelength ranges, with FL1 = 310– The OLBAS project links to the outcomes of previous
400 nm and both FL2 and FL3 = 420–650 nm. research sponsored by the EPA and awarded as
Therefore, each particle is excited sequentially at “Analyses of the Development and Occurrence of
280 nm (FL1 and FL2) and then 370 nm (FL3). In Biological and Chemical Aerosols (BioCheA)”. The
total, WIBS datasets consist of particle numbers, size associated synthesis report (CCRP Report 18) was
and “shape” parameters as well as three separate published in 2012 and is entitled “A New Approach to
fluorescent intensity properties (if fluorescent). Bioaerosol Monitoring in Ireland” (http://www.epa.ie/
pubs/reports/research/climate/ccrpreport18.html).
The initial prototypes of the WIBS technology also
incorporate a size selection utility acting via a dual gain
function. This feature allows the operator to designate 1.5 Objectives of OLBAS
the size fraction of the ambient air sample on which
●● To provide and publish a comprehensive review of
to focus and perform data analysis. Hence, there are
sources, monitoring methods, removal pathways
two sensitivity settings for WIBS-4: high gain (HG)
and number concentrations of bioaerosols/PBAPs
and low gain (LG). For this model and older prototype
in ambient conditions and at waste management
versions, particles of sizes between 0.5 and 12 μm are
sites. This review was published as “Bioaerosol
monitored in HG whereas LG allows particles from 3
monitoring of the atmosphere for occupational
to 31 μm to be analysed. Therefore, the HG mode is
and environmental purposes” in Comprehensive
suitable for fungal spore detection and the LG mode is
Analytical Chemistry (Sodeau and O’Connor,
suitable for some spores and some pollen. In contrast,
2016).
the newer version (WIBS-4A) has a single gain, which
●● To provide a scientific foundation for assessing
evaluates particles between 0.5 and 15 μm, a range
the potential application of the WIBS and related
essentially suited for fungal spore detection.
7Online Bioaerosol Sensing (OLBAS)
real-time technology to the online detection of limited database that exists for pollen and spore
fungal spores such as A. fumigatus at a green- measurements in Ireland.
waste management site in Ireland. ●● To deploy novel instrumentation at the Met
●● To compare and contrast the real-time monitoring Éireann site to enhance the capabilities of WIBS
results with those obtained by traditional to detect pollen in real time.
Andersen sampling and coupled impaction/optical ●● To assess the benefits of the development of an
microscopy techniques. indigenous pollen monitoring network for Ireland.
●● To deploy WIBS and a SporeWatch impaction
device at the Met Éireann Valentia Observatory These objectives for OLBAS, as set in the original
site at Cahersiveen and thereby to improve the proposal, were achieved as described in Chapters 2
and 3.
82 Field Campaigns at a Green-waste Management Site in
Ireland (2014–2016)
2.1 Site Description delivery/loading/green-waste area. The bio-filter was
positioned at the north end of the site.
The PBAP/bioaerosol monitoring campaigns were
performed at a single commercial green-waste/ Most of the monitoring studies were performed
composting site in Ireland. The site has a 6000-tonne outdoors, with the equipment located close to
capacity per year for source-segregated green windrows, as shown in Figure 2.1. However, as a
wastes such as grass, leaves and grain delivered control, the spectroscopic instrumentation was located,
from domestic and commercial sources located over on occasions, in the staff quarters and the site office.
different municipalities in the surrounding areas. The annual Andersen grab sampling for the site was
Traditional, off-line impaction methods (Andersen carried out ≈ 100 m upwind (north-east) and then
sampling and Hirst trap) were employed alongside downwind (south-west). The point sources of the
newer spectroscopic, online instrumentation to detect bioaerosols were not monitored.
and count individual particles, as described in sections
The site was located in a remote, rural location ≈ 6 km
1.2 and 1.4. Meteorological measurements such as
due north of the Irish coastline and therefore only
temperature, wind speed, wind direction and relative
sea-salt particles were expected to make any large
humidity were obtained using a combination of a Davis
contribution to aerosol loading other than PBAPs.
Vantage-Pro2 permanent site station and a mobile
South-westerly winds from the Atlantic generally
Casella Nomad weather station.
dominate weather patterns in Ireland although
At the site, the green waste was shredded variations in speeds and directions often occur.
mechanically and stored in both open windrows and
The typical working week for the employees at the
composting vessels, where the compost was left to
facility is 08:30–17:00 from Monday to Thursday and
mature. A schematic of the arrangement is shown in
08:30–16:00 on Friday. The site is not open at the
Figure 2.1. The staff offices were built ≈ 20 m from the
weekend. During the operating hours of the facility
outdoor product compost area and ≈ 20 m from the
Figure 2.1. A schematic of the green-waste site used for the three field campaigns.
9
Figure 2.1You can also read