2Q/1H2020 RESULTS 7 August 2020 - Investor Relations

Page created by Cecil Hayes
 
CONTINUE READING
2Q/1H2020 RESULTS 7 August 2020 - Investor Relations
2Q/1H2020 RESULTS
7 August 2020
2Q/1H2020 RESULTS 7 August 2020 - Investor Relations
FORWARD-LOOKING STATEMENTS

The following presentation may contain forward-looking statements by StarHub Ltd
(“StarHub”) relating to financial trends for future periods.

Some of the statements in this presentation which are not historical facts are statements of
future expectations with respect to the financial conditions, results of operations and
businesses, and related plans and objectives. These forward-looking statements are based on
StarHub’s current views, intentions, plans, expectations, assumptions and beliefs about future
events and are subject to risks, uncertainties and other factors, many of which are outside
StarHub’s control. Important factors that could cause actual results to differ materially from the
expectations expressed or implied in the forward-looking statements include known and
unknown risks and uncertainties. Because actual results could differ materially from StarHub’s
current views, intentions, plans, expectations, assumptions and beliefs about the future, such
forward-looking statements are not and should not be construed as a representation, forecast
or projection of future performance of StarHub. It should be noted that the actual performance
of StarHub may vary significantly from such statements.

                                                                                                     2
2Q/1H2020 RESULTS 7 August 2020 - Investor Relations
KEY THEMES

01           02           03
2Q2020       GEARING UP   GUIDANCE &
HIGHLIGHTS   FOR 5G       OUTLOOK

                                       3
2Q/1H2020 RESULTS 7 August 2020 - Investor Relations
01

2Q2020
HIGHLIGHTS

             4
2Q/1H2020 RESULTS 7 August 2020 - Investor Relations
2Q2020 AT A GLANCE
    S$453.4M                     18.0% YoY1                                                          MOBILE
       TOTAL
      REVENUE                    10.4% QoQ 2                S$143.4M
                                                                                25.4% YoY1      S$30          23.6% YoY1     1,453K            1.6% YoY1
                                                               REVENUE                           ARPU                          SUBS
                                                                                12.3% QoQ 2     (POSTPAID)    12.1% QoQ 2    (POSTPAID)        0.9% QoQ 2
    S$376.2M                     15.0% YoY1
      SERVICE                                                                                        PAY TV
      REVENUE                    7.1% QoQ 2
                                                                                27.6% YoY1                    10.9% YoY1                       13.2% YoY1
                                                               S$46.9M                          S$39                          324K
    S$118.5M                     15.8% YoY1                     REVENUE         0.1% QoQ 2       ARPU         4.8% QoQ 2       SUBS            0.7% QoQ 2
       SERVICE
       EBITDA3                   5.8% QoQ 2
                                                                                                 BROADBAND

         31.5%                   0.3% pt YoY1
                                                               S$43.2M
                                                                                4.2% YoY1                     2.7% YoY1                        1.5% YoY1
                                                                                                S$28                          502K
     SERVICE
                                 0.4% pt QoQ 2                  REVENUE         3.5% QoQ 2       ARPU         3.3% QoQ 2       SUBS            0% QoQ 2
  EBITDA MARGIN

                                 5.6% YoY1                        NETWORK SOLUTIONS                                       CYBERSECURITY
      S$37.3M
     NET PROFIT                                                                     1.2% YoY1                                             10.1% YoY1
(Attributable to shareholders)
                                 7.3% QoQ 2                    S$102.8M                                            S$39.8M
                                                                 REVENUE            13.8% QoQ2                      REVENUE               36.2% QoQ 2
    S$155.5M                     185.1% YoY1
     FREE CASH
       FLOW                      30.8% QoQ 2     1 Refers to 2Q2020 vs 2Q2019
                                                 2 Refers to 2Q2020 vs 1Q2020                                                                   5
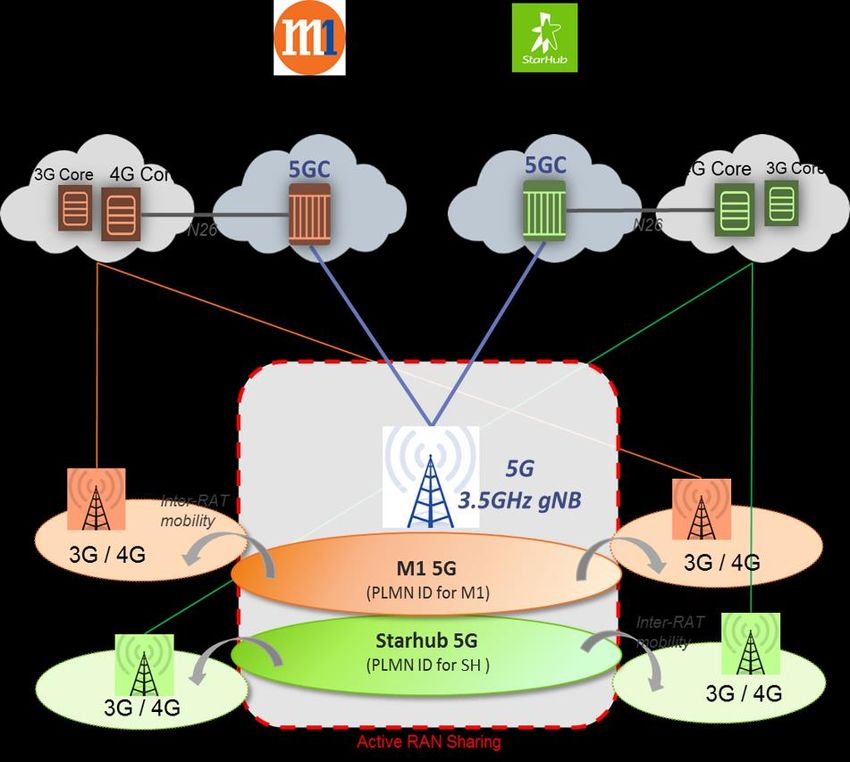
2Q/1H2020 RESULTS 7 August 2020 - Investor Relations
FINANCIAL OVERVIEW
    S$'M                                                                     2Q2020                        2Q2019                    Change (%)                  1H2020          1H2019          Change (%)
    Total Revenue                                                              453.4                         552.8                         (18.0)                959.6           1,149.6           (16.5)
    Service Revenue                                                            376.2                         442.4                         (15.0)                781.1           886.7             (11.9)
    Operating Expenses                                                        (418.9)                       (495.6)                        (15.5)                (867.3)        (1,020.3)          (15.0)
    Other Income                                                                17.3                             0                         N.M. 3                 18.8             0.1             N.M. 3
    EBITDA                                                                     129.3                         146.4                         (11.7)                265.5           308.3             (13.9)
    Service EBITDA1                                                            118.5                         140.8                         (15.8)                244.2           290.4             (15.9)
    Service EBITDA Margin (%)                                                   31.5                          31.8                     (0.3) % pts                31.3            32.8           (1.5) % pts
    Net Profit After Tax
                                                                                37.3                          39.5                          (5.6)                 77.4            93.5             (17.2)
    Attributable to shareholders
    Free Cash Flow2                                                            155.5                          54.5                         185.1                 274.6            75.9             N.M. 3
                                                                                                 As at 30 June 2020                                                        As at 31 March 2020
    Net Debt to EBITDA (x)                                                                                    1.29                                                                1.40

    •   Other Income growth was mainly due to $15.7M Job Support Scheme payouts recognised in 2Q2020, other income grant and recovery
        of tunnel fees from TPG in 1H2020
    •   Higher free cash flow due to higher cash from operating activities and lower Capex payments

1 Service EBITDA = EBITDA less (Sales of Equipment – Cost of Equipment)
2 Free Cash Flow refers to net cash from operating activities less purchase of property, plant and equipment and intangible ass ets in the cash flow statement
5 N.M. denotes Not Meaningful
                                                                                                                                                                                                            6
* Numbers may not add up due to rounding / TTM = Trailing Twelve Months
2Q/1H2020 RESULTS 7 August 2020 - Investor Relations
MOBILE
                           YOY PERFORMANCE & COMMENTARY                                            QOQ PERFORMANCE

POSTPAID                          • Lower postpaid ARPU due to lower roaming, VAS and data
              S$40       S$30       usage revenues as a result of COVID-19 impact                  S$34
   ARPU                                                                                                          S$30

POSTPAID     1,477        1,453   • Average monthly churn rate in 2Q2020 was 0.8% (1Q2020:         1,466
 SUBS (K)                                                                                                            1,453
                                    1.0%; 4Q2019: 1.1%; 2Q2019: 1.1%)

PREPAID                           • Lower prepaid subscriber base due to overall drop in tourist
              S$14       S$10                                                                       S$11
  ARPU                              numbers as a result of COVID-19                                              S$10

 PREPAID
 SUBS (K)    789          634                                                                       704               634

SEGMENT                           • Mobile service revenue declined 25.4% due to decrease in
REVENUE
   (S$’M)                            ‒ Postpaid ARPU;
                                     ‒ Prepaid revenues;
                                     ‒ Offset by higher voice usage
               192.3                                                                                 163.5
                       143.4      • Overall average data usage was 10.0Gb (1Q2020: 10.6Gb;                     143.4
                                    4Q2019: 9.9Gb; 2Q2019: 7.5Gb)

              2Q2019   2Q2020                                                                      1Q2020     2Q2020
                                                                                                                             7
2Q/1H2020 RESULTS 7 August 2020 - Investor Relations
PAY TV
                         YOY PERFORMANCE & COMMENTARY                                               QOQ PERFORMANCE

   ARPU     S$44                           • Lower ARPU and subscriber base due to
                                   S$39      promotional activities relating to the cable-   S$38                     S$39
                                             to-fibre migration offered in FY2019

SUBS (K)    374                            • 1Q2020 average monthly churn rate
                                             reduced to 0.4% (1Q2020: 0.5%; 4Q2019:          327                      324
                                   324       0.7%; 2Q2019: 2.1%)

SEGMENT                                    • YoY revenue decrease due to lower
REVENUE                                      ARPU and subscriber base
   (S$’M)
                  64.7
                                 46.9                                                          46.8               46.9

              2Q2019            2Q2020                                                       1Q2020             2Q2020

                                                                                                                             8
2Q/1H2020 RESULTS 7 August 2020 - Investor Relations
BROADBAND
                          YOY PERFORMANCE & COMMENTARY                                                    QOQ PERFORMANCE

                                                      • Lower YoY ARPU due to promotional
  ARPU      S$29                          S$28          activities relating to the cable-to-fibre
                                                                                                    S$27                S$28
                                                        migration offered in FY2019

                                                      • 1Q2020 average monthly churn rate
SUBS (K)     509                          502           reduced to 0.3% (1Q2020: 0.4%;              502                      502
                                                        4Q2019: 0.5%; 2Q2019: 1.0%)

SEGMENT                                               • YoY revenue decrease due to lower
REVENUE                                                 ARPU achieved
   (S$’M)
                                  (1.5)    One-time   • Recognised one-time rebate extended                                 (1.5)   One-time
                                           rebate                                                                                   rebate
                                                        to customers due to service disruption
                                                        in April 2020
                   45.1          43.2                                                                 41.7                  43.2

              2Q2019           2Q2020                                                                1Q2020            2Q2020

                                                                                                                                       9
2Q/1H2020 RESULTS 7 August 2020 - Investor Relations
ENTERPRISE
                              NETWORK SOLUTIONS                                                                   CYBERSECURITY SERVICES
SEGMENT REVENUE                                                                Data & Internet1    SEGMENT REVENUE
(S$’M)                                                                         Managed Services2   (S$’M)
                                                                               Voice Services1

                104.1                                              102.8
                12.3                      90.4                     10.1
                24.8                      10.7                     18.5
                                          17.8
                                                                                                                                   62.4
                67.0                                                74.3                                        36.2                                  39.8
                                          61.9

              2Q2019                    1Q2020                   2Q2020                                       2Q2019             1Q2020             2Q2020

•       Higher YoY Data & Internet revenue due to one-off $10M revenue                             •    10.1% YoY growth largely contributed by the consolidation of
        from delivery of data transmission equipment                                                    Ensign from 4Q2018 and higher business demand
•       Managed Services revenue declined YoY due to fewer project                                 •    Lower QoQ revenue growth due to more project completions
        completions during the quarter and delayed customer spending                                    in 1Q2020
        resulting from COVID-19 but recovered slightly on a QoQ basis                              •    Widening of 2Q2020 Cybersecurity operating losses to $7.0M
•       Lower Voice Services YoY due to lower domestic and international                                compared to a $1.0M loss in 2Q2019; 1H2020 operating
        voice traffic resulting from COVID-19 impact                                                    losses narrowed to $2.1M from a loss of $12.4M in 1H2019

1   SmartUC & SIP Trunking have been reclassed from Data & Internet to Voice Services
2   Managed Services include Analytics, Cloud, ICT solutions and Facility Management                                                                                   10
OPERATING EXPENSES
                              OPERATING EXPENSES (S$’M)                                                    1H2020 COST STRUCTURE (S$’M)
                                                                           Cybersecurity Expenses
                                                                         Other Operating Expenses
               495.6
                37.0                        448.4                                   Cost of Sales                      16.6%                  18.1%
                                              58.3
                                                                          418.9
                                                                           51.4
                 213                                                                                4.9%
                                             182.3                        178.6
    458.5
                               390.1                          367.5                                 5.5%
                245.5                                                                                                                                       21.5%
                                             207.8                        188.9                     0.9%
                                                                                                                   1.3%
                                                                                                     1.3%
              2Q2019                        1Q2020                       2Q2020
•     Excluding cybersecurity expenses, 2Q2020 Opex declined 19.8% YoY and 5.8%                                   11.0% 6.0%               2.4%
      QoQ
•     Absence of one-off cable migration cost in 2Q2019 contributed to YoY decrease in                                                             3.7%
      cost of services                                                                                                              6.6%
•     2Q2020 staff cost lowered YoY due to (i) lower headcount; (ii) reversal of staff              Cost of Equipment Sold                        Operating Leases

      compensation; (iii) reversal of structuring costs relating to IT transformation               Cost of Services                              Marketing & Promotions

                                                                                                    Traffic Expenses                              Loss Allowance for Trade Receivables
•     Lower YoY 2Q2020 operating leases due to (i) rental rebates from COVID-19
      stimulus package; (ii) reversal of base station rental accruals; (iii) one-off refund from    Customer Acquisition Costs                    Repairs & Maintenance

      landlord                                                                                      Cybersecurity – Cost of Sales                 Other Expenses

                                                                                                    Cybersecurity – Other Opex                    Depreciation & Amortisation (“D&A”)
•     2Q2020 D&A lowered YoY due to (i) cessation of a large in 4Q2019 and cable duct
      lease in 1Q2020; (ii) lower PPE depreciation due to shutdown of HFC network in                Staff Costs

      3Q2019                                                                                                                                                                  11
D.A.R.E. TRANSFORMATION PROGRESS
                                                FY2019-2021 Potential Savings & Reinvestment
SUSTAINED COMMITMENT TO
                                                       Planned                                            Reinvestment
TRANSFORMATION                                         Executed

75% Of 3-Year Cost Programme Executed                                               20%
As at 2Q2020                                                                                   >S$210M
                                                                      16%

          DELIVERING
          Market-Leading Customer Experiences        Workforce     Operational       TV         Total    Digitalisation &    Current
                                                    Optimisation   Efficiencies   Operations   Savings   Transformation    Net Savings
                                                                                  & Content                 Initiatives   (As at 2Q2020)

          ACCELERATING                          •     Progress since 4Q2019 update:
          Value Creation from Core Businesses
                                                        ‒ Greater procurement savings from renegotiation of expiring
                                                          contracts

          REALISING                                     ‒ Lowered content cost in line with Pay TV transformation to
                                                          move towards a variable cost structure
          Growth from New Opportunities
                                                •     Staff costs savings relating to IT transformation expected in FY2020

          ENHANCING                             •     Continue to reinvest cost savings into digitalisation and
                                                      transformation initiatives to ensure long-term competitiveness
          Efforts to Transform Digitally
                                                                                                                                      12
PROFIT HIGHLIGHTS
             EBITDA (S$’M)                    PROFIT FROM OPERATIONS (S$’M)

                                                                                     (7.0)   Losses from
    146.4         136.2          129.3                                                       Cybersecurity
                                             57.3                59.3                51.8    Services

  2Q2019         1Q2020         2Q2020      2Q2019             1Q2020            2Q2019

   SERVICE EBITDA (S$’M) / MARGIN (%)                    NET PROFIT (S$’M)
                                                    (ATTRIBUTABLE TO SHAREHOLDERS)
31.8%                               31.5%
                  31.1%

    140.8          125.7          118.5
                                             39.5                40.2                37.3

   2Q2019        1Q2020         2Q2020      2Q2019             1Q2020            2Q2020
                                                                                                     13
STRONG BALANCE SHEET & CASH GENERATION
          Free Cash Flow (S$’M)                                Prudent Capital Management

                                             Net Debt To EBITDA (x)

                                     155.5
                  118.9                                 1.51                   1.40                    1.29
 54.5

2Q2019           1Q2020            2Q2020           4Q2019                  1Q2020                  2Q2020

 Net Cash From Operating Activities (S$’M)    •   Spectrum payments likely in 3Q2020:
                                                    ‒   3.5GHz spectrum payment of S$27.5M (StarHub’s 50%
                                                        share)
                                                    ‒   mmWave annual spectrum fee of ~S$1.2M likely to be paid
                                                        in 3Q2020
                                              •   No refinancing required until 2022
                                     193.5
                  153.9                             ‒   Secured S$300M of committed term loan facilities to
 125.4
                                                        refinance current borrowings due for repayment
                                                    ‒   Additional $300M of committed revolving credit facilities
                                                        secured for drawdown when required
2Q2019           1Q2020            2Q2020
                                              •   Healthy debt headroom to tap growth opportunities                 14
02

GEARING
UP FOR 5G

            15
GEARING UP FOR 5G   2020   June 2020
                           • 5G draft licences & spectrum
                             rights obtained
                           • Nokia selected for JV’s 5G RAN
                             and StarHub’s 5G core network
                           By 2020
                           Commence 5G rollout

                           Expected 5G commercial
                    2021   launch

                    2022   By End-2022
                           SA networks to cover at least half
                           of Singapore

                           Achieve nationwide coverage
                    2025   in 5 years

                                                     16    16
AN EFFICIENT, FUTURE-PROOF NETWORK

Singapore’s First Shared Active Radio Network       1          ACTIVE RADIO NETWORK SHARING
                                                •   Efficient use of resources; cost-efficient rollout
                                                •   Combined site pool, shared 3.5GHz spectrum, antenna, radio base station
                                                    equipment and transmission backhaul

                                                    2          MULTI-OPERATOR CORE NETWORK (MOCN)
                                                •   Separate Core Network, Service Platform, BSS
                                                •   Enables service differentiation and promotes competition

                                                    3          5G SA ARCHITECTURE AT THE ONSET
                                                •   Two 5G Core networks
                                                •   Full 5G capabilities, highly secured, reliable and responsive

                                                    4          ADHERES TO 3GPP RELEASE 16 STANDARDS
                                                •   Supports diverse 5G use cases – e.g. enhanced Mobile Broadband (eMBB), Ultra-
                                                    Reliable Low Latency Communications (URLLC), massive Machine Type
                                                    Communications (mMTC), Network-slicing, Multi-Access Edge Computing (MEC),
                                                    Voice over New Radio (VoNR)

                                                    5          SEAMLESS MIGRATION TO 5G
                                                •   Interworking with existing 3G/4G network
                                                •   Voice & Data continuity between 5G & legacy networks
                                                                                                                              17
NETWORK COLLABORATION

                     Harnessing efficiencies while retaining full service differentiation

 Jointly owned 3.5GHz Spectrum                                                                                                                 Jointly owned 3.5GHz Spectrum
                                                           50% ownership                        50% ownership

             5G Core                                                                  JVCo
                                                                                                                                                            5G Core

                                                                           Shared 3.5GHz Network

          Existing 3G/4G                                            JVCo owned 3.5GHz radio equipment                                                   Existing 3G/4G
     Spectrums and network                                                                                                                         Spectrums and network

                                                                            Leased infrastructure
                                                                   (e.g. sites & fibre from parents and others)

                                       3.5GHz wholesale capacity                                                  3.5GHz wholesale capacity

Services (With Full Differentiation)                                                                                                          Services (With Full Differentiation)

           Consumer                                                                                                                                      Consumer

           Enterprise                                                                                                                                    Enterprise

      Wholesale to MVNOs                                                      Wholesale to MNO                                                      Wholesale to MVNOs
                                                                                                                                                                                     18
NETWORK COLLABORATION

                                                     JVCo Funding / Cost-Sharing

                                                               50% ownership                50% ownership

 Jointly owned 3.5GHz Spectrum                                                                                                                Jointly owned 3.5GHz Spectrum

             5G Core                                                                 JVCo
                                                                                                                                                           5G Core

                                                              •     Standalone SPV
                                                                           Shared 3.5GHz Network
                                                              •     85% funded by debt; 15%
          Existing 3G/4G                                            equity
                                                                    JVCo    (not3.5GHz
                                                                         owned    expected    to be
                                                                                       radio equipment                                                 Existing 3G/4G
     Spectrums and network                                          significant)                                                                  Spectrums and network

                                                              •      All Opex/Capex         and profits to
                                                                             Leased infrastructure
                                                                     be sites
                                                                   (e.g. split& 50:50
                                                                                fibre from parents and others)
                                                                                                                 3.5GHz wholesale capacity
                                                              •
                                       3.5GHz wholesale capacity    Independent management
Services (With Full Differentiation)                                                                                                         Services (With Full Differentiation)

           Consumer                                                                                                                                     Consumer

           Enterprise                                                                                                                                   Enterprise

      Wholesale to MVNOs                                                      Wholesale to MNO                                                     Wholesale to MVNOs
                                                                                                                                                                                    19
5G PROGRESSIVE CAPEX

      NON-5G NETWORK CAPEX COMMITMENTS (S$’M)                  •   Progressive reduction on capex spent on legacy
                                                                   networks over last few years
                         3G/4G Network Capex Commitments
                         Total Capex Commitment Excluding 5G        ‒ To maintain minimal level of Capex (regulatory
                                                                      obligations) required for legacy networks moving
                                                                      forward
            202
                                                                    ‒ Cumulative capex savings to be redirected for 5G
                          175
                                                                      network

Minimal
3G/4G                                                          •   5G capex to be incurred progressively over 5 years
Capex
                                                                    ‒ Based on the 5G network deployment and
            59%                                                       commitment accepted by the IMDA, initial capital
                          56%                  44%                    investment is estimated to be ~$200 million over
                                                                      the five-year period
           FY2018       FY2019              FY2020F
                                                                    ‒ Additional 5G investments may be considered as
                                                                      driven by business demand

                                                                                                                         20
GROWING MOMENTUM:
   5G DEVICES
                                                                                                           GLOBAL 5G PHONE SHIPMENTS2

            >112                               296                                                                             ~200M
        5G Devices                       Oncoming 5G Devices
     Available Globally1                     Announced1

                                                                                                                        19M
                                                                                                                        2019     2020

1 Source:   Global Mobile Suppliers Association – “5G Devices Ecosystem: Member Report June 2020”; As at end-May 2020
2 Source:   CNET, 20 February 2020 – “200 million 5G phones are expected in 2020, analysts say”                                         21
                                                                                                                                         21
EMPOWERING NEW
                        POSSIBILITIES
MOBILE CLOUD                   AR/VR                                 FWA
                                •   Immersive experiential           •   Enterprise wireless
GAMING                              events / live concerts               service – quick, easy
•   High speed, seamless        •   VR gaming                            and secure
    experience                  •   Security clearance               •   Stable & high-res
•   Low Latency = No Lag            (face recognition)                   multi-party video
                                                                         conferences

                MASSIVE IOT                                  ARTIFICIAL
                CONNECTIVITY                                 INTELLIGENCE
                                                             •   Production line monitoring,
                 •   Real-time data connections
                                                                 control and operations for
                     for thousands of IoT
                                                                 Industry 4.0
                     machines
                                                             •   Real-time analytics for drone
                                                                 surveillance
                                                                                                 22
                                                                                                 22
NURTURING THE 5G ECOSYSTEM

StarHub 5G Pop-Up Showcase                                         Pilot VR and AI solutions for applications
                                                                   relating to construction, education, autonomous
 •   Powered by Singapore’s first 5G COW                           vehicles, etc
 •   4 experiential areas:
                                                                                          NYP-StarHub 5G Apex
         –   Cloud gaming                                                                 Centre focusing on
         –   Fixed Wireless Access                                                        Industry 4.0
                                          SHOWCASE                                        applications (e.g.
         –   Multi-Party Video                                                            Manufacturing AI, retail
             Conference:                                                                  video analytics, remote
         –   Augmented Reality                                                            patient monitoring)
                                                                  INDUSTRY
                                                                                          5G SA roaming trials
                                                                    TRIALS

             GSMA Roundtable                                                               Asia 5G – KPMG
     1       Future of 5G; accelerating
             5G adoption
                                                      THOUGHT                      3       Outline of Telecom
                                                                                           operators on 5G
                                                     LEADERSHIP
                                                                                           Perspective

     2       American Chamber of
             Commerce
             Network Security

                                                                                                                     23
03

GUIDANCE
& OUTLOOK

            24
GUIDANCE CHECKLIST

                                                     SUSPENDED                UPDATED
                                                                                                  Lower consumer revenues due to
           SERVICE REVENUE
                                                            1% - 3%             10% - 12%         COVID-19 impact; offset by stronger
                                                            YoY                 YoY               Cybersecurity contributions

               SERVICE EBITDA                         27% - 29%               27% - 29%           No Change
                     MARGIN1

     CAPEX COMMITMENT2                                   6% - 7%               6% - 8%            Excluding spectrum, 5G Capex and
                                                                                                  IT Transformation Capex
                                                        Of Total Revenue       Of Total Revenue

                                                                                                  Committed to dividend policy; Based on
                                                        9.0 cents             2.5 cents           current business conditions and operating
              DIVIDEND/SHARE                            FY2020 Dividend,       1H2020 Dividend    environment, 2H2020 final dividend is
                                                      payable semi-annually       Declared        expected to be ≥2.5 cents

1   Service EBITDA margin after SFRS(I)16 adoption
2   Excluding spectrum                                                                                                               25
GROWTH PRIORITIES

• Maximise returns from core assets
• Cost transformation                 OPTIMISE
• Digitalisation & innovation                                • New growth areas – e.g. 5G /
                                                               emerging tech / new market
                                                   GROW        segments
                                                             • Harness synergies from
• Diversify revenue streams &                                  acquisitions
  geography                           DIVERSIFY
• Explore synergistic M&A
  opportunities
                                                             • Robust capital & risk management
                                                  PRUDENCE
                                                             • Responsible dividend policy

                                                                                              26
2Q/1H2020 RESULTS
7 August 2020

                          Investor Relations:
                Amelia LEE | IR@StarHub.com
You can also read