3.5 Tropical Cyclone Risk Assessment Hazard Description - Mississippi Emergency ...
←
→
Page content transcription
If your browser does not render page correctly, please read the page content below
3.5 Tropical Cyclone Risk Assessment

Hazard Description
  Tropical Cyclones are naturally occurring events that produce damaging high winds, generate dangerous storm
  surge flooding, cause pounding storm surf, spawn tornadoes, and produce torrential rainfall that can cause
  inland flooding.
  The Atlantic hurricane season begins June 1 and ends on November 30, but hurricanes have developed outside of
  the designated season. Mississippi has been subject to winter and spring extra-tropical storms driving higher than
  normal tides from southerly and southeasterly winds. The Mississippi Coast has also experienced tropical
  depressions and tropical storms which have caused higher than normal tides, storm surge and gusting winds.
  FEMA defines coastal storms as causing “increases in tidal elevations (called storm surge), wind speed and
  erosion, caused by both extra-tropical events and tropical cyclones.” FEMA defines hurricanes as “tropical
  cyclones characterized by thunderstorms and defined wind circulation.” These winds “blow in a large spiral
  around a calm center called the eye.”
  The following terms are used to describe tropical storms / hurricanes:
  Tropical Wave: A trough or cyclonic curvature maximum in the trade-wind easterlies. The wave may reach
  maximum amplitude in the lower middle troposphere.
  Tropical Depression: A tropical cyclone in which the maximum sustained surface wind speed (using the
  U.S. 1-minute average) is 33 kt (38 mph or 62 km/hr) or less.
  Tropical Storm: A tropical cyclone in which the maximum sustained surface wind speed (using the U.S. 1-minute
  average) ranges from 34 kt (39 mph or 63 km/hr) to 63 kt (73 mph or 118 km/hr).
  Hurricane: A tropical cyclone in which the maximum sustained surface wind (using the U.S. 1-minute aver- age) is
  64 kt (74 mph or 119 km/hr) or more.
  Hurricane wind intensity is measured with the Saffir-Simpson Scale based on a 1-5 rating of a hurricane’s
  sustained wind speed at the time of measurement. This is used to give an estimate of the potential property
  damage expected along the coast from a hurricane landfall. Hurricanes reaching Category 3 and higher are
  considered major hurricanes because of their potential for significant loss of life and damage. Category 1 and 2
  storms are still dangerous, however, and require preventative measures. Wind speed is the determining factor in
  the scale. All winds are described using the U.S. 1-minute average. Previously, storm surge was described by the
  Saffir-Simpson Scale, but is no longer included.
  The following excerpt from the National Hurricane Center explains revised definition of the Saffir-Simpson
  Hurricane Scale and the separation of storm surge from storm category followed by an explanation of the need
  to revise the new range of wind speeds:

     Earlier versions of the Saffir-Simpson Hurricane Scale incorporated central pressure and storm surge
     as components of the categories. The central pressure was used during the 1970s and 1980s as a
     proxy for the winds as accurate wind speed intensity measurements from aircraft reconnaissance were
     not routinely available for hurricanes until 1990. Storm surge was also quantified by category in the
     earliest published versions of the scale dating back to 1972. However, hurricane size (extent of
     hurricane- force winds), local bathymetry (depth of near-shore waters), topography, the hurricane’s
     forward speed and angle to the coast also affect the surge that is produced. For example, the very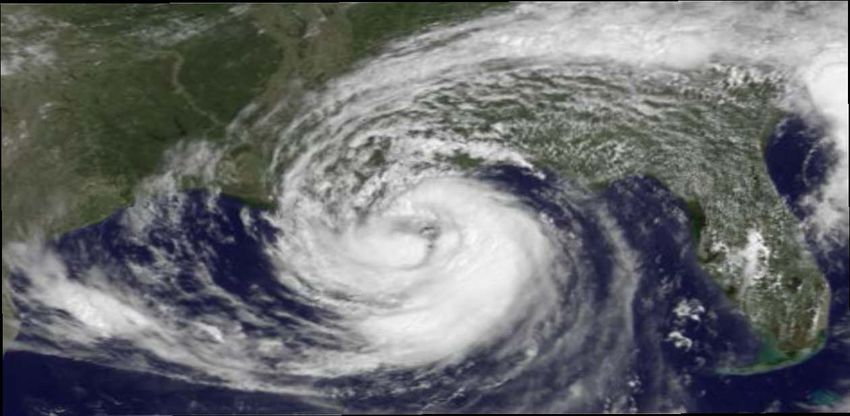
large Hurricane Ike (with hurricane force winds extending as much as 125 mi from the center) in 2008
        made landfall in Texas as a Category 2 hurricane and had peak storm surge values of about 20 ft. In
        contrast, tiny Hurricane Charley (with hurricane force winds extending at most 25 mi from the center)
        struck Florida in 2004 as a Category 4 hurricane and produced a peak storm surge of only about 7 ft.
        These storm surge values were substantially outside of the ranges suggested in the original scale.
        Thus, to help reduce public confusion about the impacts associated with the various hurricane
        categories as well as to provide a more scientifically defensible scale, the storm surge ranges, flooding
        impact and central pressure statements are removed from the Saffir-Simpson Hurricane Scale and only
        peak winds are employed in this revised version.
        The Saffir-Simpson Hurricane Wind Scale (SSHWS) has undergone a minor modification for 2012
        in order to resolve awkwardness associated with conversions among the various units used for wind
        speed in advisory products. The change broadens the Category 4 wind speed range by one mile per
        hour (mph) at each end of the range, yielding a new range of 130-156 mph. This change does not alter
        the category assignments of any storms in the historical record, nor will it change the category
        assignments for future storms.
Table 3.5.1 depicts the revised Saffir-Simpson Scale by category, associated wind speeds and
expected damages from a particular event.

                                             Table 3.5.1
                                Saffir-Simpson Hurricane Wind Scale
               Previous
 Category       Range          New Range                               Effects on Land
                                               Very dangerous winds will produce some damage: Well-
                                               constructed frame homes could have damage to roof, shingles,
 One         74-95 mph        No change        vinyl siding and gutters. Large branches of trees will snap and
                                               shallowly rooted trees may be toppled. Extensive damage to
                                               power lines and poles likely will result in power outages that
                                               could last a few to several days.
                                               Extremely dangerous winds will cause extensive damage:
                                               Well-constructed frame homes could sustain major roof and
 Two         96-110 mph       No Change        siding damage. Many shallowly rooted trees will be snapped
                                               or uprooted and block numerous roads. Near-total power loss
                                               is expected with outages that could last from several days to
                                               weeks.
                                               Devastating damage will occur: Well-built framed homes
                                               may incur major damage or removal of roof decking and gable
Three       111-130 mph      111-129 mph       ends. Many trees will be snapped or uprooted, blocking
                                               numerous roads. Electricity and water will be unavailable for
                                               several days to weeks after the storm passes.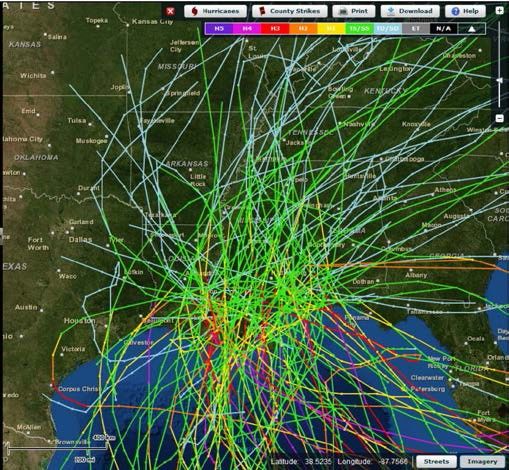
Previous
 Category        Range            New Range                                Effects on Land
                                                    Catastrophic damage will occur: Well-built framed homes
                                                    can sustain severe damage with loss of most of the roof
                                                    structure and/or some exterior walls. Most trees will be snapped
Four         131-155 mph       130-156 mph          or uprooted and power poles downed. Fallen trees and power
                                                    poles will isolate residential areas. Power outages will last
                                                    weeks or months.
                                                    Catastrophic damage will occur: A high percentage of
                                                    framed homes will be destroyed, with total roof failure and
Five         Greater than      Greater than         wall collapse. Fallen trees and power poles will isolate
             155 mph           157 mph              residential areas. Power outages will last for weeks to
                                                    possibly months. Most of the area will be uninhabitable for
                                                    weeks or months.
  Source: National Hurricane Center. Revised 2012

Storm Surge
Hazard Description
   The National Hurricane Center defines storm surge as an abnormal rise of water generated by a storm over and
   above the predicted astronomical tides. Storm surge should not be confused with storm tide, which is defined as
   the water level rise due to the combination of storm surge and the astronomical tide. This rise
   in water level can cause extreme flooding in coastal areas particularly when storm surge coincides with
   normal high tide, resulting in storm tides reaching up to 20 feet or more in some cases (Figure 3.5.1).
   Storm surge is produced by water being pushed toward the shore by the force of the winds moving cyclonically
   around the storm. The impact on surge of the low pressure associated with intense storms is minimal in
   comparison to the water being forced toward the shore by the wind.
   The maximum potential storm surge for a particular location depends on a number of different factors. Storm
   surge is a very complex phenomenon because it is sensitive to the slightest changes in storm intensity, forward
   speed, size (radius of maximum winds-RMW), angle of approach to the coast, central pressure (minimal
   contribution in comparison to the wind), and the shape and characteristics of coastal features, such as bays and
   estuaries (Figure 3.5.2).

   Other factors impacting storm surge are the width and slope of the continental shelf. A shallow slope will
   potentially produce a greater storm surge than a steep shelf. For example, a Category 4 storm hitting the
   Louisiana coastline, which has a very wide and shallow continental shelf, may produce a 20-foot storm
   surge; while, the same hurricane in a place like Miami Beach, Florida, with the continental shelf dropping off
   very quickly, might see an 8 or 9-foot surge.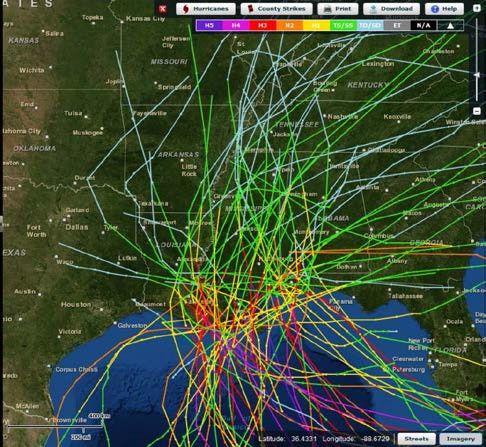
Figure 3.5.1
                                    Storm Surge vs. Storm Tide
                                                 (Source: NHC)

                                      Figure 3.5.2
                 Wind and Pressure Components of Hurricane Storm Surge
                                                 (Source: NHC)

Hazard Profile

Location
   The Gulf Coast of Mississippi is located in a high-hazard area for hurricanes and storm surge, and is one of the
   more densely populated areas of the state. According to the 2010 U.S. Census, over 370,702 residents reside in
   the coastal counties of Hancock, Harrison, and Jackson. The second-tier of counties is comprised of George, Pearl
   River, and Stone. These counties, located immediately upland from the coastal counties, had a combined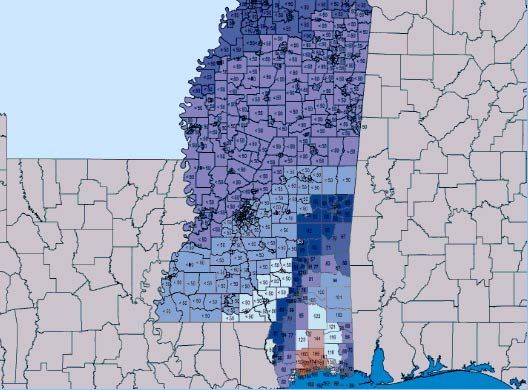
population of 96,198 in 2010. The combined total population of all six counties was 466,900. The effects of
  Hurricane Katrina, which made landfall in August 2005, caused drastic population shifts as people sought shelter
  in non-coastal areas. As housing was built and employment centers and schools were rebuilt many residents
  returned to their homes. In 2008, the estimated population of these six counties was 422,785, a net gain of 44,115
  has been realized.
  The three coastal counties are potentially at very high risk from the direct impact of a hurricane or tropical storm.
  Residents of the three upland counties are at high risk from strong winds, rain damage, flooding, severe storms,
  and tornadoes generated from the hurricane.
  Storm surge is potentially the most devastating factor associated with hurricanes. Within the boundaries of the
  first-tier counties, properties adjacent to areas affected by tides, particularly areas south of U.S. Highway 90,
  are the most susceptible to damage from storm surge with heavy flooding as the most common result. In
  extreme cases, such as Hurricanes Camille and Katrina, the incoming wall of water and wind could destroy
  well-built buildings along the immediate coastline.
  Hurricanes also significantly impact the medium-risk Gulf Coast counties of Clarke, Covington, Forrest, Greene,
  Jasper, Jefferson Davis, Jones, Lamar, Lauderdale, Marion, Perry, Pike, Rankin, Simpson, Smith, Walthall, and
  Wayne counties. Each of these counties can all receive the effects of high winds, rain damage, severe storms,
  and flooding. Hurricane effects have also impacted, with less severity, the low risk counties of other further inland
  counties.
  Hurricanes that move northeast across the Louisiana Delta or move inland between Mobile, Alabama and
  Panama City, Florida, usually are less damaging because these storms are located on the “weak side” of the
  storm. Even if a hurricane/tropical storm does not make landfall, the Mississippi Gulf Coast can suffer the
  damaging effects of high tide, rain, and wind from hurricanes/tropical storms that move in from the Gulf of Mexico.

Shelter Requirements
  The state of Mississippi has implemented a statewide sheltering program to build FEMA 361 community
  saferooms to house displaced households or those seeking shelter from impending storms. Below is a summary
  of the progress made to date on the construction and capacity of these saferooms which will assist in evaluating
  the expected shelter requirements set forth in the scenarios presented in this plan update. Note, the number of
  facilities and capacity for the 361 safe rooms include 32 facilities that are currently under construction to house
  approximately 21,245 persons.

                                        Mississippi Safe Room Program
    Safe Room Type                 County                              No. of Facilities      Est. Capacity
   Individual      Statewide                                               10,918                28,824
   FEMA 361        Adams, Copiah, Desoto, Forrest, George,                 72                    52,337
                   Hancock, Harrison, Jackson, Jones,
                   Lafayette, Lamar, Lauderdale, Lincoln,
                   Monroe, Neshoba, Pearl River, Pike,
                   Rankin, Stone, Tate, Tunica, and Wayne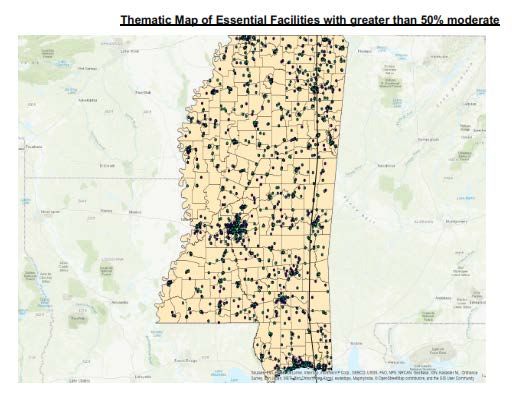
Safe Room Type                  County                               No. of Facilities   Est. Capacity
       Community      Attala, Calhoun, Chickasaw, Holmes,                       183           Undetermined
                      Itawamba, Lafayette, Lamar, Lauderdale,
                      Lee, Leflore, Lowndes, Madison, Monroe,
                      Panola, Pontotoc, Prentiss, Smith,
                      Tallahatchie, Tippah, Union, Wayne,
                      Winston, and Yalobusha

  Education and Outreach
      Hurricane Preparedness Week occurs the last week in May of each year. For more information on hurricane
      awareness call the MEMA Public Information number (866-519-6362) between 8 a.m. and 5 p.m. weekdays.
      The state also participates in state, regional, and national hurricane and all-preparedness conferences.
      During these conferences, public and private agencies have an opportunity to receive educational and
      training to further their efforts in preparing for and responding to future events.

  Past Occurrences
          Since 1965 Mississippi has been struck by 17 hurricanes and 18 tropical storms/depressions. Tables
          3.5.2 and 3.5.3 reflects the history of hurricanes and tropical storms/depressions from 1965 to 2017 in
          Mississippi followed by storm surge events in Table 3.5.4. Figures 3.5.3 to 3.5.5 are also provided by
          category to show the tracks of these storms as they entered the Gulf of Mexico.

                                         Table 3.5.2
                            Hurricane/Tropical Storm Events
                      Presidential Disaster Declarations- Mississippi

  Event/Declaration               Incident Period            Number of Counties              Major Declaration
        Number                                                   Affected                        Declared
Hurricane Nate DR-4350          October 6-10, 2017                   5                       November 22, 2017
Hurricane Isaac DR-4081       August 26 – September                 49                        August 20, 2012
                                     11, 2012
Hurricane Gustav DR-1794     August 28 – September 8,                  22                    September 22, 2008
                                       2008
Hurricane Katrina DR-1604     August 29 – October 14,                  82                      August 29, 2005
                                       2005
Hurricane Dennis DR-1594         July 10-15, 2005                      41                       July 10, 2005
 Hurricane Ivan DR-1550       September 13-20, 2004                    44                    September 15, 2004
Tropical Storm Isidore DR-    September 23 – October                   10                      October 1, 2002
           1436                       6, 202
Tropical Storm Allison DR-       June 6-13, 2001                        8                       June 21, 2001
           1382
 Hurricane Georges DR-        September 25-October 5,                  13                      October 1, 1998
           1251                       1998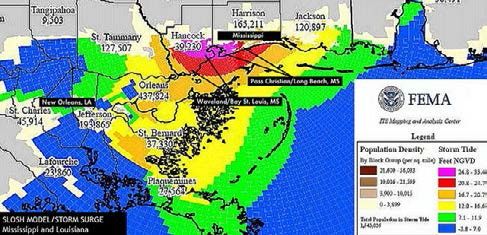
Event/Declaration             Incident Period            Number of Counties         Major Declaration
          Number                                                 Affected                   Declared
  Hurricane Elena DR-741     August 29 – September 4,                4                  September 4, 1985
                                       1985
Hurricane Frederic DR-599      September 13, 1979                   13                  September 13, 1979
Hurricane Camille DR-271         August 18, 1969                    20                   August 18, 1969
Hurricane Betsy DR-210         September 25, 1965           No County Information       September 25, 1965

                                          Table 3.5.3
                        Mississippi Hurricane & Tropical Storm History
                                     Non-Declared Events
                        Event                                                               Property
   Incident Name         Date              County(s) Affected           Deaths Injuries     Damage
Tropical Storm Isaac   8/28/2012 Adams, Amite, Claiborne, Copiah,         1        2         $7,375,000
                                 Covington, Forrest, Franklin, Hancock,
                                 Harrison, Hinds, Issaquena, Jackson,
                                 Jefferson, Jefferson Davis, Jones, La-
                                 mar, Lawrence, Lincoln, Marion, Pearl
                                 River, Pike, Rankin, Simpson, Smith,
                                 Walthall, Wilkinson and Warren
Tropical Storm Lee     9/2/2011 Amite, Hancock, Harrison, Jackson,        0        0         $55,000
                                 Pearl River, Pike and Wilkinson

Tropical Storm Ida     11/9/2009 Forrest, Hancock, Harrison and Pearl      0        0        $0
                                 River

Tropical Storm Ike     9/11/2008 Hancock, Harrison, and Jackson            0        0        $0

Tropical Storm Gustav 9/2/2008    Adams, Claiborne, Copiah, Forrest,       0        0        $5,850,000
                                  Franklin, Jefferson, Jefferson Davis,
                                  Lamar, Lawrence, Lincoln and Marion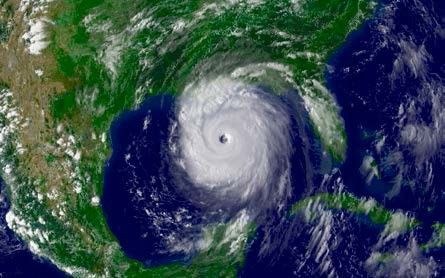
Event                                                             Property
   Incident Name          Date          County(s) Affected               Deaths Injuries   Damage
Tropical Depression     9/25/2005 Coahoma and Tunica                       0        0       $10,000
Rita

Hurricane Rita          9/24/2005 Adams, Bolivar, Carroll, Claiborne,      0        0      $485,000
                                  Copiah, Franklin, Hinds, Holmes,
                                  Humphreys, Issaquena, Jefferson,
                                  Jefferson Davis, Lawrence, Leflore,
                                  Lincoln, Madison, Marion, Rankin,
                                  Sharkey, Simpson, Sunflower,
                                  Warren, Washington, and Yazoo
Tropical Depression     7/11/2005 Calhoun, Chickasaw, Itawamba, Lee,       0        0      $35,000
Dennis                            and Union

Hurricane Cindy         7/5/2005   Hancock, Harrison, Jackson, and         0        0      $9,000,000
                                   Pearl River

Tropical Storm Cindy    7/5/2005   Forrest, George, Greene, Lamar, and     0        0      $200,000
                                   Stone

Tropical Storm Arlene   6/10/2005 Clarke, Clay, Hancock, Harrison,         0        0      $445,000
                                  Jackson, Kemper, Lauderdale,
                                  Lowndes, Noxubee, and Oktibbeha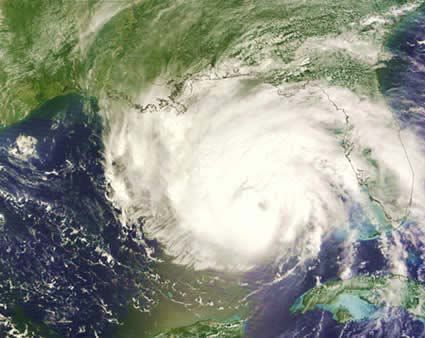
Event                                                             Property
   Incident Name          Date           County(s) Affected              Deaths Injuries   Damage
Tropical Storm          10/9/2004 Hancock, Harrison and Jackson            0        0       $20,000
Matthew

Tropical Storm Ivan     9/16/2004 Chickasaw, Itawamba, Lee, and            1        0      $30,000
                                  Monroe

Tropical Storm Bill     6/30/2003 Clarke, Covington, Forrest, Hancock,     0        0      $1,200,000
                                  Harrison, Jackson, Jasper, Jefferson
                                  Davis, Jones, Kemper, Lamar,
                                  Lauderdale, Marion, Newton, Pearl
                                  River, and Smith

Hurricane Lili          10/3/2002 Adams, Amite, Attala, Carroll,           0        0      $13,900,00
                                  Covington, Hancock, Harrison, Hinds,                     0
                                  Jackson, Jasper, Leake, Leflore,
                                  Madison, Pearl River, Pike, Scott,
                                  Smith, Walthall, Warren, Washington,
                                  Wilkinson, and Yazoo

Tropical Storm Hanna    9/14/2002 Hancock, Harrison, and Jackson           0        0      $0

Tropical Storm Bertha   8/4/2002   Hancock, Harrison, and Jackson          0        0      $50,000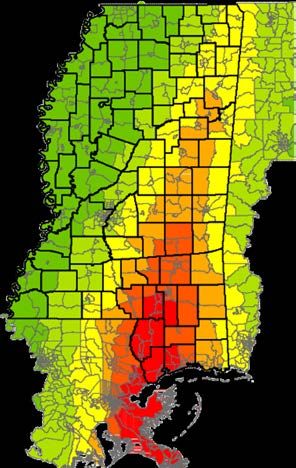
Event                                                            Property
   Incident Name        Date           County(s) Affected             Deaths Injuries   Damage
Tropical Storm        9/19/1998 Hancock, Harrison, Jackson, and Pearl   0        0       $85,000
Hermine                         River

Tropical Storm Earl   9/2/1998   Hancock, Harrison, and Jackson        0        0       $0

Hurricane Danny       7/17/1997 Hancock, Harrison, and Jackson         0        0       $0

Hurricane Opal        10/4/1995 Hancock, Harrison, and Jackson         0        1       $75,000

Hurricane Erin        8/20/1995 Greene, Perry, and Wayne               0        0       $100,000

 Source: NCEI
Table 3.5.4
                                           Storm Surge History
                                                                                 Property
     Date        County     Property Damage ($)      Date         County         Damage ($)
 6/20/2017     Jackson            $0                 8/29/2005    Hancock        $3,380,000,000
               Harrison           $0                              Harrison       $5,630,000,000
               Hancock            $0                              Jackson        $2,250,000,000
 10/7/2017     Jackson            $0                 7/5/2005     Hancock        $500,000
               Harrison           $0                              Harrison       $300,000
               Hancock            $0                              Jackson        $200,000
 8/28/2012     Jackson            $600,000           10/9/2004    Hancock        $15,000
               Harrison           $2,100,000                      Harrison       $15,000
               Hancock            $2,100,000         9/15/2004    Harrison       $400,000
 9/2/2011      Jackson            $10,000                         Jackson        $1,200,000
               Hancock            $10,000                         Hancock        $400,000
               Harrison           $10,000            6/30/2003    Jackson        $250,000
 9/11/2008     Harrison           $0                              Hancock        $500,000
               Jackson            $0                              Harrison       $250,000
               Hancock            $0                 10/13/2001   Hancock        $0
 9/1/2008      Hancock            $1,250,000         2/15/1998    Harrison       $250,000
               Harrison           $750,000                        Hancock        $500,000
               Jackson            $500,000                        Jackson        $250,000
        Total Estimated Property Damage                            $11,272,000,000

Source NCEI
Figure 3.5.3
Category 1 and 2 Historical Hurricanes
1852-2017
Source : www.csc.noaa.gov/hurricanesFigure 3.5.4
Category 3, 4 and 5 Historical Hurricanes
1852-2017
Source : www.csc.noaa.gov/hurricanesFigure 3.5.5
Historical Tropical Storms
1852-2017
Source: www.csc.noaa.gov/hurricanes
Summaries of the Presidentially declared disaster events that have occurred over the past ten years is
provided below. The summaries also include data from the NCEI and FEMA on the impacts to people and
property and the public assistance dollars obligated.
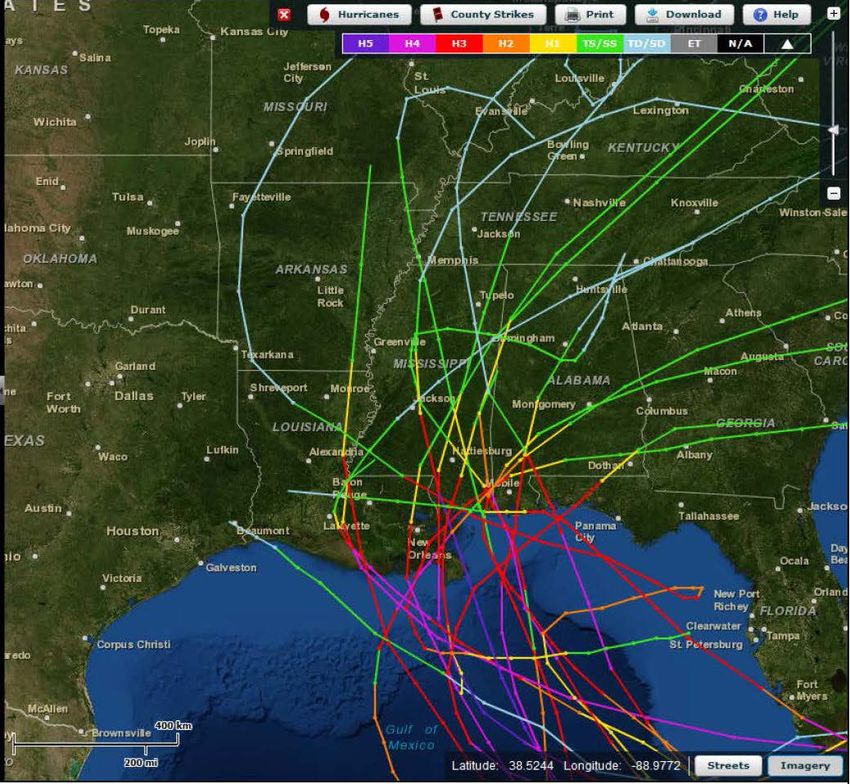
November 22, 2017- Hurricane Nate
Hurricane Nate originated in the Western Caribbean and was an unusually fast-moving storm, which caused
widespread destruction and casualties in Central America. Hurricane Nate moved through the Yucatan
Channel and into the Gulf of Mexico on October 7, 2017. The next day, Hurricane Nate made landfall near the
mouth of the Mississippi River in Louisiana. After crossing the marshland of the delta, Hurricane Nate made
its second U.S. landfall in Biloxi, Mississippi. Hurricane Nate caused storm surge along the coastline, as well
as rip currents, hurricane force winds, and beach erosion. iCounties Affected 6
Deaths 0
Injuries 0
Estimated Property Damage $125,000
Total Public Assistance Grants $986,297
Emergency Work (Categories A-B) Not Available
Permanent Work Not Available
Source: NCEI and FEMA
Satellite image of Hurricane Nate
August 28, 2012–Hurricane Isaac
Hurricane Isaac entered the Gulf of Mexico as a tropical storm on August 26, 2012 moving northwest after
crossing Haiti, Cuba, and the Florida Straits. Isaac moved slowly north northwest over the eastern Gulf.
Isaac strengthened into a hurricane on the morning of the 28th when it was 75 miles south southeast of the
mouth of the Mississippi River. Isaac made landfall in Plaquemines Parish as a Category 1 Hurricane near
Southwest Pass of the Mississippi River on the evening of the 28th. A second landfall occurred near Port
Fourchon the following morning. The storm weakened to a tropical storm on the afternoon of the 29th about50 miles west southwest of New Orleans, and weakened further to a tropical depression on the afternoon of
the 30th near Monroe, Louisiana.
Even though Isaac was of hurricane status from near the mouth of the Mississippi River into southeast
Louisiana, only tropical storm force winds were recorded on land areas of Mississippi. The maximum
sustained wind in south Mississippi was 46 knots or 53 mph measured at the Gulfport- Biloxi-Airport during
the early afternoon of August 29th. A portable weather station (Weatherflow Inc) near Gulfport measured a
48-knot gust, or 55 mph, late on the morning of August 29. Maximum wind gust of 58 knots or 67 mph was
recorded at the NOAA NOS Bay Waveland station and at Gulfport (Weatherflow Inc) late on the morning of
Aug 29. The long duration of tropical storm force winds downed some trees and power lines across the
region.
The minimum sea level pressure measured from a land station was 995.9 mb the NOAA-NOS station at
Bay-Waveland station during the early morning of Aug 29th. A storm tide ranged from approximately 5 feet
in Jackson County to nearly 10 feet in Hancock County closer to Isaac’s center. These values are
approximately 3 to 8 feet above normal astronomical values. Storm surge flooding impacts were greatest in
Hancock County. Persistent rain bands affected south Mississippi, especially the coastal sections produced
heavy rainfall over a three-day period. 10 to 20 inches of rainfall was common across the region. A co-
operative observer near Pascagoula recorded the maximum reading of 22.20 inches of rain. Heavy rainfall
produced both flash flooding and later moderate-to-major river flooding. Record crests were observed
on the Wolf River near Landon (August 31) and Gulfport (September 1), and the East Hobolochitto River
near Cesear (Aug 31). Storm surge and high tides restricted outflow of the rivers near the coast and lakes
exacerbating flooding of low lying areas along rivers and bayous near the coast as they emptied into the
Gulf. There were two weak tornadoes documented that occurred along Mississippi coast which resulted in
generally minor property damage
Overall, impacts from Isaac resulted in millions of dollars in damages in south Mississippi and one direct
fatality. Much of the damage in the coastal counties of Hancock, Harrison, and Jackson was related to storm
surge on the coast, flash flooding, or river flooding. The chart below provides a summary of the reported
impacts to people and property damage from NCEI and the dollars obligated to date for public assistance
through FEMA.
Counties Affected 49
Deaths 1
Injuries 2
Estimated Property Damage $7,375,000
Total Public Assistance Grants $37,002,798
Emergency Work (Categories A-B) $23,061,498
Permanent Work $13,941,300
Source: NCEI and FEMASatellite image of Hurricane Isaac
September 1, 2008- Hurricane Gustav
Hurricane Gustav made landfall as a Category 2 hurricane near Cocodrie, LA during the morning of
September 1, 2008. Gustav continued to move northwest and weakened to a Category 1 storm over south
central Louisiana later that day. The highest wind gust recorded in south Mississippi was 74 mph at the
Gulfport-Biloxi International Airport while the highest sustained wind of 54 mph was recorded at the
Waveland Yacht Club. No official wind observations were available in far southwest Mississippi; however,
hurricane force wind gusts may have occurred. Rainfall varied considerably ranging from around 4 to 10
inches. Gustav produced mainly light wind damage across coastal Mississippi, although more significant and
concentrated damage occurred in southwest Mississippi closer to the track of center of the storm.
Widespread power outages occurred in southern Mississippi.
Counties Affected 22
Deaths 0
Injuries 0
Estimated Property Damage $19,370,000
Total Public Assistance Grants $33,702,564
Emergency Work (Categories A-B) $19,932,178
Permanent Work $12,657,491
Source: NCEI and FEMASatellite image of Hurricane Gustav August 28, 2005 - Hurricane Katrina Hurricane Katrina was one of the most destructive hurricanes on record to impact the coast of the United States. It was one the worst natural disasters in the history of the U.S., resulting in catastrophic damage and numerous casualties along the Mississippi coast. Damage and casualties resulting from Hurricane Katrina extended as far east as Alabama and the panhandle of Florida. Post-event analysis by the National Hurricane Center indicates that Katrina weakened slightly before making landfall as a strong Category 3 storm in initial landfall in lower Plaquemines Parish. The storm continued a north-northeast track with the center passing about 40 miles southeast of New Orleans with a second landfall occurring near the Louisiana and Mississippi border as a Category 3 storm with maximum sustained winds estimated at 121 mph. Katrina continued to weaken as it moved north-northeast across Mississippi during the day but remained at hurricane strength 100 miles inland. Damage across coastal Mississippi was catastrophic. The storm surge associated with Hurricane Katrina approached or exceeded the surge associated with Hurricane Camille (1969) and impacted a much more extensive area. Almost total destruction was observed along the immediate coast in Hancock and Harrison Counties with storm surge damage extending north along bays and bayous to Interstate 10. Thousands of homes and businesses were destroyed by the storm surge. Hurricane- force winds also caused damage to roofs, power lines, signage, downed trees, and some windows were broken by wind and wind-driven debris in areas away from storm surge flooding, wind damage was widespread with fallen trees taking a heavy toll on houses and power lines. Excluding losses covered by the National Flood Insurance Program (NFIP), insured property losses in Mississippi were estimated at $9.8 billion dollars. Uninsured and insured losses combined were estimated to exceed $100 billion dollars across the Gulf Coast.
Satellite image of Hurricane Katrina

The NCEI reports that tide gauges were destroyed by Hurricane Katrina; therefore, storm surge
was determined by post storm high water marks. It was estimated that the storm surge along Harrison
County was between 19 and 25 feet, 23 feet was recorded at the Hancock County EOC operations area in
Waveland, and the high-water mark measured on the Jackson County EOC building in Pascagoula was 16.1
feet. Storm total rainfall amounts generally ranged from 10 to 16 inches across coastal and south Mississippi
with much lower amounts observed over southwest Mississippi. The highest observed storm total rainfall was
11 inches at Stennis Space Center and near Picayune.
With all 82 counties eventually being included in the Presidential Disaster Declaration, the impacts of
Hurricane Katrina, both direct and indirect, continue to be felt today, and have resulted in significant
challenges facing our citizens, local governments and the state. Never before have we experienced the
total destruction of communities and cities. Virtually every element of society that makes a community -
homes, business, schools, places of worship, healthcare and government were destroyed in Bay St. Louis,
Waveland, Pass Christian, and Long Beach.
The challenges of rebuilding these communities that experienced total loss of their tax base and sales tax
revenues continue today. Affordable housing and total rebuilding of infrastructure continue to strain
resources available to many local governments. Cities and counties throughout the state wrestle with
increased population as a result of evacuees who have decided not to return to areas of Louisiana and the
Mississippi Gulf Coast, straining availability of affordable housing, inadequate infrastructure, and the ability
of local governments to provide basic services.
To help understand the total effects of this catastrophic event, a storm surge and HAZUS final wind field
figures are presented as Figures 3.5.6 and 3.5.7.

   Counties Affected                               82
   Deaths                                          238
   Injuries                                        Undetermined
   Estimated Property Damage                       $80,000,000,000
   Total Public Assistance Grants                  $3,237,615,391
   Emergency Work (Categories A-B)                 $1,170,007,750
   Permanent Work                                  $1,885,105,865
       Source: NCEI and FEMA
Figure 3.5.6
Hurricane Katrina Storm Surge Map
Figure 3.5.7
Hurricane Katrina Peak Gust by Census Track
HAZUS and Wind Field
Peak Gust by Census Track
HAZUS Final Wind Field
Mississippi Counties
Storm Track
Peak Wind Gust
HAZUS/Census Tract
0 - 50
51 - 70
71 - 90
91 - 110
111 - 130
131 - 155
¯
Miles
0 15 30 60 90July 10, 2005 – Hurricane Dennis
Hurricane Dennis entered the Gulf of Mexico as a hurricane. After crossing over Cuba, the hurricane
moved into the central Gulf of Mexico and strengthened to a Category 4 hurricane on July 10th.
Hurricane Dennis weakened to a Category 3 hurricane prior to making landfall along the western Florida
panhandle. The Mississippi Gulf Coast felt some tropical weather from Hurricane Dennis. The highest
wind gusts over land in Mississippi were reported at Keesler Air Force Base at 46 mph. The highest
wind gusts over water adjacent to Mississippi was 52 mph from a buoy located 22 miles south-southeast
of Biloxi. Rainfall on the Mississippi Gulf Coast was reported to be less than 2 inches. The lowest
reported pressure on the Mississippi Gulf Coast was 994.2 mb, and the highest reported tide was 4 feet
MMSL at Waveland (NCEI: Event Details). Harrison County received public assistance under a
Presidential Disaster Declaration.
Counties Affected 41
Deaths 0
Injuries 0
Estimated Property Damage $2,550,000
Total Public Assistance Grants $1,707,563
Emergency Work (Categories A-B) $1,735,639
Permanent Work $0
Source: NCEI and FEMA
Satellite image of Hurricane DennisSeptember 16, 2004 Hurricane Ivan
Hurricane Ivan made landfall near Gulf Shores, Alabama as a Category 3 hurricane during the morning of
September 16, 2004. The storm caused extensive damage in Coastal Alabama and Florida. Harrison and
Hancock Counties experienced tropical storm force winds. A wind gust of 78 mph was captured at Point
Cadet in Biloxi. The lowest pressure reported on the Mississippi Gulf Coast was 975.6 mb at the Jackson
County Emergency Operations Center. Keesler Air Force Base captured a low pressure of 982.9 mb about
two hours later. The highest storm surge on the Mississippi Gulf Coast was at the mouth of the Pascagoula
River and was 3.72 ft NGVD. A Presidential Disaster Declaration was made, providing individual assistance
to residents of Harrison County and public assistance to local governments in Harrison County.
Counties Affected 44
Deaths 1
Injuries 0
Estimated Property Damage $9,720,000
Total Public Assistance Grants $14,403,026
Emergency Work (Categories A-B) $10,113,755
Permanent Work $4,289,274
Source: NCEI and FEMA
Satellite image of Hurricane Ivan
September 26, 2002-Tropical Storm Isidore
Tropical Storm Isidore made landfall near Grand Isle, LA during the early morning of September 26, 2002.
The tropical storm moved north across southeast Louisiana and by the evening was located in central
Mississippi, where it was downgraded to a tropical depression. Tropical Storm Isidore had a large circulation
with tropical storm force winds extending several hundred miles from its center. Tide levels were generally 4
to 7 feet above normal, with locally higher levels, across much of coastal Mississippi. Significant beach
erosion occurred along the coast and on the barrier islands. The maximum storm surge reading on theMississippi Coast was 7.61 feet NGVD at the Corps of Engineers tide gage at Gulfport Harbor, and 6.86 feet
NGVD in Biloxi Bay at Point Cadet. There were two fatalities on the Mississippi Coast related to the tropical
storm; one direct and another indirect. Rainfall amounts associated with Isidore were generally 5 to 8 inches
and resulted in some river flooding and flash flooding. Approximately 2,500 homes in Hancock County,
1,400 homes in Harrison County were flooded, primarily as the result of storm surge, with river flooding and
flash flooding causing some of the flood damage.
Counties Affected 10
Deaths 1
Injuries 0
Estimated Property Damage $25,500,000
Total Public Assistance Grants $6,784,617
Emergency Work (Categories A-B) $999,661
Permanent Work $5,784,956
Source: NCEI and FEMA
Satellite image of Tropical Storm Isidore
Probability of Hurricane Future Events
Researchers have studied the probability of a tropical cyclone landfall and guest calculations for 17
regions from Brownsville, Texas to Eastport, Maine. A web page that displays this information has
been created as a joint project between the Tropical Meteorology Project at Colorado State
University, Fort Collins, Colorado, and the GeoGraphics Laboratory at Bridgewater State College,
Bridgewater, MA. (http://landfalldisplay. geolabvirtualmaps.com)
According to the researchers, information obtained indicates that the 2018 Atlantic hurricane season
will be somewhat more active than the 2017 season predictions. Increases are shown below for winds
greater than 40 mph to 115 mph:
• Probability of Tropical Storm Force (>= 40 mph) Wind Gusts - Increase of 1.08%• Probability of Hurricane Force (>=75 mph Wind Gusts - Increase of 1.08%
• Probability of Intense Hurricane-Force (>= 115 mph) Wind Gusts - Increase of 1.08%
Overall Mississippi is expected to have a 13.9% probability of hurricane impact(s) and 6.0% chance
for a major hurricane impact. Tables 3.5.5 and 3.5.6 break down the probability by coastal county for
2018 and for the next 50-year period.
Table 3.5.5
2018 Hurricane Landfall
Probability
Probability George Hancock Harrison Jackson Pearl River Stone
Probability of 1 or more 5.4% 4.5% 6.0% 6.6% 5.6% 5.3%
named storms making
landfall
Probability of 1 or 2.7% 2.3% 3.0% 3.3% 2.8% 2.7%
more named
hurricanes making
landfall
Probability of 1 or 1.2% 1.0% 1.3% 1.5% 1.3% 1.2%
more intense
hurricanes making
landfall
Probability of tropical 40.5% 40.5% 40.5% 40.5% 40.5% 40.5%
storm force (>= 40
mph) wind gusts
Probability of hurricane 13% 13% 13% 13% 13% 13%
force (>=75 mph) wind
gusts
Probability of intense 4.5% 4.5% 4.5% 4.5% 4.5% 4.5%
hurricane force (>= 115
mph) wind gusts
Source : http://landfalldisplay.geolabvirtualmaps.com/
Table 3.5.6
50 Year Hurricane Landfall Probability
Probability George Hancock Harrison Jackson Pearl River Stone
Probability of 1 or more 88% 82.7% 90.3% 92.5% 88.6% 87.4%
named storms making
landfall
Probability of 1 or 64.2% 57.3% 67.6% 71.4% 65% 63.4%
more named
hurricanes making
landfall
Probability of 1 or 36.9% 31.8% 39.7% 42.9% 37.6% 36.3%
more intense
hurricanes making
landfall
Probability of tropical 99.9% 99.9% 99.9% 99.9% 99.9% 99.9%
storm force (>= 40Probability George Hancock Harrison Jackson Pearl River Stone
mph) wind gusts
Probability of hurricane 99.6% 99.6% 99.6% 99.6% 99.6% 99.6%
force (>=75 mph) wind
gusts
Probability of intense 82.3% 82.3% 82.3% 82.3% 82.3% 82.3%
hurricane force (>= 115
mph) wind gusts
Source : http://landfalldisplay.geolabvirtualmaps.com/
Assessing Vulnerability
In assessing Mississippi’s vulnerability to damage and loss of life from hurricanes and tropical storms, at
the top of the list is loss of life and property due to flooding. Mississippi’s citizens are vulnerable to
hurricanes. The very young, the elderly and the handicapped are especially vulnerable to harm from
hurricanes. Not only are resident’s homes vulnerable to hurricanes, but also public buildings, infrastructure
and natural resources are all subject to damage. In some cases, the damage to natural resources cannot
be restored to pre-incident levels.
Damages from Flooding Due to Hurricanes
Torrential rains from hurricanes and tropical storms can produce extensive urban and riverine flooding.
Winds from these storms located offshore can drive ocean water up the mouth of a river, compounding the
severity of inland overbank flooding.
In addition to the combined destructive forces of wind, rain, and lightning, hurricanes can cause a “surge” in
the ocean, which can raise the sea level as high as 25 feet or more in the strongest hurricanes. This “storm
surge” also can have the opposite effect, in that the sea level can be lowered to below mean sea level at
the backside of a hurricane. This phenomenon causes more destruction as storm surge waters are sucked
back out to sea. For more information on flood-related losses from hurricanes see the flood section of the
risk assessment.Vulnerability of People to Hurricanes
For those who are unable to evacuate for medical reasons, there should be provision to take care of
special-needs patients and those in hospitals and nursing homes. Many of these patients are either oxy-
gen-dependent, insulin-dependent, or in need of intensive medical care. There is a need to provide ongoing
treatment for these vulnerable citizens, either on the coast or by air evacuation to upland hospitals. The
stress from disasters such as a hurricane can result in immediate and long-term physical and emotional
health problems among victims.
According to U.S. Census Bureau 2008-2010 American Community Survey, there were 7,073 non-
institutionalized persons residing in Hancock County in 2010 with a certain disability. There were 27,210 in
Harrison County and 21,398 in Jackson County. The types of disabilities include: hearing, vision, cognitive,
ambulatory, self-care, and/or independent living difficulties. Together these counties accounted for a total of
55,681 persons with disabilities who could possibly be in need of help to survive the effects of a hurricane.
Total population vulnerability in the high-risk counties has decreased somewhat post for Jackson and
Harrison Counties and a slight increase for Hancock County. Table 3.5.7 compares 2000 and 2010
populations. This area is still in a state of flux in terms of its population as the recovery from Katrina is
ongoing. See the discussion in growth and development trends in Section 3.11 for more detail on the
population shifts as a result of Katrina.
Table 3.5.7
Vulnerable Populations in High Risk Counties Updated
County City 2000 Population 2010 Population
Jackson Pascagoula 26,200 22,392
Moss Point 15,851 13,704
Gautier 11,681 18,572
Ocean Springs 17,255 17,442
Jackson County
60,433 58,584
(unincorporated area)
Jackson County Totals 131,420 130,694
Harrison Biloxi 50,644 44,054
Gulfport 71,127 67,793
Pass Christian 6,579 4,613
D’Iberville 7,608 9,486
Long Beach 17,320 14,792
Harrison County Totals $189,598 $187,105
Hancock Bay St. Louis 8,209 9,260
Waveland 6,674 6,435
Hancock County 28,084 28,234
(unincorporated areas)County City 2000 Population 2010 Population Hancock County Totals 42,967 43,929 Source: Based on 2000 and 2010 U.S. Census Bureau figures. Total population includes cities and unincorporated areas The need for a speedy evacuation by Gulf Coast residents in their personally-owned vehicles has been expedited, utilizing the National Weather Service’s storm surge model Sea, Lake, and Overland Surges from Hurricanes or SLOSH. Modelers examined the population density of each coastal county, the capability of evacuation roads to handle evacuees, and the topography (which areas would flood first in the event of a hurricane) to establish evacuation zones. These zones identify who should leave and in what order based on which areas are most vulnerable to storm surge. This assignment of evacuation zones enables local residents to assess their own vulnerability to a hurricane, given their location. Local officials can then call for an evacuation of the particular zone when the opportunity presents itself. The model, developed in 2000, has been effectively implemented in an evacuation of people in their vehicles. If used in a timely basis, given sufficient warning, this SLOSH model is effective in saving lives in the Gulf Coast counties of Hancock, Harrison, and Jackson. The Mississippi Department of Transportation’s (MDOT) Statewide Traffic Management Center (TMC) provides coordination and timely management of all traffic conditions. In addition to keeping citizens safer and more informed during routine travel, the TMC improves better emergency event coordination and incident management than in previous years. The TMC has enhanced MDOT’s ability to respond to traffic-flow impediments resulting from adverse weather, debris in the roadway and the presence of hazardous materials. MDOT utilizes 260 traffic cameras located throughout the state to accomplish this. Once an incident is detected, the operations staff initiates an appropriate response by coordinating closely with other state and local agencies and disseminating real- time information to emergency responders and the public. In addition, the TMC has helped staff to establish close working relationships with similar TMC’s in Border States to more efficiently coordinate regional responses as needed. When the Traffic Engineering Desk at Mississippi Emergency Management Agency (MEMA) is operational, the TMC is capable of relaying incident information to contribute to MEMA’s situational awareness. A similar working relationship exists with state and local law enforcement agencies to address any impediments to the flow of traffic during emergencies, especially during evacuation events. Contraflow is the practice of turning traffic flow in one direction on controlled-access routes during times of emergency evacuation. It was first implemented in Mississippi during Hurricane Katrina. The purpose of contraflow in Mississippi is to quickly and efficiently assist the state of Louisiana in evacuating the greater New Orleans area by reversing southbound lanes of I-55 and I-59 to northbound flow. Contraflow is only implemented when requested by Louisiana and approved by the Governor of Mississippi. After Hurricane Katrina, MDOT’s post-disaster evaluation results indicated that changes should be made to contraflow in to improve operations. The primary improvement included extending the termination point of I-59 contraflow
to just south of Hattiesburg. During Hurricane Katrina, I-59 contraflow in Mississippi extended from the
  Mississippi/Louisiana state line to just south of Poplarville. Contraflow for I-55 began in Louisiana and
  extended into Mississippi to just south of Brookhaven. An evacuation and contraflow maps with primary
  and alternate evacuation routes is provided in Appendix 7.3.5-A.

Loss of Life from Hurricanes
  In general, loss of life and property due to high winds is confined to the coastal area. This loss of life is due
  to wind-borne glass, building materials, and limbs and shrubs. Upland losses can be attributed to rain dam-
  age and flooding as well as tornadoes. Flooded road crossings in upland and coastal areas seem to involve
  a greater loss of life to people in automobiles.
  Most deaths due to hurricanes are flood-related. Both coastal and inland flooding is a common occurrence
  with hurricanes and tropical storms. The death toll from Mississippi hurricanes amounts to 391 persons.
  This includes 238 persons who died in Hurricane Katrina, 152 who died in Hurricane Camille, and two who
  died upland in Hurricane Georges. Ninety percent of the deaths in hurricanes involve water-related or
  flooding deaths. The remaining deaths are due to the impacts of wind and wind-borne projectiles.
  Effective warnings, and timely evacuation from coastal areas inundated by storm surge have shown a
  dramatic reduction in deaths. Evacuation ensures that nobody remains present in the hazard area.

Vulnerability of Natural Resources to Hurricanes
  Natural resources, particularly beaches, are devastated by hurricanes. The erosion of the coastline is
  considerable due to the impact of wind, waves, and debris in a hurricane event. Beaches need to be
  replenished with appropriate materials to reduce erosion. Storm surge and subsequent erosion of the
  shoreline leads to the loss of property. The Barrier Islands - Cat, Horn, Petit Bois, and Ship - protecting the
  Mississippi Gulf Coast have seen damage from earlier events and are projected to disappear within years.
  Inland rivers and lakes can become clogged with wind-blown debris and trees, thus slowing recovery from
  a hurricane. Obstructions, if not removed, can become a cause for flooding.
  Trees that are blown down to the forest floor quickly become a target for infestation from insects that may
  spread to healthy trees. Water quality may suffer due to unwanted debris and vegetation blown in from a
  hurricane. Potential debris from fallen trees affected by hurricanes and tornadoes that often accompany
  them, can create wildfires when the area dries sufficiently to allow for burning through lightning or
  intervention by mankind. The Mississippi State Forestry Commission is quick to ensure, through proactive
  cutting and prescribed burns, that fallen trees and debris will not become fuel for a wildfire.

  According to research conducted the U.S.G.S - Historical Changes in the Mississippi-Alabama Barrier-
  Island Chain and the Roles of Extreme Storms, Sea Level and Human Activities (Robert A. Morton), the
  islands off the coast of Mississippi are seeing a decline in land mass. These islands provide not only
  storm protection but also have a high social value for their recreational offerings.
Figures 3.5.8 to 3.5.11 are provided to show the location of the barrier islands and the changes in their land
mass between 1847 to 2007.
                                             Figure 3.5.8
                                      Mississippi Barrier Islands

                                             Figure 3.5.9
                                     Historical Land-Loss Trends
Figures 3.5.10 Cat and Ship Islands
Figures 3.5.11
Petit Bois and Horn Islands
Vulnerability of Private Improvements to Hurricanes
         Homes, businesses, and manufactured homes are especially vulnerable to the effects of a hurricane and
         the winds, rain, and tornadoes generated by a hurricane. The effects of storm surge can flatten a house.
         Although hurricane winds can exert tremendous pressure against homes, a large fraction of hurricane
         damage is not from the wind itself, but from airborne missiles such as tree limbs and branches, signs and
         sign posts, roof tiles, metal siding and other pieces of buildings, including entire roofs in major storms. This
         wind-borne debris penetrates doors and windows, and allows the force of the wind to act against interior
         walls and ceilings not designed to withstand such forces, thus blowing the building apart.

   Local Plan Risk Assessment Summary
         Below is a summary of the risk classification identified in the individual local mitigation plans by MEMA
         Region.

MEMA Region         Low        Medium         High                MEMA Region          Low        Medium         High
     1                1           --            --                       6               -             -           1
     2                1           --             -                       7               -             -           1
     3                1           --            --                       8               -            2            1
     4                --           1            --                       9               -            --           1
     5                --          19            --

   Assessing Vulnerability by Jurisdiction
         Mississippi has had 13 declared hurricane/tropical storm disaster declarations. Table 3.5.8 provides
         information on the coastal and inland counties that have been declared in previous hurricanes/tropical
         storm events in order to establish frequency and vulnerability to hurricane/tropical storm damage. In
         Camille and Katrina, for example, central Mississippi counties as well as coastal counties received damage.
         These incidents cover the period 1969 to 2017, a 48-year period. The counties are sorted with those with
         the greatest number of declarations listed first to the least.
Table 3.5.8
Counties Declared in Hurricane/Tropical Storm Events
County Camille DR-
Katrina DR-
Gustav DR-
Dennis DR-
T.S. Isidore
T.S. Allison
Elena DR-
Isaac DR-
Nate DR-
DR-1251
DR-1382
DR-1436
Ivan DR-
Georges
Frederic
DR-599
11794
1550
1594
1604
4081
4350
271
741
Hancock X X X X X X X X X X X X
Harrison X X X X X X X X X X X X
Jackson X X X X X X X X X X X X
Pearl River X X X X X X X X X X X
George X X X X X X X X X X X
Forrest X X X X X X X X
Greene X X X X X X X X X
Jones X X X X X X X X
Stone X X X X X X X X X
Lamar X X X X X X X
Perry X X X X X X X
Wayne X X X X X X X
Covington X X X X X X
Jefferson X X X X X X
Davis
Marion X X X X X X
Pike X X X X X X
Amite X X X X X
Clarke X X X X X
Copiah X X X X X
Jasper X X X X X
Lauderdale X X X X X
Rankin X X X X X
Simpson X X X X X
Smith X X X X X
Walthall X X X X X
Adams X X X X X
Claiborne X X X X
Franklin X X X X
Hinds X X X X
Jefferson X X X X
Kemper X X X X
Lawrence X X X X
Lincoln X X X X
Neshoba X X X X
Newton X X X X
Noxubee X X X X
Scott X X X X
Wilkinson X X X X
Winston X X X X
Attala X X X
Clay X X X
Lowndes X X X
Leake X X X
Madison X X X
Monroe X X X
Oktibbeha X X X
Warren X X X
Calhoun X X
Carroll X X X
Chickasaw X X
Choctaw X X
Grenada X X
Holmes X X
Issaquena X X
Itawamba X X
Lee X X
Montgomery X X
Pontotoc X XCounty
Camille DR-
Katrina DR-
Gustav DR-
Dennis DR-
T.S. Isidore
T.S. Allison
Elena DR-
Isaac DR-
Nate DR-
DR-1251
DR-1382
DR-1436
Ivan DR-
Georges
Frederic
DR-599
11794
1550
1594
1604
4081
4350
271
741
Washington X X
Webster X X
Yazoo X X
Alcorn X
Benton X
Bolivar X
Coahoma X
Desoto X
Humphreys X
Lafayette X
Leflore X
Marshall X
MS Choctaw X
Indian
Reservation
Panola X
Prentiss X
Quitman X
Sharkey X
Sunflower X
Tallahatchie X
Tate X
Tippah X
Tishomingo X
Tunica X
Union X
Yalobusha X
Hurricane Betsy, 1965, is not included as historical data is not available.Assessing Vulnerability by Jurisdiction Methodology/HAZUS-MH Modeling HAZUS-MH hurricane loss modeling capabilities were used to quantify expected losses to the state and differentiate vulnerability by region. HAZUS-MH can model specific hypothetical or historical scenarios and probabilistic scenarios. Scenario results represent the expected damage from a single hurricane event, while probabilistic scenario results represent the range of probable losses estimated from a 1,000-year simulation of expected hurricane activity. The direct economic loss results for a probabilistic analysis include annualized loss estimates. Annualized losses are the total losses summed over the entire simulation period divided by 1,000 years. As noted in the previous information on location of past hurricanes and tropical storms, Mississippi’s highest risk of impact is in the coastal counties of Jackson, Hancock, and Harrison. As demonstrated by past events, the impact diminishes as storms move inland, but as witnessed with Katrina, even inland counties can experience damage from hurricanes. Katrina’s storm track served as the pattern for the 2018 deterministic scenario. State Probabilistic Scenario To identify potential losses from a hurricane event, a probabilistic scenario was developed from HAZUS- MH. This analysis evaluates the statistical likelihood that a specific event will occur and what losses and consequences will result. Provided in tables below are the estimated average yearly losses (annualized losses) and the expected distribution of losses (return period). Appendix 7.3.5-B contains the detailed HAZUS reports.
Table 3.5.9
                 Summary Impacts by Building Occupancy Type- 100-year Return
Occupancy                     Exposure                    Percentage of Total
Residential                   $210,772,463                75.14%
Commercial                    $43,001,230                 15.33%
Industrial                    $11,641,553                 4.15%
Agriculture                   $1,383,000                  0.49%
Religious                     $7,032,841                  2.51%
Government                    $2,358,594                  0.84%
Education                     $4,328,839                  1.54%
Totals                        $280,518,520                100%

                                         Table 3.5.10
              Expected Number of Buildings Damaged by Occupancy: 100-Year Event
Occupancy       None          Minor          Moderate     Severe                Destruction
Residential     5,139         41             47           80                    32
Commercial      61,225        1,072          1,176        1,459                 96
Industrial      2,463         37             41           67                    1
Agriculture     2,929         40             45           78                    1
Religious       15,390        230            237          407                   15
Government      8,670         117            128          201                   7
Education       1,071,652     23,678         18,646       13,512                12,854
Totals          1,167,468     25,214         20,320       15,803                13,006
HAZUS estimates the number of households that are expected to be displaced from their homes due to
the hurricane and the estimated amount of people that may require temporary sheltering. The model
estimates 26,437 households to be displaced due to the hurricane. Of these, 6,748 people will seek
temporary shelter in public shelters.
Building related losses are broken into two categories: direct property damage losses and business interruption
losses. The direct property damage losses are the estimated costs to repair or replace the damage caused to the
building and its contents. The businesses interruption losses are the losses associated the inability to operate a
business because the damage sustained during the hurricane. Business interruption losses also include temporary
living expenses for those people displaced from their homes because of a hurricane.
HAZUS estimates the total property damage losses at $11,318,000. Three percent of the estimated losses were
related to the business interruption. The largest loss was sustained by residential occupancies which made up over
81% of the total loss.
Table 3.5.11
Building Related Economic Loss Estimates: 100-Year Event
Occupancy Property Damage Business Interruption Loss Total
Residential $8,173,663 $993,814 $9,167,477
Commercial $1,023,023 $397,982 $1,421,005
Industrial $329,989 $20,048 $350,038
Others $321,839 $57,799 $379,639
Totals $9,848,515 $1,469,644 $11,318,160HAZUS estimated the amount of debris that will be generated by the hurricane. The model breaks the debris
into four general categories: brick/wood, reinforced concrete/steel, eligible tree debris, and other tree debris. The
model estimates that a total of 5,250,918 tons of debris will be generated. Of the total amount, 3,957,811 tons
(75%) is other tree debris. Of the remaining, brick/wood comprises of 67% of the total, reinforced concrete/steel
comprises of 3%, and the remainder is comprised of eligible tree debris.
.Peak Windspeed Forecast
Figure 3.5.12 illustrates the frequency of anticipated peak sustained wind speeds associated tropical cy-
clones making landfall in Mississippi. These data were derived us HAZUS-MH probability estimates.
Figure 3.5.12
Peak Windspeed Forecast
100-Year EventHurricane Katrina Scenario (500 Year Event)
HAZUS General Description
This scenario is based on 47,705.34 square miles and contains 605 census tracts. There are over
1,046,000 households with a total population of 2,844,658 people (2000 Census Bureau data). An
estimated 1,282,000 buildings are included in this scenario with a total replacement value (excluding
contents) of $159,417,000 (2006 dollars). Approximately 92% of the buildings (and 72% of the building
value) are associated with residential housing. Appendix 7.3.5-C contains the detailed HAZUS reports for
all 82 counties.
General Building Stock
HAZUS estimates that there are 1,282,365 buildings included in this scenario which have an aggregate
total replacement value of $159,417,000 (2006 dollars). Table 3.5.12 presents the relative distribution of
the value with respect to the general occupancies for all 82 counties followed by the expected damages by
occupancy in Table 3.5.13.
Table 3.5.12
Building Exposure by Occupancy Type
Occupancy Exposure ($1000) Percent of Total
Residential $114,980,081 72.1%
Commercial 427,348,654 17.2%
Industrial $7,456,047 4.7%
Agricultural $898,946 .06%
Religious $4,652,775 2.9%
Government $1,527,107 1.0%
Education $2,553,782 1.6%
Total $159,417,392 100.0%
HAZUS estimates that about 34,770 buildings will be at least moderately damaged. This is over 3% of
the total number of buildings in the state. There are an estimated 1,792 buildings that will be completely
destroyed.Table 3.5.13
Expected Building Damage by Occupancy
None Minor Moderate Severe Destruction
Occupancy Count % Count % Count % Count % Count %
Agriculture 5,232 91.83 225 3.94 136 2.39 89 1.56 15 .27
Commercial 55,971 89.68 3,720 5.96 2,169 3.47 545 0.87 9 0.01
Education 2,030 91.58 111 4.99 59 2.64 17 0.79 0 0.00
Government 2,629 92.71 126 4.45 62 2.19 18 0.64 0 0.00
Industrial 14,647 90.22 947 5.83 488 3.01 150 0.92 3 0.02
Residential 1,069,831 90.28 84,384 7.12 25,535 2.15 3,491 0.29 1,764 0.15
Total 1,157,666 89,929 28,621 4,356 1,792
Essential Facility Damage
In this scenario, the state had 111 hospitals with 17,989 hospital beds available for use. The day of the
hurricane the number of beds was reduced to 3,064 beds (73%). After one week, 80% of the beds will be in
service with 89% operational after 30 days. Table 3.5.15 presents the expected damage to essential
facilities statewide.
Table 3.5.14
Expected Damage to Essential Facilities
Number of Facilities
Probability of at Probability
least Moderate of Complete Expected Loss of
Classification Total Damage >50% Damage >50% Use < 1 Day
EOCs 37 0 0 37
Fire Stations 399 0 0 399
Hospitals 111 38 8 85
Police Stations 368 0 0 368
Schools 1,288 38 0 1,014You can also read