30 JUNE 2020 HALF YEAR RESULTS - TUESDAY, 25 AUGUST 2020 - Spark Infrastructure
←
→
Page content transcription
If your browser does not render page correctly, please read the page content below
30 JUNE 2020
HALF YEAR RESULTS
TUESDAY, 25 AUGUST 2020
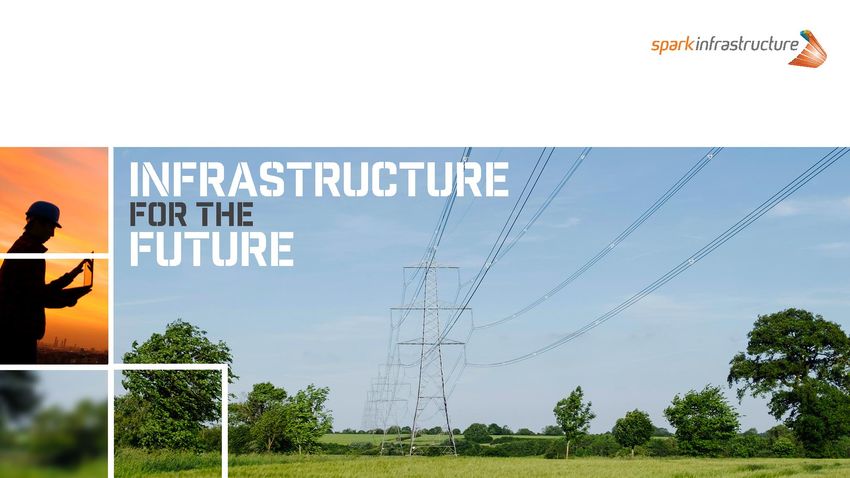
INFRASTRUCTURE FOR THE FUTURE

SPARK INFRASTRUCTURE – AT A GLANCE
ASX-listed owner of leading essential services infrastructure

                                         MARKET                                          Distribution                                          Transmission                                         Renewables
   $3.8bn                                CAPITALISATION(1)
                                         S&P/ASX 100                                     Victoria Power Networks                               TransGrid                                            Bomen Solar Farm
                                                                                         and SA Power Networks                                 (NSW)                                                (NSW)

   $6.6bn
                                     REGULATED AND
                                     CONTRACTED ASSET
                                     BASE (PROPORTIONAL)
                                                                          49%
                                                                           SPARK INFRASTRUCTURE
                                                                                                                               15%
                                                                                                                                SPARK INFRASTRUCTURE
                                                                                                                                                                                     100%
                                                                                                                                                                                     SPARK INFRASTRUCTURE
                                                                           OWNERSHIP                                            OWNERSHIP                                            OWNERSHIP

                    $18bn
                    TOTAL ELECTRICITY
                                                                          $10.89bn                                             $7.32bn                                               $0.18bn
                    NETWORK ASSETS(2)                                      REGULATED ASSET                                      REGULATED AND                                        CONTRACTED ASSET BASE
                                                                           BASE                                                 CONTRACTED ASSET BASE

                     SUPPLYING
                     5.0m+                                                                                                                                                                                            WAGGA
                     HOMES AND BUSINESSES                                     80%                                                  17%                                                    3%                          WAGGA,
                                                                                                                                                                                                                      NSW

                    OVER
                    5,400                                                  SKI PROPORTIONAL
                                                                           ASSET BASE(3)
                                                                                                                                SKI PROPORTIONAL
                                                                                                                                ASSET BASE(3)
                                                                                                                                                                                     SKI PROPORTIONAL
                                                                                                                                                                                     ASSET BASE(3)
                    EMPLOYEES

(1) As at 21 August 2020. Balance sheet and other information as at 30 June 2020 (2) Spark Infrastructure has proportional interests in $18bn of total electricity network and contracted generation assets (3) Pro forma

Spark Infrastructure I Investor Presentation I August 2020                                                                                                                                                                     2
INFRASTRUCTURE FOR THE FUTURE

FY2020 DISTRIBUTION GUIDANCE RECONFIRMED
Robust cash flow from high quality network businesses

                       Adjusted look-
                                                                                      HY2020                  Regulated               Contracted
                       through EBITDA(1)
                                                                                      Distribution            asset base(1)           asset base(2)

      $439m                                                            7.0cps                          $6.3bn
                                                                                                       Up 3.5%(6)
                                                                                                                               $0.3bn
                                                                                                                               Up 123.5%(6)
         Up 3.6%                                                                      FY2020                  Growth                  FFO/
                                                                                      Distribution            capital                 Net debt(5)
                                                                                      guidance                expenditure(4)
                                                                                      reconfirmed(3)

                                                                       13.5cps                         $144m                   14.3%
                                                                               at least                Up 10.5%                Down 0.1%

(1)   On an aggregated proportional basis to Spark Infrastructure
(2)   Includes Bomen Solar Farm and TransGrid CAB on a proportional basis to Spark Infrastructure
(3)   Subject to business conditions
(4)   Represents increase in RCAB and Bomen Solar Farm acquisition and construction costs
(5)   Funds From Operations (FFO)/ Net debt on a look-through basis
(6)   From balance as at 30 June 19
Spark Infrastructure I Investor Presentation I August 2020                                                                                            3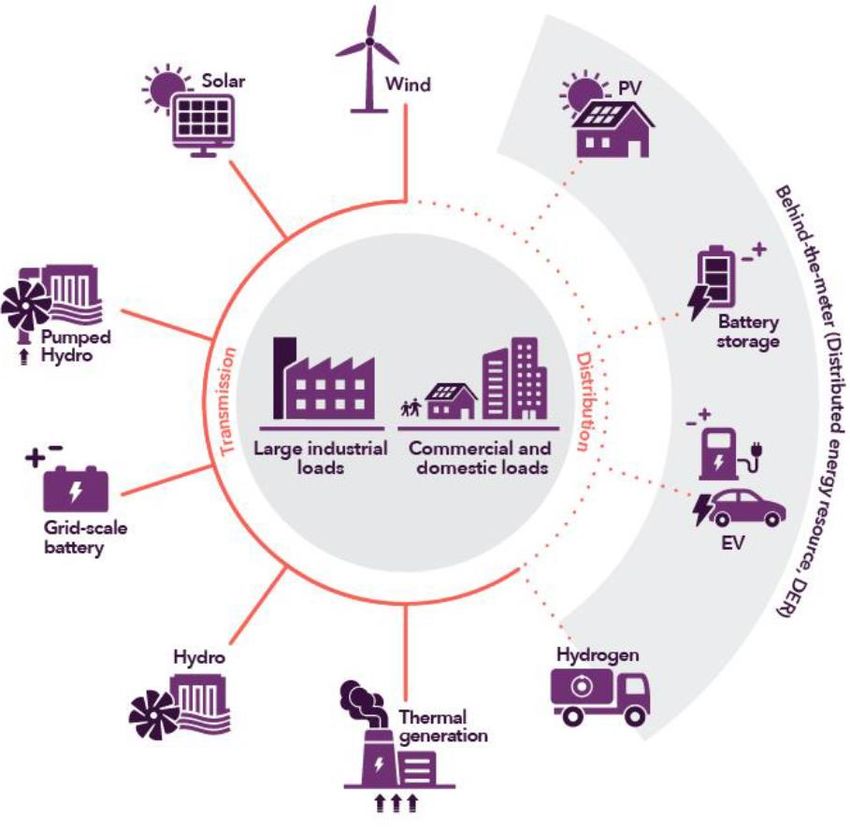
INFRASTRUCTURE FOR THE FUTURE

SUSTAINABLE YIELD AND GROWTH FOR THE FUTURE
Highly defensive businesses investing in Australia’s energy transition

  •     Businesses have adapted well to COVID-19 conditions with minimal impact, and are supporting consumers through network tariff relief

  •     Distribution and transmission revenues up 3.8%, in accordance with regulatory price-paths

  •     First renewables project delivered on time and under budget; fully operational

  •     Underlying Look-through Net Operating Cash Flow before tax up 13.0%; Robust and highly defensive through COVID-19

  •     Growth capex up 10.5% on prior period

  •     Growing substantial pipeline of regulated and contracted capex opportunities across all Businesses; supported by AEMO’s 2020 ISP

  •     All remaining historical taxes paid to remove downside risk and minimise potential ATO interest costs

  •     1H20 interim distribution of 7.0cps to be paid in September; with DRP to operate at 2.0% discount

  •     Achieved an average payout ratio of ~73% of look-through net operating cash flows over the last 4½ years; equivalent standalone payout
        ratio ~95% (after incorporating all tax payments)

  Delivering Yield and Growth in difficult conditions, and investing in the transition to a lower-carbon environment for future generations

Spark Infrastructure I Investor Presentation I August 2020                                                                                       4
INFRASTRUCTURE FOR THE FUTURE

PERFORMANCE SUMMARY
Adjusted Proportional Results
                                                                                    HY 2020                 HY 2019                 Change            Proportional
(Spark Infrastructure share) ($m)(1)
                                                                                                                                                      HY2019 EBITDA                    $423.9m
Distribution and transmission revenue                                                   510.4                   491.7                    3.8%
                                                                                                                                                      Change in VPN EBITDA(1)            $5.7m
Other revenue                                                                             75.3                    85.4                -11.8%
                                                                                                                                                      Change in SAPN EBITDA(1)          $13.2m
Total Revenue                                                                           585.7                   577.1                    1.5%
                                                                                                                                                      Change in TransGrid EBITDA       ($3.8m)
Operating costs                                                                       (158.8)                 (160.7)                   -1.2%
Beon margin                                                                                 3.9                     2.9                34.5%          Proportional
                                                                                                                                                      HY2020 EBITDA                    $439.0m
Enerven margin                                                                              8.4                     4.6                82.6%
EBITDA                                                                                  439.0                   423.9                    3.6%         VPN revaluation adjustment(1)      $1.0m

Net external finance costs                                                              (90.1)                  (90.9)                  -0.9%         SAPN revaluation adjustment(1)     $0.2m

EBTDA                                                                                   348.9                   333.0                    4.8%         Statutory Proportional
                                                                                                                                                      HY2020 EBITDA                    $440.2m

(1) Normalising non-cash adjustments:
VPN: HY 2020: excludes $1.0m positive revaluation adjustment to employee entitlements provisions and $1.5m loss in a credit valuation hedge accounting adjustment
HY 2019: excludes $4.6m negative revaluation adjustment to employee entitlements provisions and $0.3m gain in a credit valuation hedge accounting adjustment
SAPN: HY 2020: excludes $0.2m positive revaluation adjustment to employee entitlements provisions and $2.0m loss in a credit valuation hedge accounting adjustment
HY 2019: excludes $1.7m positive revaluation adjustment to employee entitlements provisions and $1.0m loss in a credit valuation hedge accounting adjustment

  Spark Infrastructure adjusted proportional EBITDA has increased by 3.6%

Spark Infrastructure I Investor Presentation I August 2020                                                                                                                                       5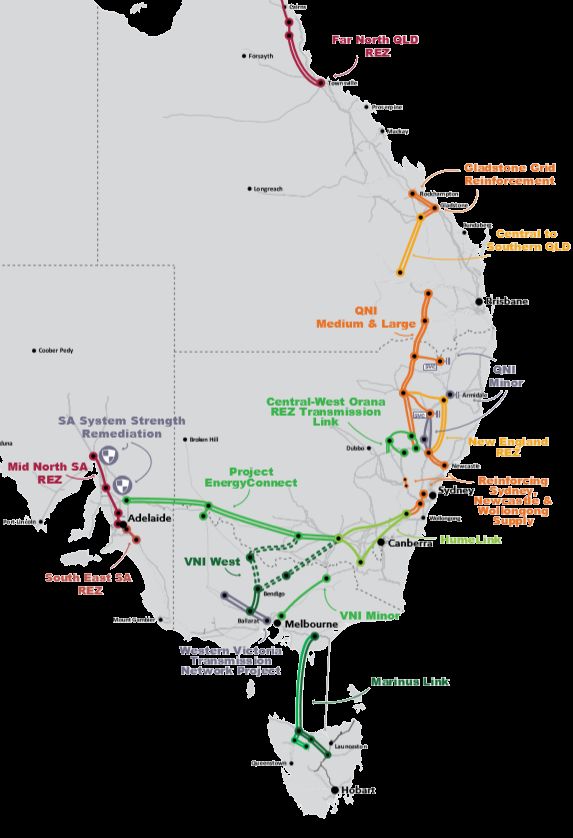
INFRASTRUCTURE FOR THE FUTURE

UNDERLYING LOOK-THROUGH CASH FLOW SUMMARY
                                                                                   Victoria
                                                                                                        SA Power                                         Spark
 Spark Infrastructure share ($m)                                                     Power                                    TransGrid                                        HY 2020                HY 2019               Change
                                                                                                        Networks                                Infrastructure
                                                                                  Networks
 EBITDA from operations                                                               213.9                    177.3                   49.0                       -                 440.2                 421.0                 4.6%
 less corporate costs                                                                      -                        -                     -                   (7.5)                  (7.5)                 (8.0)               -6.3%
 less net finance charges (1)                                                         (40.4)                   (32.5)                (15.9)                     0.4                (88.4)                (88.2)                 0.2%
 less net reg depreciation/maint. capex(2)                                            (66.1)                   (60.2)                (11.7)                       -               (138.0)               (135.0)                 2.2%
 Working capital/non cash movements                                                    (8.5)                    (7.0)                 (2.0)                       -                (17.5)                (22.7)               -22.9%
 Underlying net operating cash flows before tax                                         98.9                     77.6                  19.4                   (7.1)                 188.8                 167.1                13.0%
 less underlying tax paid(3)(4)                                                            -                        -                     -                  (19.0)                (19.0)                  (8.5)              123.5%
 Underlying net operating cash flows after tax                                          98.9                     77.6                  19.4                  (26.1)                 169.8                 158.7                 7.0%
 Underlying Standalone OCF per Security                                                                                                                                           9.9 cps               9.4 cps                 5.3%
 Distributions paid (5)                                                                    78.4                  46.8                  11.6                                        120.5                 126.2

 Growth capex(6)                                                                         (92.2)                (16.0)                (28.7)                    (7.1)              (144.0)               (130.3)                10.5%
 Other                                                                                    (1.6)                 (8.0)                 (3.9)                      9.1                (4.4)                (15.1)               -70.9%
 Investing cash flows                                                                    (93.8)                (24.0)                (32.6)                      2.0              (148.4)               (145.5)                 2.0%

  Underlying look-through net operating cash flows before tax increased 13.0%; growth capex up 10.5% to $144.0m
(1) Corporate finance charges excludes interest paid of $6.7m on historical tax payments made (under review)
(2) Net regulatory depreciation is a proxy for maintenance capex. It is calculated as regulatory depreciation net of actual CPI uplift on RAB
(3) Spark Infrastructure corporate tax paid of $19.0m in 2020 represents half of the 2019 tax liability for the SIH1 and SIH2 tax groups. 2019 tax paid of $8.5m represents half of the 2018 tax liability for SIH2 tax group. Excludes other
tax paid of $55.3m comprised of $34.4m tax paid in relation to a number of historical years (2015-2018), net monthly tax instalments of $1.9m and $19.0m of tax paid in relation to H2 2019. 2019 excludes other tax paid of $5.4m of
tax paid in relation to H2 2018. Refer to slide 45 for additional tax information.
(4) VPN and SAPN cash tax paid of $15.2m and $2.0m respectively for the 31 December 2019 year has been excluded as the benefit of franking credits will be distributed to Spark Infrastructure in future years
(5) Total HY2020 and HY2019 distributions are based on accrued distributions to Spark Infrastructure Securityholders
(6) Represents increase in RCAB and Bomen Solar Farm acquisition and construction costs
Spark Infrastructure I Investor Presentation I August 2020                                                                                                                                                                              6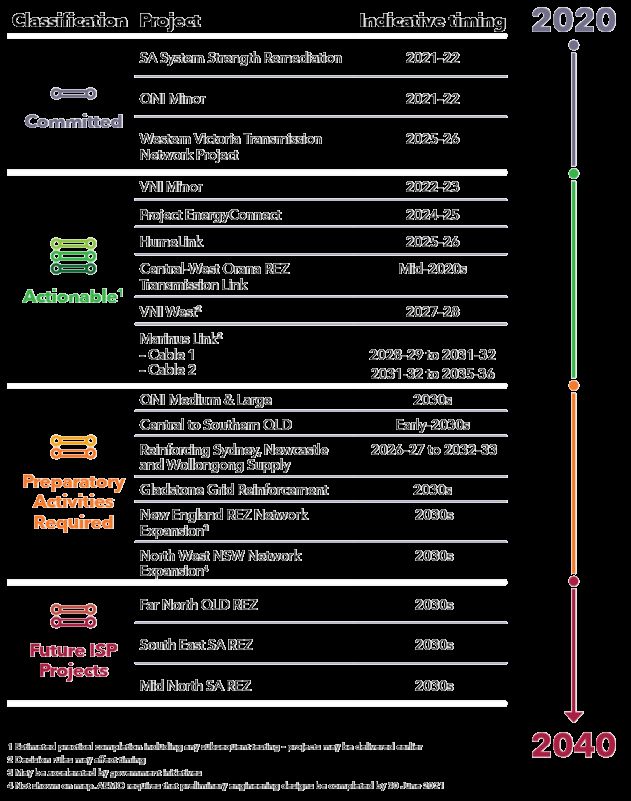
INFRASTRUCTURE FOR THE FUTURE

STANDALONE NET OPERATING CASH FLOW
Operating Cash Flow ($m)
                                                                                                                               HY 2020            HY 2019             Change
Investment Portfolio Distributions
Victoria Power Networks (1)                                                                                                         78.4                75.9              3.3%
SA Power Networks                                                                                                                   46.8                55.2            -15.2%
TransGrid                                                                                                                           11.6                21.5            -46.0%
Total Investment Portfolio Distributions                                                                                           136.8              152.6             -10.4%
Net interest received                                                                                                                 0.4                0.9            -55.6%
Corporate expenses                                                                                                                  (7.5)              (8.0)             -6.3%
Underlying Net Standalone OCF before tax                                                                                           129.7              145.6             -10.9%
Underlying tax paid (2)                                                                                                            (19.0)              (8.5)           123.5%
Underlying Net Standalone OCF after tax                                                                                            110.7              137.1             -19.3%
Underlying Standalone OCF per Security                                                                                           6.5 cps            8.2 cps             -20.7%
Operating costs – Bomen related                                                                                                     (0.4)              (0.8)            -50.0%
Project and transaction bid costs                                                                                                   (3.3)              (2.9)            13.8%
                         (4)
Other interest paid                                                                                                                 (6.7)                   -               n/m
Other tax paid (3)                                                                                                                 (55.3)              (5.4)                n/m
Standalone Net OCF                                                                                                                  45.0              128.0             -64.8%
Spark Infrastructure Distribution per Security                                                                                   7.0 cps            7.5 cps              -6.7%

  Cumulative underlying payout ratio for the last 4½ years (2016 – HY 2020) is 95% (after tax payments)
(1) Victoria Power Networks distributions for HY2019 include both interest on and repayment of shareholder loans. Repayments of loan principal are classified as investing activities for statutory reporting purposes (2) Tax paid of
    $19.0m in 2020 represents half of the 2019 tax liability for the SIH1 and SIH2 tax groups. 2019 tax paid of $8.5m represents half of the 2018 tax liability for SIH2 tax group. (3) Other tax paid of $55.3m comprised of $34.4m
    tax paid in relation to a number of historical years, net monthly tax instalments of $1.9m and $19.0m of tax paid in relation to H2 2019. 2019 other tax paid represents $5.4m of tax paid in relation to H2 2018. Refer to slide 45
    for additional tax information (4) Other interest paid includes an interest charge of $6.7m on historical tax payments made (related to the Victoria Power Networks litigation and subject to the outcome of the Federal Court
    appeal)                                                                                                                                                                                                                             7
Spark Infrastructure I Investor Presentation I August 2020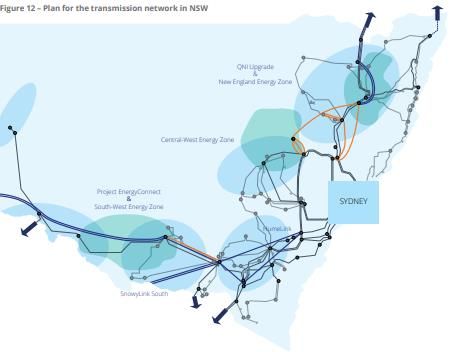
INFRASTRUCTURE FOR THE FUTURE

STRONG BALANCE SHEET & LOW REFINANCING RISKS
                                   Rating                                                                                           Total Debt Facilities                  Next Maturity
                                                             Undrawn               Drawn                 Average
                                   (S&P /                                                                                                                 Avg.
                                                               Debt                 Debt              Interest Rate               Amount                              Amount          Date
                                  Moody’s)                                                                                                               Maturity

  VPN(1)                             A- / n/a                 $335m              $4,737m                   3.6%(5)               $5,072m                 4.9 years    $425m       August 2021

  SAPN(1)                            A- /n/a                  $225m              $3,322m                   4.1%(5)               $3,547m                 6.4 years     $53m        June 2022

  TransGrid(1)                  n/a / Baa2(2)                $568m(3)           $5,955m(3)                 3.5%(5)              $6,523m(3)               4.6 years   $1,550m(4)    June 2021

  Corporate(1)                    n/a / Baa1                  $220m                $180m                    2.3%                   $400m                 2.7 years    $400m       February 2023

      •   Substantial undrawn and committed facilities
      •   Investment grade credit ratings
      •   Access to multiple sources of debt
      •   Long-weighted average maturities
      •   Minimal short-term refinancing requirements

(1)   All figures at 100%. As at 30 June 2020
(2)   Relates to the TransGrid Obligor Group
(3)   Relates to TransGrid Obligor Group and TransGrid Services
(4)   This amount includes $365m undrawn debt at 30 June 2020
(5)   Average interest rate is calculated based on finance charges (less non-cash credit valuation hedge adjustments) divided by average gross debt in the period
Spark Infrastructure I Investor Presentation I August 2020                                                                                                                                        8
INFRASTRUCTURE FOR THE FUTURE

COVID-19 UPDATE
No Government financial assistance has been utilised; focusing on health and safety of employees while maintaining essential services
to customers
                                   •           Support to customers affected by COVID-19(1) through Energy Networks Australia (ENA) Network Relief Package(2) announced at the beginning of April
                                   •           For customers impacted by COVID-19, the Network Relief Package waives network charges for residential customers of small retailers and small business
                                               customers and defers payment of network charges for residential customers of large retailers for the period 1 April 2020 and to 30 June 2020
       Network                     •           Estimated aggregate cost to VPN, SAPN and TransGrid of ~$7m (at 100%)
        Relief                     •           In August, the AEMC made a preferred rule to enable some retailers (that are not retailers of last resort or government owned) to defer the payment of network
       Package                                 charges for customers subject to payment plans, hardship arrangement or deferred debt arrangement for the period August 2020 to February 2021 for up to 6
                                               months. Retailers will pay interest on deferred charges
                                   •           Victorian businesses have voluntarily extended a modified Network Relief Package consistent with the AEMC rule (does not require the payment of interest) to
                                               31 January 2021(3)

                                                       Victoria Power Networks                                                             SA Power Networks                                                                           TransGrid
                                   •           Lower energy demand across VPN in the Half                            •   Energy demand in South Australia was down in                                   •    Energy demand declined by around 5% in April.
                                               Year compared to 2019 driven by small and large                           Q1 but has seen an increase in Q2 compared to                                       However, improvement was seen during May and
                                               commercial usage down around 10%, offset by                               2019 mostly due to colder weather increasing                                        June which recorded only a 1% reduction
                                               higher residential consumption up around 4%                               electricity usage for residential heating(4)                                        compared to Q2 2019(4)
                                                                     4.8%                                                                                4.4%                                                                                 4.1%
                                Total Volume

      Business
       Impact                                         8,335
                                                        GWh
                                                                                        7,933
                                                                                          GWh
                                                                                                                                     5,070
                                                                                                                                       GWh
                                                                                                                                                                           4,845
                                                                                                                                                                              GWh
                                                                                                                                                                                                                         34,970
                                                                                                                                                                                                                             GWh
                                                                                                                                                                                                                                                               33,590
                                                                                                                                                                                                                                                                   GWh

                                                     HY 2019                          HY 2020                                      HY 2019                                HY 2020                                       HY 2019                               HY 2020

                                   •           HY20 regulated revenue includes a $2.4m                               •   HY20 regulated revenue includes a $1.0m                                        •    HY20 regulated revenue includes a $3.4m
                                               estimated rebate under the ENA Network Relief                             estimated rebate under the ENA Network Relief                                       estimated rebate under the ENA Network Relief
                                               Package                                                                   Package                                                                             Package
(1)   Small business customers who consume less than 40MWh per annum (based on 2019) and use less than 25% of historical average consumption for the period. Residential customers not in arrears or receiving government benefits before 1 March 2020 but are after 1 April 2020
(2)   https://www.energynetworks.com.au/miscellaneous/covid-19-electricity-and-gas-network-relief-package/.
(3)   https://www.energynetworks.com.au/news/media-releases/2020-media-releases/energy-networks-extend-customer-support/
(4)   AEMO, Quarterly Energy Dynamics Report Q2 2020 - Market Insights and WA Market Operations
Spark Infrastructure I Investor Presentation I August 2020                                                                                                                                                                                                                          9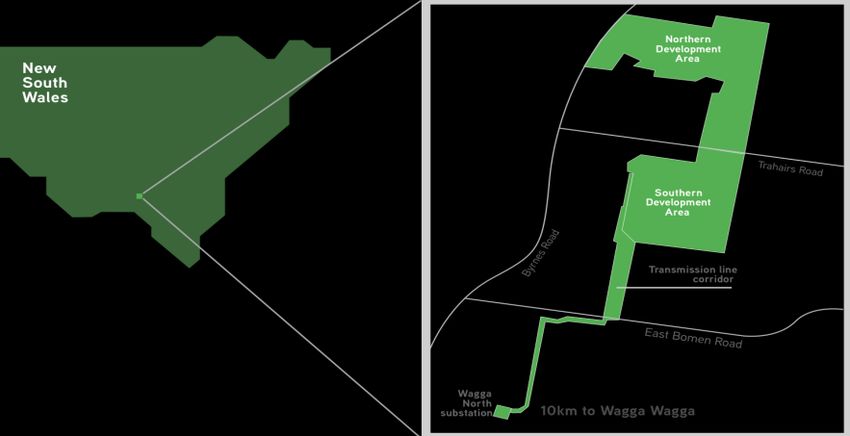
INFRASTRUCTURE FOR THE FUTURE

OUR INVESTMENTS’
FINANCIAL RESULTS
HALF YEAR 2020

Spark Infrastructure I Investor Presentation I August 2020   10
INFRASTRUCTURE FOR THE FUTURE

VICTORIA POWER NETWORKS
Financial ($m)(1)                                                                     HY 2020            HY 2019             Change            CPI-X                    $18.4m
Regulated revenue - DUOS                                                                   494.7              474.8
Prescribed metering ("AMI")                                                                  40.4               42.5
                                                                                                                                               STPIS(2)                 $11.1m
Semi-regulated revenue                                                                       30.1               29.1
Unregulated revenue                                                                          19.7               27.3
                                                                                                                                               Customer
                                                                                                                                               Growth(3)                1.2%
Total Revenue                                                                              584.9              573.7               2.0%
Operating costs              (4)
                                                                                         (156.2)            (166.1)
                                                                                                                                               Consumption
                                                                                                                                               (3)                      -4.8%
Beon margin                                                                                    7.9                6.0
EBITDA                                                                                     436.6              413.6               5.6%
                                                                                                                                               FTE
                                                                                                                                               Change(3)                4.5%
Other
Net finance costs              (5)
                                                                                          (85.7)              (84.4)
                                                                                                                                               Net Debt /
                                                                                                                                               RAB                      71.6%
Net capital expenditure                                                                    311.5              221.0
Distributions received by Spark Infrastructure                                               78.4               75.9              3.3%
                                                                                                                                               FFO /
                                                                                                                                               Net Debt                 14.4%
  On an adjusted EBITDA(4) basis the HY2020 result increased by $11.7m or 2.8%
(1) 100% basis (2) 2017 STPIS recovered in HY2020 (3) Compared with HY2019 (4) HY2020 includes $1.9m positive (non-cash) revaluation adjustments to employee entitlements provisions (HY2019: includes $9.4m loss)
(5) HY2020 includes a $3.1 (loss) in non-cash credit valuation hedge adjustments (HY2019: $0.6m gain)

Spark Infrastructure I Investor Presentation I August 2020                                                                                                                                                           11
INFRASTRUCTURE FOR THE FUTURE
VICTORIA POWER NETWORKS
Key Financial Drivers
Regulated Revenue • CPI of 1.59% from 1 January 2020
Up by 4.2% • X-factors for Powercor: -2.40% and CitiPower: -1.88% representing a real increase in revenue before CPI
• $11.1m STPIS recovery
• Network Relief Package ($2.4m)
Regulated Asset Base • RAB increased to $6,520m
Up by 5.4%(4) • Increase driven by net capex of $604m(1), less regulatory depreciation of $380m, and CPI uplift of $111m
Other Revenue • Semi-regulated revenue: up 3.4% – increased new connections revenue driven by residential growth in the Powercor Network
(excl. Beon) • AMI revenue: down 4.9% - depreciating RAB
Down by 8.8%
• Unregulated revenue: down 27.8% – sale of properties in the previous half year
Operating Costs • Larger than CPI salary increases driven by EBA’s partially offset by tight cost control in the business
(excl. Beon)
Up by 0.9%(2)
Beon Margin • Continued growth in new solar projects such as Jemalong and Melbourne Airport Solar Projects
Up by 31.7%
Net Capital Expenditure • Growth capex of $206.2m up 39.5% (network connections and augmentation) – continuation of REFCL(3) program
Up by 41.0% • Maintenance capex of $105.3m up 44.1% – zone substation replacement projects
• Highest ever capex program
Victoria Power Networks RAB has increased 5.4% over the last 12 months
(1) Excludes corporate overheads (2) Excluding $1.9m positive (non-cash) revaluation adjustments to employee entitlements provisions (HY2019: includes $9.4m loss) (3) Rapid Earth Fault Current Limiter (4) From 30 June 2019
Spark Infrastructure I Investor Presentation I August 2020 12INFRASTRUCTURE FOR THE FUTURE
SA POWER NETWORKS
Financial ($m)(1) HY 2020 HY 2019 Change CPI-X $10.7m
Regulated revenue – DUOS 430.0 412.6
Semi-regulated revenue 40.6 46.7
STPIS(4) $17.7m
Unregulated revenue 4.8 5.5
Total Revenue 475.4 464.8 2.3%
Customer
Growth(5) 1.2%
Operating costs (2) (130.9) (136.3)
Enerven margin 17.1 9.3
Consumption
(5) -4.4%
EBITDA
Other
361.6 337.8 7.0% FTE
Change(5) -2.3%
Net finance costs (3) (72.2) (69.6) Net Debt /
RAB 73.8%
Net capital expenditure 177.1 222.9
Distributions received by Spark Infrastructure 46.8 55.2 -15.2%
FFO /
Net Debt 17.8%
On an adjusted EBITDA(2) basis the HY2020 result increased by $26.9m or 8.1%
(1) 100% basis (2) HY2020: $0.4m positive revaluation adjustments to employee entitlements provisions (HY2019: $3.5m positive revaluation adjustment) (3) HY2020 includes a $4.1m (loss) credit valuation hedge adjustment
(HY2019: includes a $2.1m loss) (4) 2017/18 STPIS result to be recovered from 1 July 2019 (5) Compared with HY2019
Spark Infrastructure I Investor Presentation I August 2020 13INFRASTRUCTURE FOR THE FUTURE
SA POWER NETWORKS
Key Financial Drivers
Regulated Revenue • CPI of 1.78% from 1 July 2019 (1 July 2018: CPI 1.91%)
Up by 4.2% • X-factor applicable from 1 July 2019 was -0.85% representing a real increase in revenue before CPI
• $17.7m STPIS recovery
• Network relief package ($1.0m)
Regulated Asset Base • RAB increased to $4,372m
Up by 1.3%(2) • Increase driven by net capex of $306m(1), less regulatory depreciation of $328m, and includes CPI uplift of $79m
Underlying Other Revenue • Semi-regulated revenue: down 6.0%(4) - declining activity across all areas of asset relocation, embedded generation and council funded
Down by 6.8%(4) replacement of public lighting
Underlying Operating • Lower staff and consultancy costs
Costs (Excl. Enerven) • Reduced expenditure in connection with emergency response and timing of vegetation management costs
Down by 6.1%(3)
• November and December bushfire event provisions write back
Enerven Margin • Change in project mix, with projects for existing client base (including ElectraNet) complemented by new business activity including
Up by 83.9% commercial solar and battery solutions
• Enerven is engaged in deploying solar and battery capability to a significant number of SA Water sites under a framework contract of
up to $300 million, predominately over 2019 and 2020
Net Capital Expenditure • Growth capex of $62.4m, down 19.6% - network connections and augmentation
Down by 20.5% • Maintenance capex of $114.7m, down 21.1%
SA Power Networks has seen RAB growth of 1.3% over the 12 months
(1) Excludes corporate overheads (2) Includes public lighting RAB (3) Excludes 2020 revaluation adjustments to employee entitlements of $0.4m positive (2019: $3.5m positive) (4) Excludes public lighting provision write
back. In 2019 a long running public lighting dispute was resolved and required amounts were settled with customers in January 2020. As a result of finalisation of the quantum of this matter, provisions of $3.5m were unwound in
1H2019.
Spark Infrastructure I Investor Presentation I August 2020 14INFRASTRUCTURE FOR THE FUTURE
TRANSGRID
Financial ($m) (1) HY 2020 HY 2019 Change CPI-X(2) $5.7m
Regulated revenue 381.5 379.0
Unregulated revenue 63.0 74.4
STPIS(3) $8.3m
Other Revenue (8) (3.8) 1.2
Total Revenue 440.7 454.6 -3.1%
RAB(4)
Growth 2.3%
Regulated operating costs (81.3) (78.4)
Unregulated operating and other costs (32.8) (24.2)
CAB(4)(5)
Growth 43.1%
EBITDA 326.6 352.0 -7.2%
Other
FTE
Change(4) 3.0%
Net finance costs (108.2) (111.3)
Regulated capital expenditure 204.6 124.3
Net Debt /
RCAB(5)(6) 79.8%
Contracted capital expenditure 105.7 106.1
Distributions received by Spark Infrastructure 11.6 21.5 -46.0%
FFO /
Net Debt(7) 7.7%
Capital Expenditure for HY2020 increased $79.9m or 34.7%
(1) 100% basis (2) Relates to period 1 January 2020 to 30 June 2020 and includes an adjustment relating to the revocation and substitution of TransGrid's revenue determination for the 2014-2018 regulatory period (3) 2018
STPIS result to be recovered from 1 July 2019 (4) Compared with June 2019 (5) CAB comprises of unregulated infrastructure and telecommunication assets and investment property (6) Net Debt is calculated using gross debt
less cash and adjusted for prescribed revenue over/(under) collection and includes TransGrid Services (TGS) (7) Relates to TransGrid Obligor Group (8) HY2020 amount of ($3.8m) relates to revaluation of investment property
Spark Infrastructure I Investor Presentation I August 2020 15INFRASTRUCTURE FOR THE FUTURE
TRANSGRID
Key Financial Drivers – Regulated Business
Regulated Revenue • $9.7m increase in the Maximum Allowed Revenue (MAR) for the period 1 July 2019 to 30 June 2020, based on a 1.80% CPI increase
Up by 0.7% and X factor of -0.97%, partially offset by an adjustment relating to the revocation and substitution of TransGrid's revenue
determination for the 2014-2018 regulatory period as advised by the AER. The impact for the first half of 2020 was a $5.7 million
increase on the preceding period
• $8.3m STPIS payment
• Network Relief Package ($3.4m)
Regulated Asset Base • RAB increased to $6,589m
Up by 2.3% • Increase driven by capital expenditure of $294m, less regulatory depreciation of $275m, and includes CPI uplift of $129m
Operating Costs • Lower labour costs, consulting and other operational costs as a result of operating efficiencies gained
Down 8.2%(3)
Capital Expenditure • Growth capex(1) of $85.6m (up 303.8%)
Up by 64.6%
• Maintenance capex of $94.9m (up 17.6%)
• Non-network(2) capex of $24.1m (up 7.6%)
• Increase was mainly due to investment in augmentation projects including Powering Sydney's Future, Stockdill Switching Station and
ISP projects, and higher maintenance capex
TransGrid has seen RAB growth of 2.3% over the 12 months
(1) Includes Integrated System Plan (ISP) projects
(2) Includes Network Capability Incentive Project Action Plan (NCIPAP) capex
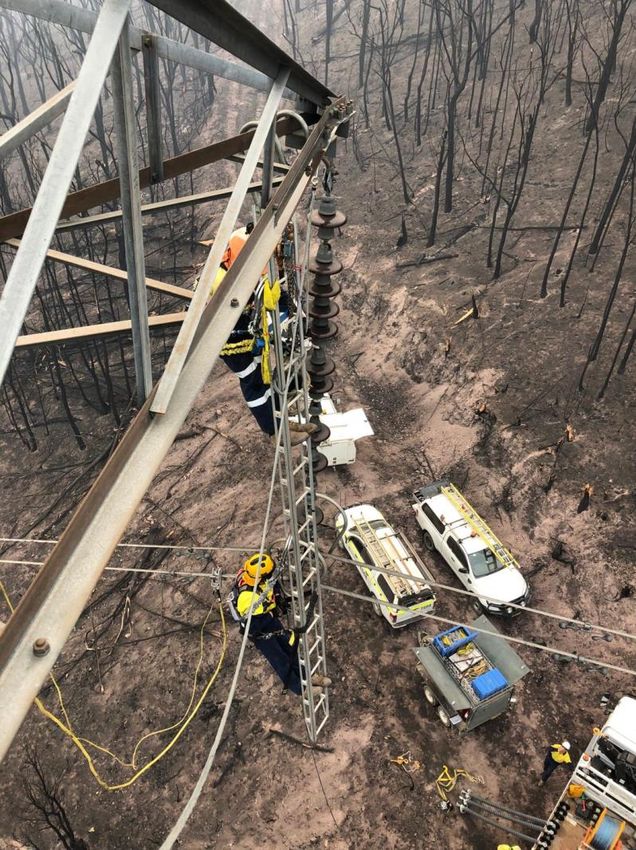
(3) Excluding $9.3m bushfire costs incurred during 2HFY20 for remediation of damage sustained during the bushfires in November and December 2019
Spark Infrastructure I Investor Presentation I August 2020 16INFRASTRUCTURE FOR THE FUTURE
TRANSGRID
Key Financial Drivers – Unregulated Business
Contracted Capital • Infrastructure capex includes renewable connections projects delivered in HY2020 (Darlington Point, Kiamal and Bomen Solar Farm)
Expenditure
Down by $0.4m • Increase in telco capex primarily driven by NBN POI rollout
Unregulated Revenue • Infrastructure connection revenue continued to increase in 2020 to $44.3m (HY2019: $24.3m) as construction of a number of
Down by $11.4m connection assets was completed
• Decrease in line modification revenue to $4.4m (HY2019: $34.8m) as a result of the completion of a number of one-off projects in 2019
• Connections revenue is expected to continue to grow with a number of new connections projects currently under construction and in
the pipeline
• Increased in telecommunications revenue as a result of growth in data services and co-location facilities
Unregulated Operating • Increase in new infrastructure connections partially offset by a decrease to the number of line modification projects
Costs • Additional project development costs supported the acceleration of TransGrid’s rapidly expanding non prescribed connections pipeline,
Up by $8.6m which is delivering increased contracted revenue growth
Contracted Asset Base • CAB increased to $728m
Up by $219.4m(1) • Increase driven by capex of $239m and gain on investment property of $0.7m, less depreciation of $20m
TransGrid has seen CAB growth of 43.1% over the 12 months
(1) From 30 June 2019
Spark Infrastructure I Investor Presentation I August 2020 17INFRASTRUCTURE FOR THE FUTURE INNOVATION AND REGULATION I N D U S T R Y A N D B U S I N E S S C O N S I D E R AT I O N S Spark Infrastructure I Investor Presentation I August 2020 18
INFRASTRUCTURE FOR THE FUTURE

INVESTMENT IN INNOVATION
Building resilient networks for future generations

             Victoria Power Networks                                                                                               SA Power Networks

                                     Solar Enablement Program                                              Upgrade Low Reliability Feeders
  • Currently being considered by the Australian Energy Regulatory (AER) this         • SA Power Networks have pursued a program to upgrade low reliability feeders
    program represents a $93m investment over five years that will enable most          in their worst performing parts of the network. This program was not required
    customers to connect their 5kVa solar PV system and ensure 95% of                   under the National Electricity Rules (NER) and was originally rejected by the
    customers are able to export to the grid                                            AER in their draft decision

  • This program will remove solar constraints where it is economic to do so – that   • Following further consultation with the Consumer Consultative Panel the
    is where the benefits to customers outweigh the costs – and assist customers        program gained unanimous consensus and the upgrade was accepted in the
    where it is not                                                                     AER’s Final Determination based on the significant stakeholder support

                                                     LiDAR Lab                                                      Solar-Sponge Tariff
  • VPN has established a new LiDAR processing lab to perform vegetation              • South Australia has the highest per capita level of rooftop solar. SAPN has
    inspection, focused on identifying multi-circuit clearance breaches. Through        created an innovative tariff structure for residential customers. This tariff offers
    automated modelling, the inspection needs to be accurate to within 5cm, as          a lower network charge during the middle of the day when solar output is
    such the models have been rigorously audited to provide assurance to the            highest, to encourage shifting of electricity use to those times
    business and maintenance teams.
                                                                                      • Raising demand for grid supplied electricity in the middle of the day can help
  • The LiDAR Lab project will see all LiDAR services moved in-house by 2021 to         manage voltage issues and thermal overloads associated with low demand,
    improve quality, minimise risks, reduce work hours and reduce costs                 while shifting demand away from the evening peak that can put heavy strain on
                                                                                        the network
Spark Infrastructure I Investor Presentation I August 2020                                                                                                                     19
INFRASTRUCTURE FOR THE FUTURE
INVESTMENT IN INNOVATION
Facilitating the energy transition for future generations
TransGrid Bomen Solar Farm
Multi-spectrum Inspections Bifacial Solar Panels
• TransGrid has recently implemented an advanced targeted asset inspections • Bomen Solar Farm became the first major project completed in Australia to
program using combined photographic, infrared (IR) and ultraviolet (UV) install bifacial modular panels which produce up to 20% more output, delivering
cameras to identify issues which are outside of the visual spectrum and in a higher efficiencies and lower levelised costs of electricity (LCOE) when
single flight compared to monofacial panel technologies
• This aids in identifying issues which can’t be detected from visual inspection • The technology is one of the most recent innovations in the industry which
alone and allows repairs to be planned in advance of a failure, driving pro- utilises the direct sunlight on the face of the panel whilst also picking up
active and optimal asset management while reducing network risks reflected sun from the ground received on the rear side of the panels
Communication Network Upgrades Community Partnership Programs
• A multi-year strategy has been created to deploy advanced communications • In partnership with Westpac, Spark Infrastructure has established a community
infrastructure (MPLS-TP). This new network is envisaged to better enable data fund to invest $1 million over ten years to support youth education and local
intensive inter-substation communications, support increasing needs for biodiversity and vegetation programs
advanced cyber and physical security systems, and enable faster more reliable
wide-area enterprise traffic solutions • $350,000 of these funds will be used to undertake a revegetation program to
enhance biodiversity in the proximity of the Bomen precinct. It is anticipated
• Upon completion in 2023 TransGrid will become the leader among Australian planting would occur during the winter months of 2021/22 and would include
Transmission Network Service Providers (TNSPs) as the first to integrate between 40,000 and 50,000 plants
protection-signaling across a Carrier Ethernet system
Spark Infrastructure I Investor Presentation I August 2020 20INFRASTRUCTURE FOR THE FUTURE
SAPN 2020-25 FINAL REGULATORY DETERMINATION
The AER Final Decision establishes revenue certainty until 2025
Regulatory 2020-25 2020-25 2020-25
2015-20 The final decision is in line with expectations with improved
proposal Draft Revised Final
Allowance(1) capex and inflation outcomes
metric Decision(2) Proposal(2) Decision(2)
Capex
($2019-20)
$2,011m $1,247m $1,693m $1,596m Standard Control Services Revenue ($m) and RAB ($bn)(1)(2)
$1,000
Opex
$1,375m $1,473m(3) $1,470m $1,470m
($2019-20)
$800
WACC 6.17% 4.95% 4.79% 4.75%
$600
4.77 4.85
Risk-free 4.59 4.68
2.96% 1.32% 0.96% 0.90% 4.36 4.48
Rate $400 4.23
4.09
3.88 3.93
Inflation 2.50% 2.45% 2.36% 2.27% $200
Gamma 0.4 0.585 0.585 0.585 $-
FY16 FY17 FY18 FY19 FY20 FY21 FY22 FY23 FY24 FY25
Revenue Allowance Draft Determination (Revenue)
Revenue Revised Proposal (Revenue) Final Decision (Revenue)
$3,769m $3,905m $3,933m $3,914m
(Nominal) Regulated Asset Base
The majority of SA Power Networks’ Revised Proposal was accepted by the AER in the Final Decision released on 5 June 2020
(1) AER Final Decision 2015-2020, October 2015 updated to $2020 (2) AER Final Decision Overview, June 2020.(3) AER Draft Decision Overview, October 2019.
Spark Infrastructure I Investor Presentation I August 2020 21INFRASTRUCTURE FOR THE FUTURE
VPN 2021-26 REGULATORY PROPOSAL
Final Risk-free Rate to be updated prior to the final decision in April 2021
2016-20 2021-26 2016-20 2021-26
Regulatory VPN’s Regulatory Proposal maintains revenue and continued
CitiPower (CP) CP Regulatory Powercor (PC) PC Regulatory
proposal metric RAB growth
Allowance(1) Proposal(1) Allowance(2) Proposal(2)
Capex Standard Control and Metering Revenue ($m)(1)(2)(5) and RAB ($bn)(4)
$852m $852m $1, 624m $2,140m
($2021)
$1,000
Opex
$472m $569m $1,181m $1,537m
($2021)
$800
WACC 6.11% 4.52% 6.11% 4.52% $600
8.01 8.37
7.61
6.59 7.11
5.72 6.00 6.29
$400 5.27 5.47
Risk-free Rate 2.48% 1.32% 2.48% 1.32%
$200
Gamma 0.4 0.585 0.4 0.585
$-
FY17 FY18 FY19 FY20 FY21 FY22 FY23 FY24 FY25 FY26
CitiPower Revenue Allowance Powercor Revenue Allowance
Revenue(3)
$1,681m $1,599m $3,694m $3,695m CitiPower Proposal (Revenue) Powercor Proposal (Revenue)
($2021)
VPN Regulated Asset Base
A transition period will apply between 1 January 2021 and 30 June 2021 to give effect to the Victorian Government’s intent to delay the
5 year regulatory period
(1) CitiPower, Regulatory Proposal 2021-2026, 31 January 2020 (2) Powercor, Regulatory Proposal 2021-2026, 31 January 2020 (3) Includes metering revenue (4) RAB values from RAB roll-forward model (RFM) and post-
tax revenue model (PTRM) submitted with CitiPower and Powercor regulatory proposals on 31 January 2020 (5) AER: CitiPower – Final Decision 2016-2020 updated to $2021 and AER: Powercor – Final Decision 2016-2020
updated to $2021
Spark Infrastructure I Investor Presentation I August 2020 22INFRASTRUCTURE FOR THE FUTURE
REGULATORY TIMELINES
Determinations for SA Power Networks and Victoria Power Networks will incorporate lower returns from the AER’s 2018 decisions on the
Rate of Return Instrument (RORI) and tax, but revenue will be certain for the five-year regulatory periods
QNI QNI CPA PEC PEC HumeLink CPA & Draft Final
CPA Final Decision CPA (final) CPA Final Final Decision Decision Decision
17 Jan 28 April Q3 Decision Q3-Q4 Proposal Sept Revised April Period
VNI PEC Q4
due proposal due commences
HumeLink PACR (1) CPA (initial) VNI CPA & HumeLink
PADR(1) 14 Feb 29 June
Jan Dec 1 July
Final Decision PACR
10 Jan Q3-Q4 Q1
2019 2020 2021 2022 2023
SA POWER NETWORKS 2020 to 2025
Proposal Revised Final Draft 6 month Period
submitted Proposal Decision Decision transition commences VICTORIA POWER NETWORKS 2021 to 2026(2)
31 Jan 10 Dec 5 June Sept period 1 July
1 Jan2 TRANSGRID 2018 to 2023 (MAJOR PROJECTS3)
Draft Proposal Period Revised Final
Decision submitted commences proposal Decision TRANSGRID 2023 to 2028
8 Oct 31 Jan 1 July Dec April
Regulatory processes to support delivery of Major Projects are underway in 2020
(1) The Regulatory Investment Test Transmission (RIT-T) and contingent project application (CPA) processes are expected to occur throughout 2020 and 2021 (2) 6 month transition period will occur between 1 January 2021
and 30 June 2021 as a result of the Victorian Government decision to change the regulatory period cycle to a 1 July commencement date. A 5 year regulatory period will commence from 1 July 2021 (3) Revenue will be
adjusted in the current regulatory period to incorporate the AER’s decisions on CPA’s – Dates subject to change.
Spark Infrastructure I Investor Presentation I August 2020 23INFRASTRUCTURE FOR THE FUTURE
REGULATORY REVIEWS
We will engage and advocate for outcomes that support returns required while delivering lower costs to customers
Review Objective Implementation
Converting the ISP into action
ESB Streamline regulatory processes whilst retaining a rigorous cost / benefit assessment 1 July 2020
(proposed rule changes)
AEMO 2020 Integrated System Plan (ISP) Roadmap for Australia’s power system that maximises market benefits July 2020
AEMC Deferral of network charges Support retailers in financial difficulty as a result of customers not paying bills due to COVID-19 August 2020
AER Inflation Review Assess performance of inflation forecasting methodology and impact on returns End 2020
AEMC Rules to integrate DER Allow two-way energy flows and charging for export End 2020
Regulatory Framework for stand alone Allow customers to benefit from new technology that lowers costs of providing regulated
AEMC End 2021
power systems services
Sets out approach to estimate rate of return: return on debt, return on equity and value of
AER Rate of Return Instrument (RORI) Dec 2022
imputation credits
AEMC Rules to facilitate system stability Create new markets for synchronous services, reserve markets and ahead markets Prior to 2025
Coordination of Generation and Better co-ordinate generation and transmission investment to improve the efficiency of dispatch
AEMC Transmission Investment (COGATI) and location of generators; provide certainty to support new investment and improve planning 2025
Access and Charging(1) information
Develop long-term, fit-for-purpose market framework to enable provision of full range of
Post 2025 National Electricity Market
ESB services to customers necessary to deliver a secure, reliable and lower emissions electricity 2025
(NEM) Design
system at least-cost
(1) Now incorporated in to the ESB’s post 2025 NEM Design program as Grid Access
Spark Infrastructure I Investor Presentation I August 2020 24INFRASTRUCTURE FOR THE FUTURE STRATEGY AND GROWTH DELIVERING GROWTH FOR THE FUTURE Spark Infrastructure I Investor Presentation I August 2020 25
INFRASTRUCTURE FOR THE FUTURE

STRATEGIC VISION AND PRIORITIES

     OBJECTIVE                                                                                                 BUSINESS MODEL

     Delivering long-term value through capital                                                                Value Enhance
                                                                                                               Managing our portfolio for performance
     growth and distributions to Securityholders from                                                          and organic growth through efficient
     our portfolio of high-quality, long-life essential                                                        investment

     services infrastructure businesses
                                                                                                               Value Build
     By building sustainable businesses and harnessing their evolving growth                                   Developing adjacent business
     potential we will continue to create long-term value for Securityholders                                  platforms

                                                                                                               Value Acquire
                                                                                                               Growing through disciplined
     ELECTRICITY                     RENEWABLE               ELECTRICITY   GAS NETWORKS /   WATER NETWORKS /   acquisitions
     NETWORKS                        ENERGY                  STORAGE       GAS STORAGE      WATER STORAGE

Spark Infrastructure I Investor Presentation I August 2020                                                                                              26
INFRASTRUCTURE FOR THE FUTURE
AUSTRALIA’S ENERGY MARKET IS IN TRANSITION
The Australian Energy Market Operator’s (AEMO) 2020 Integrated System Plan (ISP) was released in July 2020 and identifies nationally
significant and essential investments in the electricity system and outlines the forecast installed capacity requirements for generation
Key market requirements in the 2020 ISP(1) Networks are critical enablers of the market’s transition
• Around 18 transmission projects including 10 in NSW,
representing direct opportunities for TransGrid with a combined
estimated capital cost of approximately $13bn(2)
• Targeted grid investment needed to balance resources across
States and unlock Renewable Energy Zones (REZs)
• Over 26 GW of new grid-scale renewables is needed to replace
approximately 15 GW or 63% of Australia’s coal-fired generation
by 2040
• 6-19 GW of new dispatchable resources are needed in support
to firm up the inherently variable nature of distributed and large-
scale renewable generation
• Rooftop solar expected to more than double (to ~25 GW),
supplying up to 22% of total energy by 2040 Transmission Distribution
(1) Optimal development path Source: AEMO, 2020 Integrated System Plan
(2) AEMO’s modelled cost estimates in the 2020 ISP
Spark Infrastructure I Investor Presentation I August 2020 27INFRASTRUCTURE FOR THE FUTURE
TRANSMISSION INVESTMENT IS A PREREQUISITE
Substantial and sequential investment in the transmission network is required to deliver energy security and reliability, support
proposed generation connections, unlock renewable energy resources and reduce total system costs to customers
Drives $8bn of private
investment
Creates > 1,200 jobs
Reduces electricity
bills by $40 per year
Network investments
expected to deliver $11
• NSW Government will seek
billion in net benefits to to legislate the requirement
the National Electricity for ISP priority projects to
Market (NEM) proceed
• Projects can proceed ahead
• More than $19bn(1)
of Network of RIT-T
Investment required by 2040
1 Estimate practical completion including any subsequent testing – projects may be delivered earlier
• NSW Electricity Strategy
• Around includes a pilot 3 GW REZ
2 Decision rules may affect timing
$13bn(1)
associated with 3 May be accelerated by government initiatives
4 Not shown on map. AEMO requires that preliminary engineering designs be completed by 30 June 2021
NSW and TransGrid opportunities
(1) AEMO’s Modelled Cost of Projects 2020 ISP
Spark Infrastructure I Investor Presentation I August 2020 28INFRASTRUCTURE FOR THE FUTURE
TRANSGRID OPPORTUNITIES
From mid-2020 under the National Electricity Rules there is a requirement to progress the regulatory process and preparatory work for
actionable ISP projects
Bulli Creek Mudgeeraba
AEMO ISP 2020 Delivery
TransGrid Network Opportunities
Modelled Cost Target(1)
2018-2023 capex allowance $1.2bn N/A
Committed
QNI upgrade and New
QNI Minor (2)$0.2bn 2021-22 England Energy Zone
Actionable
VNI Minor (3)$0.1bn 2022-23
Project EnergyConnect (3)$2.0bn 2024-25 Central West Energy Zone
HumeLink (3)$2.1bn 2025-26
Central-West Orana REZ Transmission Link $0.7bn 2024-25
VNI West (Kerang Route)(4) (3)$2.4bn 2027-28
Project EnergyConnect and
South West Energy Zone Sydney
Total $7.3bn
Preparatory Activities Required HumeLink
2032-33 to Red Cliffs
QNI Medium & Large $3.3bn
2035-36
(5)$1.3bn Options being assessed (RIT-T)
New England REZ Network Expansion 2030s
North West NSW Network Expansion (6)$0.9bn 2030s SnowyLink South
Area with generator connection interest
Total $5.4bn NSW Government energy zone Wodonga
Existing transmission infrastructure
Total ISP Modelled Projects $12.9bn NSW transmission developments (ISP)
Dederang NSW Map Source: TransGrid,
Transmission Annual Planning Report 2019
New transmission developments (Energy Zones)
(1) AEMO 2020 ISP (2) Contingent Project Application (CPA) Approved 28 April 2020 (3) RIT-T process underway (4) Actionable with decision rules (5) Includes combined costs for Stage 1 & 2
(6) Includes combined costs for Stage 1,2 & 3
Spark Infrastructure I Investor Presentation I August 2020 29INFRASTRUCTURE FOR THE FUTURE
TRANSGRID – CHANGE OF SECURITYHOLDERS
Market valuations still do not reflect Spark Infrastructure’s 15.01%
Wren House • Spark Infrastructure notes the completion of the sale process for the 19.99% stake in TransGrid held by Wren House to OMERS of Canada
Infrastructure (WHI)
stake sold to Ontario • The process to sell WHI stake in TransGrid commenced in early 2020 and was offered to Spark Infrastructure and other securityholders in
Municipal Employees accordance with the pre-emptive process under the Securityholders Deed
Retirement System
(OMERS) • Spark Infrastructure declined to participate and notes that its 15.01% equity investment in TransGrid was purchased for $734.3 million in
December 2015
• The implied equity value on a proportional basis represents an approximate compound annual increase of 4.0% p.a. in addition to an
approximate average distribution yield of 4.6% p.a. reflecting the improved business performance, growth in regulated and contracted
assets (RCAB) as well as the anticipated significant and attractive growth pipeline
• The valuation acknowledges TransGrid’s high quality business and once in a generation RAB and contracted growth pipeline
Valuation reflects • Regulated asset transactions have averaged an EV / RAB of 1.40x since 2007
RAB and CAB growth
emanating from ISP • Pipeline of growth opportunities is expected to double TransGrid’s RAB in the current decade, assuming all ISP projects receive regulatory
approval and proceed
• CAB is a material component of the EV; CAB is currently $728m (growth of 43.2% in last 12 months); continued growth in CAB expected to
be driven by connections of new large-scale renewable projects
• Including CAB and valuing growth in RAB and CAB substantially adds to the headline RAB premium
Spark Infrastructure I Investor Presentation I August 2020 30INFRASTRUCTURE FOR THE FUTURE
RENEWABLES – BOMEN SOLAR FARM
Our first investment is now operational – with construction completed under budget. Despite COVID-19 affecting commissioning, hold
point testing has been completed and the farm has been operational and able to export 100% of generation since mid-June 2020
Project Snapshot
Capacity ~120.5 MW DC (~100 MW AC) SKI Acquires Construction Operational
Bomen Solar Farm Complete
Total cost at completion ~$180m(1) (~$8m under budget) April 2019 Jan 2020 June 2020
Expected Revenue (P50) ~$13.5m p.a. for first 5 years(2)
Gearing ~70% June 2019 March 2020
Construction AEMO
O&M and Asset Management Beon Energy Solutions (Beon) and RES Commences Registration
Key Success Factors
PPAs
✓ Strong partnerships with Beon (EPC and O&M), TransGrid (Connection), Westpac (PPA 1) ~95%
and Flow Power (PPA 2) contracted for the
first five years
✓ Optimised design to add an additional 0.5MW DC
~82%
✓ Construction delivered under budget by Beon and TransGrid contracted for the
first 10 years
✓ Strong grid location with robust MLF and no system strength issues identified
✓ Provided around 200 jobs during construction with a focus on local jobs and supporting PPA Counterparties
local businesses 10 YEARS
Westpac
✓ Community focus - in partnership with Westpac, established a fund to invest $1 million
over ten years in community initiatives
5,7, & 10 YEARS
Flow Power
(1) Includes purchase of land, construction costs, construction of dedicated transmission line and capitalised interest during construction
(2) Average annual revenue considering PPA agreements, loss factors and plant output on P50 forecast
Spark Infrastructure I Investor Presentation I August 2020 31INFRASTRUCTURE FOR THE FUTURE
RENEWABLES – OPPORTUNITIES
Spark Infrastructure is uniquely positioned to provide solutions for a sustainable future by investing in adjacencies that are
complementary to the existing portfolio businesses
Core Investment Areas Build or Acquire Enhance Network Businesses
Renewable Energy
Solar Wind Storage Generation and Storage
• >15GW forecast installed • >16GW forecast installed • ~13GW installed capacity
capacity between 2022-2042 capacity between 2022-2042 forecast between 2022-2042
in the NEM(1) in the NEM(1) in the NEM(1)
• Evaluating further opportunities for Bomen Solar Farm (including storage), particularly arising from
the Wagga Wagga Special Activation Precinct
• Exploring greenfield development projects in the NEM (wind, solar and storage)
• Seek to work with our asset companies wherever possible
• Objective is to build a diversified renewables platform
Other Investment Areas under Consideration
Renewable Energy Zones Green Hydrogen Virtual Power Plants
(1) AEMO’s 2020 ISP Central Scenario (DP1)
Spark Infrastructure I Investor Presentation I August 2020 32INFRASTRUCTURE FOR THE FUTURE SUSTAINABILITY E N V I R O N M E N TA L , S O C I A L A N D C O R P O R AT E G O V E R N A N C E Spark Infrastructure I Investor Presentation I August 2020 33
INFRASTRUCTURE FOR THE FUTURE

SUSTAINABILITY
Our ownership of long-life, high performing essential services infrastructure businesses enables us to ensure sustainable policies and
practices are adopted through robust governance, risk management and operational performance oversight

      Climate Change                                                                                                                                         Health, Safety and Wellbeing
      Embedding policies and strategies that drive tangible                                                                                  Fostering a safety culture across all investment
      changes through asset management, network design and                                                                               companies and integrating systems that support both
      procurement                                                                                                                                                employees and contractors

      Resource Management                                                                                                                                                               People
      Growing and innovating business solutions to support and                                                                        Committed to delivering a strong inclusive values-based
      enable energy transition while reducing waste                                                                                  culture that promotes diversity and enables all employees
                                                                                ENABLING THE        EMPOWERING                                                       to thrive and be successful
                                                                                TRANSITION TO       OUR PEOPLE
                                                                                A LOW-CARBON           AND
                                                                                   FUTURE           COMMUNITIES
      Environmental Protection                                                                                                                                Customers and Community
      Minimising negative impacts on the environment by                                                                              Enabling safe, reliable and affordable electricity supply to
      ensuring the highest standard of management practices                                EMBEDDING                                 our customers and contributing to the development of our
      are embedded and compliance standards are maintained                                RESPONSIBLE                                communities by investing in initiatives that make a lasting
                                                                                       BUSINESS PRACTICES                                                                        positive impact

      Corporate Governance                                                                                                                                                Risk Management
      Maintaining an effective governance and decision making                                                                             Ensuring effective identification of material risks and
      structure through representation on the Board and                                                                                        putting in place an adequate and effective risk
      Committees of the portfolio businesses                                                                                                         management and internal control system

                                                                                    Financial Management
                                                                 Maintaining a balanced portfolio where earnings will be supported
                                                                 by growth in the underlying assets of the businesses and through
                                                                  sustainable investment in high value unregulated opportunities

Spark Infrastructure I Investor Presentation I August 2020                                                                                                                                          34
INFRASTRUCTURE FOR THE FUTURE
SAFETY AND SOCIAL
Fostering a safety culture and supporting the customers and community in which our networks operate
Victoria Power Networks SA Power Networks TransGrid
Initiatives / Achievements Initiatives / Achievements Initiatives / Achievements
• Implementing a Human Factors Improvement Program • Implementing a Contractor Management System with • Launched an end-to-end Contractor Safety
aimed at improving capabilities to identify and eliminate Kineo SitePass. Planned rollout is on track for full Management System providing real-time data to site
errors that can lead to incidents or injuries implementation by the end of 2020 managers and line leadership teams
• Facilitated a Health and Safety Reset in May with all
• Updated field inspection checklists to address work • Increased focus on analysis of data within Enablon – SA
employees and contractors emphasising commitment to
stream-specific requirements aimed at improving the Power Networks safety and event management system
a safe workplace for all
identification of risks to drive opportunities for ongoing improvement
• Leveraging innovative drone technology to complete
• Piloted a virtual reality (VR) training program providing a • Developing innovative and cost-effective approaches to transmission line stringing across more challenging
safe environment for staff to virtually engage with deal with issues emerging from rapidly increasing levels sections of the electricity grid
substations and realistic work site environments of rooftop solar generation
• Reconciliation Action Plan ‘Innovate’ was launched in
• Created ten new jobs at a Bendigo contact centre to • Embedded a Customer Consultative Panel that has February 2020. 72 initiatives are outlined across the 3
further enhance customer service during the been in place since 2009 which ensures the customer commitment areas of Respect, Relationships and
coronavirus pandemic voice is considered in decision making and consists of a Opportunities. The second phase of Reconciliation
range of key stakeholder groups builds on strong foundations.
• Supported multiple community events through • Donating over $170,000 through TransGrid’s
sponsorship and volunteering with employees once • Employee Foundation has exceeded significant Community Partnerships Program to 28 not-for-profit
again on track to achieve their annual target of 2,000 milestones in donating over $3 million to the South groups as part of TransGrid’s ongoing commitment to
volunteer hours Australian community build positive relationships with local communities
Spark Infrastructure I Investor Presentation I August 2020 35INFRASTRUCTURE FOR THE FUTURE
ENVIRONMENTAL
Delivering essential services in a manner that protects the environment and builds a more sustainable network for the future
Victoria Power Networks SA Power Networks TransGrid
Initiatives / Achievements Initiatives / Achievements Initiatives / Achievements
• Continually improving their Environmental Management • Developed a Climate Change Plan which documents • Developed a Network Climate Change Adaption
System by establishing, monitoring and reviewing the adaptation and mitigation risks, opportunities and Strategy which assists in designing and delivering a
objectives and targets initiatives within the business resilient network that can face future climate challenges
• Improved reporting of environmental incidents has • Enhancing the Environmental Management System and • Invited to sit on the Steering Committee of the NSW
enabled the HSE team to more rapidly resolve issues other business processes to continue to increase Government’s Climate Change Cross Dependency
such as oil spills in substations positive environmental outcomes Initiative (XDI) Project
• Implementing phase two of three of the Rapid Earth • Implementing Sustainable Procurement initiatives and • Implemented improved ecology and aboriginal cultural
Fault Current Limiter (REFCL) program providing extra working with traditional landowners to preserve cultural heritage risk management processes and updated
bushfire protection for the community heritage during projects internal due diligence assessments
• Upgrading public lighting to new energy-efficient and • Developed a circular economy model which includes • Implemented a Waste Tracking System (further
cost-effective LED technologies which require 80% less water and waste management initiatives which has seen enhancing the current enterprise hazard and risk
energy than older-style lighting a landfill diversion rate of ~76% across all sites management system – CAMMS)
• Solar enablement program (being considered by the • Implemented an efficient property maintenance strategy • Initiated the Infrastructure Sustainably Council of
AER) aimed at empowering customers to connect and which has seen ~40% of the 200,000+ streetlights Australia (ISCA) Infrastructure Sustainably rating
export solar into the grid managed by SAPN converted to LEDs process for an upcoming Major Project
Committed to the principles of sustainable development with responsible business practices
Spark Infrastructure I Investor Presentation I August 2020 36INFRASTRUCTURE FOR THE FUTURE CAPITAL MANAGEMENT P R U D E N T C A P I TA L M A N A G E M E N T W I L L D E L I V E R G R O W T H I N A S S E T B A S E Spark Infrastructure I Investor Presentation I August 2020 37
INFRASTRUCTURE FOR THE FUTURE

CAPITAL ALLOCATION HIERARCHY
Funding is prioritised toward Value Enhance investment in existing businesses

                            Value Enhance                                Value Enhance                                   Value Build                              Value Acquire
                            Regulated Assets                       Contracted Connection Assets                   Contracted Renewables                   Essential Services Infrastructure

            • RAB growth in regulatory                       • New renewable connections                 • Solar, Wind                              • Complementary asset opportunities,
              determinations                                                                                                                          and potential diversification
OBJECTIVE

                                                             • Transmission infrastructure (e.g. NETI)   • Battery storage
            • Actionable ISP projects (e.g. Project                                                                                                 • Assets with organic growth options
              EnergyConnect)                                 • Grid-scale storage, micro-grids and       • Renewable Energy Zones, Green
                                                               other grid-assets necessary to support      Hydrogen, Virtual Power Plants           • Assets supporting the energy transition
            • Renewable Energy Zones (e.g. Central             energy transition
              West)                                                                                                                                 • Pre-emptive rights on existing assets
BUSINESS

                                                             • TransGrid (transmission)
            • VPN, SAPN, TransGrid                                                                       • Spark Infrastructure                     • Spark Infrastructure
                                                             • VPN, SAPN (distribution opportunities)

                                                     Pipeline of Growth can be fully funded through DRP and substantial Debt Capacity
            • Assumes Distribution Reinvestment Plan (DRP) will remain active; scope of funds raised expanded to support a broader range of growth opportunities

            • Spark Infrastructure is on a credit rating glide path from Baa1 as regulatory resets reduce FFO/Net Debt ratio but is committed to investment grade rating

            • Additional debt products such as convertible bonds or an Australian medium-term note (AMTM) will be considered when appropriate

            • Growth supported by AEMO’s 2020 ISP + VPN/SAPN regulatory submissions

Spark Infrastructure I Investor Presentation I August 2020                                                                                                                                      38
INFRASTRUCTURE FOR THE FUTURE
CAPITAL PIPELINE - FULLY FUNDED
Indicative Growth Capex Indicative RCAB
(Proportionate $m) (Proportionate $m)
(647) (8,722)
(638) CAGR 6.2%
with Renewables Growth
(548)
6,466 CAGR 4.3%
(423) BAU + ISP Growth
368
(309)
199
153
121
2016 2017 2018 2019 2020 2021 2022 2023 2024 2019 2024
VPN SAPN TGD Renewables VPN SAPN TGD (RAB) TGD (CAB) Renewables
Indicative Funding
(Proportionate $m) • RAB growth supported by AEMO’s 2020 ISP + VPN/SAPN
(638) (647) regulatory submissions
(548)
• Contracted growth supported by AEMO ISP
(423)
368
(309) • Pursuing renewable development opportunities
199
121
153 • Growth fully funded through DRP and debt capacity
• Spark Infrastructure committed to investment grade ratings
2016 2017 2018 2019 2020 2021 2022 2023 2024
Asset Level Funding DRP Retained Cash/Corporate Debt
(1) SAPN values derived from SA Power Networks Final Determination – differential of annual opening RAB value vs closing RAB value, adjusted for SKI Financial Year
(2) VPN values based on CitiPower and Powercor Regulatory Proposals submitted 31 January 2020 – differential of annual opening RAB value vs closing RAB value, adjusted for SKI Financial Year
(3) Renewables growth equivalent to capex investment of 1 x Bomen Solar Farm (~$180m) per year in 2021-2024
(4) TransGrid includes regulatory RAB growth with QNI Minor and VNI Minor, indicative connections of c5.5GW and allowances of c$4.0bn for Project EnergyConnect and HumeLink (based on AEMO 2020 Modelled Costs)
Spark Infrastructure I Investor Presentation I August 2020 39You can also read